MACDAdaptive
- 指标
- 版本: 2.20
- 更新: 11 十一月 2026

MACD Adaptive is a MACD that adjusts its periods to the market and never repaints.
Every bar is calculated only with the data available up to that bar. If you reload the chart or restart the terminal, the history looks exactly the same as it did live. What you see in the past is what you would have seen in real time.
MAIN FEATURES
- Adaptive periods: shorter in a clean trend, longer in choppy noise. Can be switched off for a classic MACD.
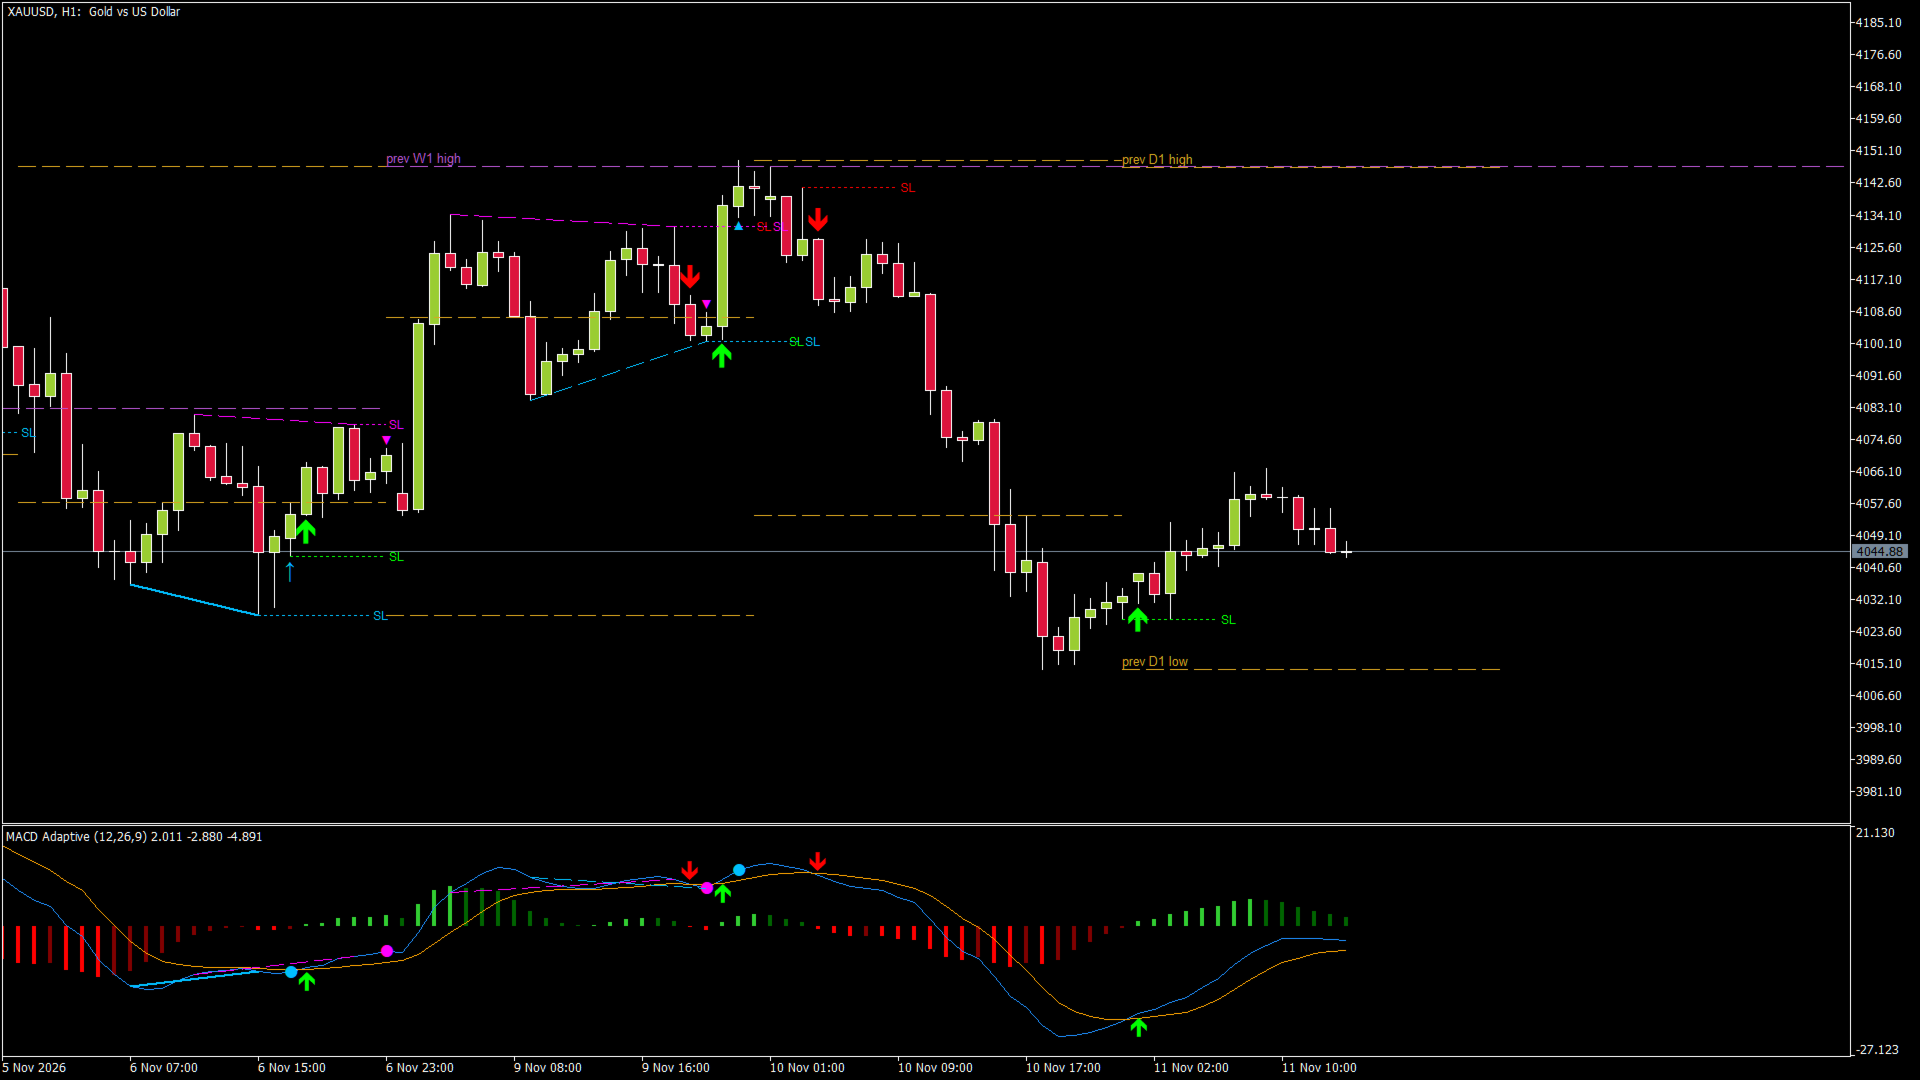
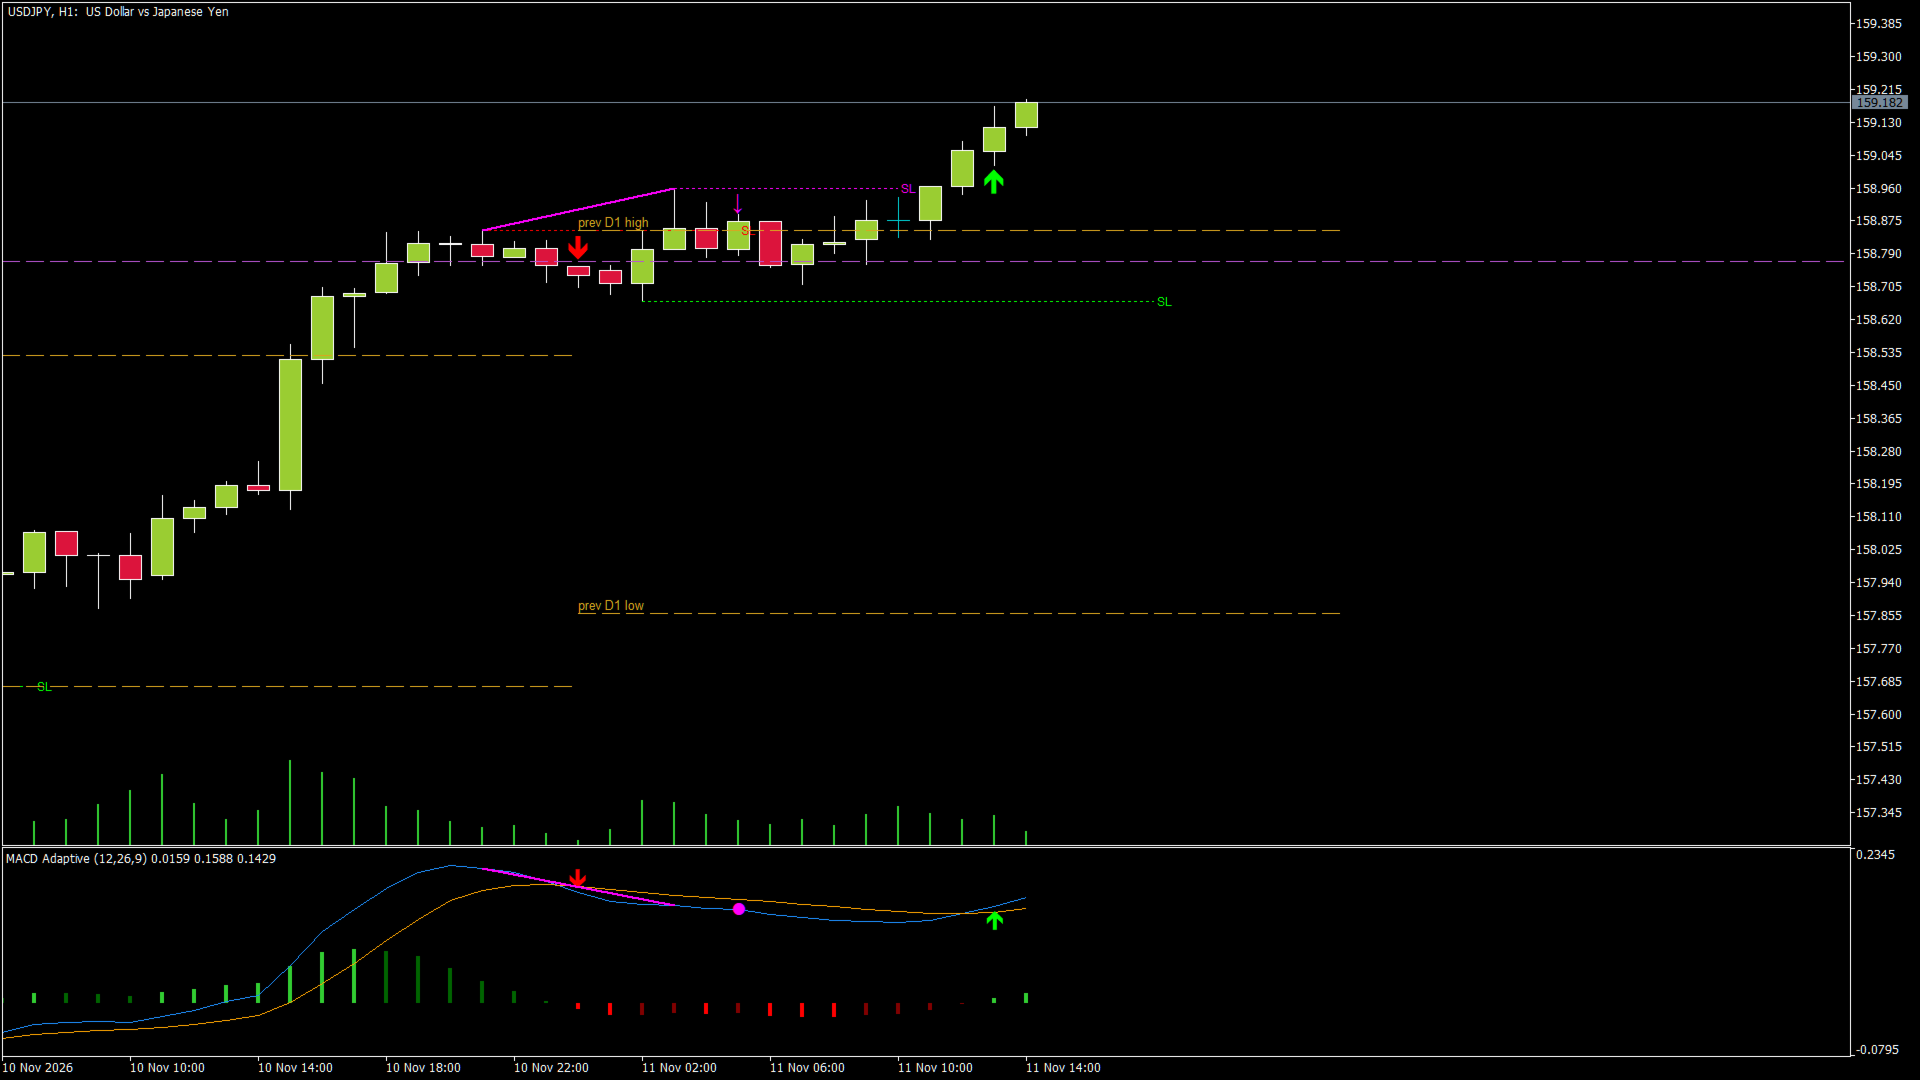
- Buy / Sell arrows on a CLOSED bar (final, never disappear) and a hollow "possible" arrow on the open bar.
- Regular and hidden divergences, confirmed only after the pivot is closed.
- Optional short SL lines for the signals (3 modes: 2 bars, structure / swing, signal bar) and at the divergence pivot.
- High / low of the previous candle of two higher timeframes (default D1 and W1) on the price chart.
- Popup and push alerts for signals and divergences. No alerts for history.
- Hover the mouse over any arrow, SL line, divergence or level: a tooltip explains what it is, the prices and the suggested SL.
- Works on any symbol and any timeframe. Buffers can be read by an Expert Advisor.
USER GUIDE
1. QUICK START
1) Attach MACD Adaptive to a chart. The default settings work on any symbol.
2) The MACD opens in its own window below the price chart. Arrows, divergence marks and higher timeframe levels are drawn on the price chart.
3) For push notifications on your phone: in MetaTrader 5 open Tools > Options > Notifications, enter your MetaQuotes ID (from the MetaTrader 5 mobile app, Settings > Messages) and enable push notifications.
4) Hover the mouse over any arrow, line or level to see a short explanation with the prices.
5) Everything that is drawn can be switched off in the inputs, so you can keep the chart as clean as you like.
2. READING THE MACD WINDOW
- Blue line = MACD (fast EMA minus slow EMA).
- Orange line = signal line (EMA of the MACD).
- Histogram = MACD minus signal line, in four colors:
bright green = above zero and growing (bullish momentum increasing),
dark green = above zero and shrinking (bullish momentum fading),
bright red = below zero and growing in size (bearish momentum increasing),
dark red = below zero and shrinking (bearish momentum fading). - A change from bright to dark color is often the first sign that a move is losing strength, before the lines cross.
- MACD above zero = the fast average is above the slow one (upward bias); below zero = downward bias.
3. ADAPTIVE PERIODS
The indicator measures how efficient the recent movement is over ERPeriod bars (efficiency ratio):
1 = price moved in a straight line, 0 = price went up and down and ended where it started.
- When the market moves cleanly, the periods become shorter (down to 0.5x of the base with AdaptRange = 0.5), so the MACD reacts earlier.
- When the market is choppy, the periods become longer (up to 1.5x of the base), so small swings do not produce crosses.
- ERCenter is the efficiency value where the periods equal the base periods (12 / 26 / 9). 0.3 is a typical value for gold and most FX pairs.
- Adaptive = false gives a classic MACD with the fixed base periods.
In practice: in a sideways market you get fewer crosses than with a normal MACD, and in a strong trend the crosses come earlier.
4. SIGNALS
- Buy = the MACD line crosses above the signal line. Sell = it crosses below.
- A full arrow is drawn only when the bar is CLOSED. It is final and does not repaint.
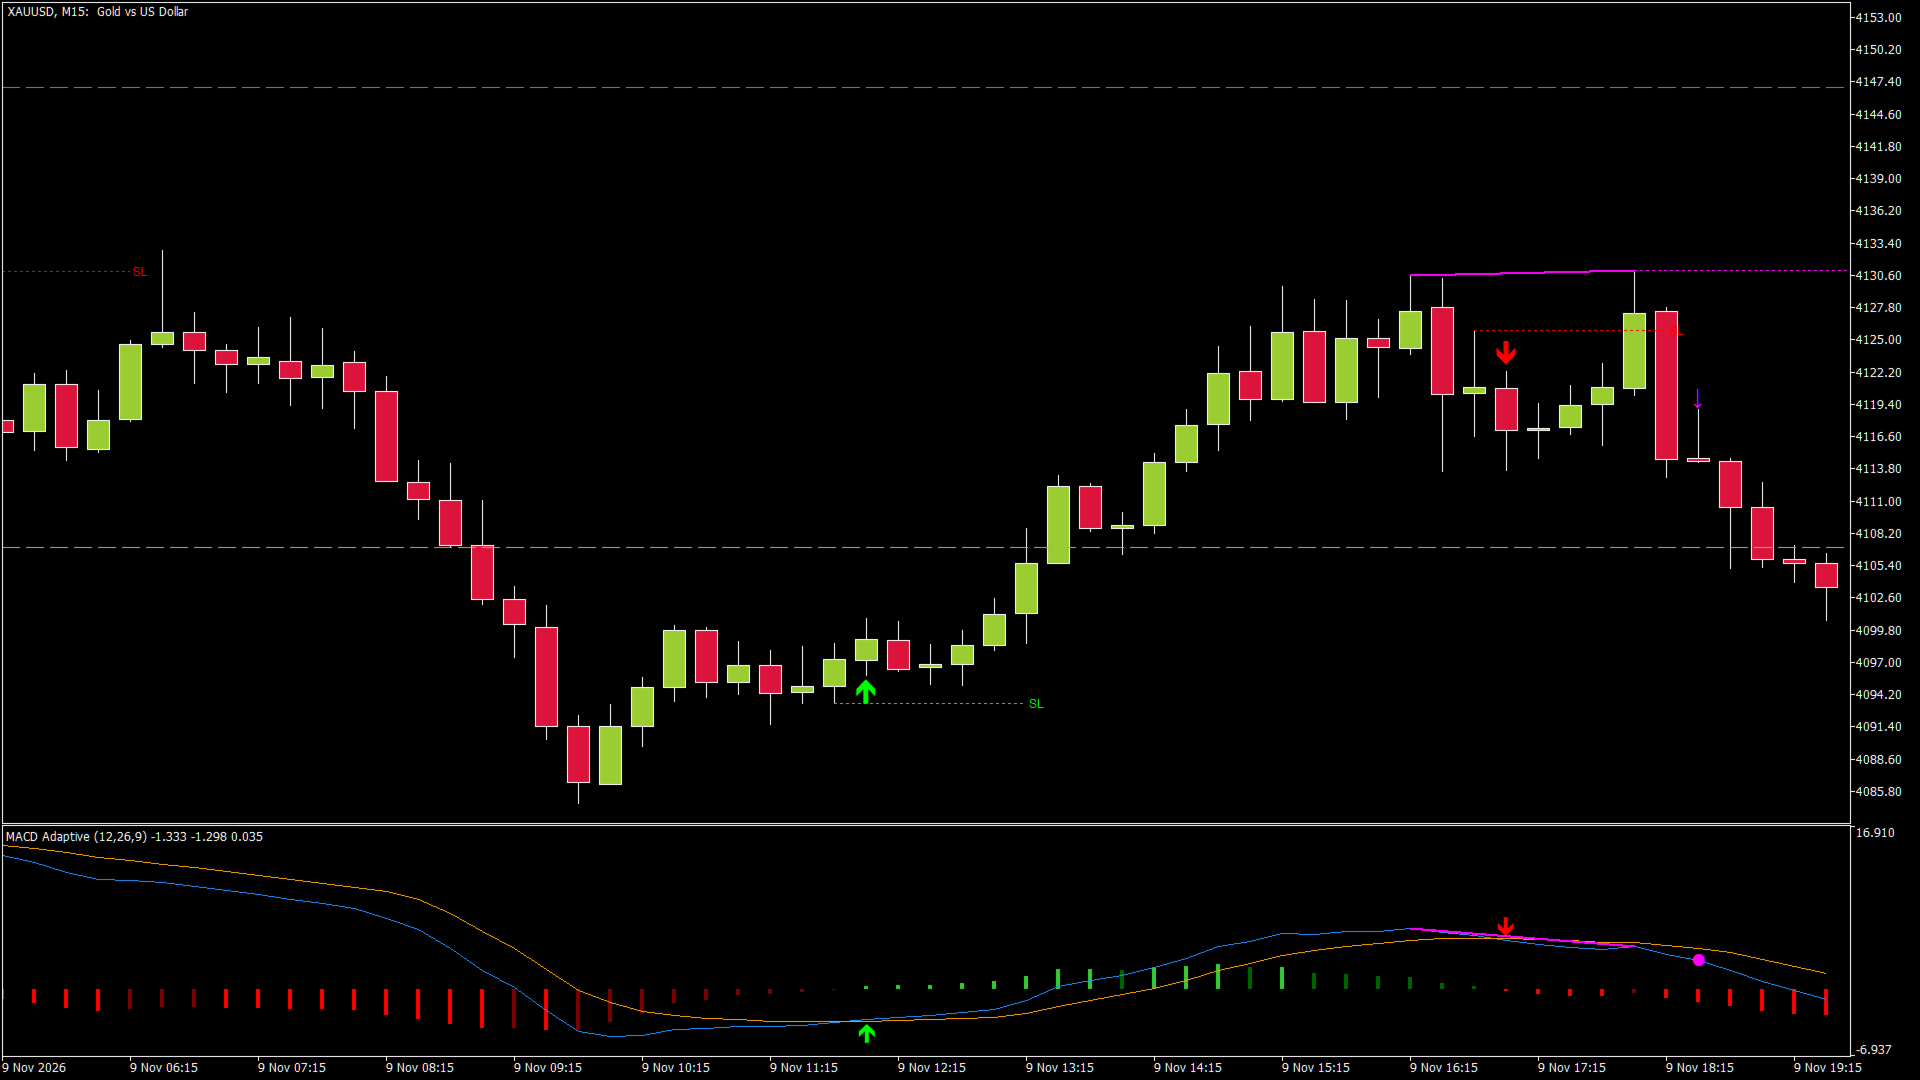
- Hollow arrow ("possible signal"): while the bar is still open, the lines are crossing right now. It can disappear before the close if the lines separate again. It is only a heads-up to look at the chart, not a signal.
- The alert for a confirmed signal comes when the bar closes. The alert for the possible signal is off by default (AlertPossible).
- SL line (ShowSignalSL): a short dotted line that shows a reference stop. SignalSLMode sets where it is:
Signal bar + previous bar (default): the lower low of the two bars for a buy, the higher high for a sell.
Structure (swing): the lowest low (buy) / highest high (sell) since the previous opposite cross, i.e. the swing the signal comes from. Wider stop, behind the structure.
Signal bar only: the low / high of the signal bar. The tightest stop.
The line starts at the bar where the stop level is and runs a few bars to the right. Note: the arrow is drawn below the buy bar (above the sell bar) so it does not cover the candle, so it is always a little further away than the SL line. The arrow marks the bar, not a price.
You can of course use your own stop.
5. DIVERGENCES
A pivot low is a bar with higher lows on both sides (PivotLeft bars on the left, PivotRight bars on the right). A pivot high is the mirror case. The indicator compares the last two pivots (between DivMinBars and DivMaxBars apart) in price and in the MACD.
- Regular bullish divergence (possible reversal up): price makes a LOWER low, the MACD makes a HIGHER low. Selling pressure is weakening.
- Regular bearish divergence (possible reversal down): price makes a HIGHER high, the MACD makes a LOWER high.
- Hidden bullish divergence (possible continuation up): price makes a HIGHER low, the MACD makes a LOWER low. Typical for a pullback in an uptrend.
- Hidden bearish divergence (possible continuation down): price makes a LOWER high, the MACD makes a HIGHER high.
On the chart:
- Solid line = regular divergence, dashed line = hidden divergence, drawn on the price chart and in the MACD window.
- Mark on the price chart: arrow = regular, small triangle = hidden.
- Optional dotted SL line at the pivot low / high.
Why the divergence appears a few bars later: a pivot is only certain when PivotRight bars after it have closed. The mark is drawn on the bar that confirms it (default 2 bars after the pivot). This is the price of no repainting: the divergence never moves or disappears afterwards.
A smaller PivotRight = earlier but more divergences; a larger one = later but fewer and cleaner.
6. HIGHER TIMEFRAME LEVELS
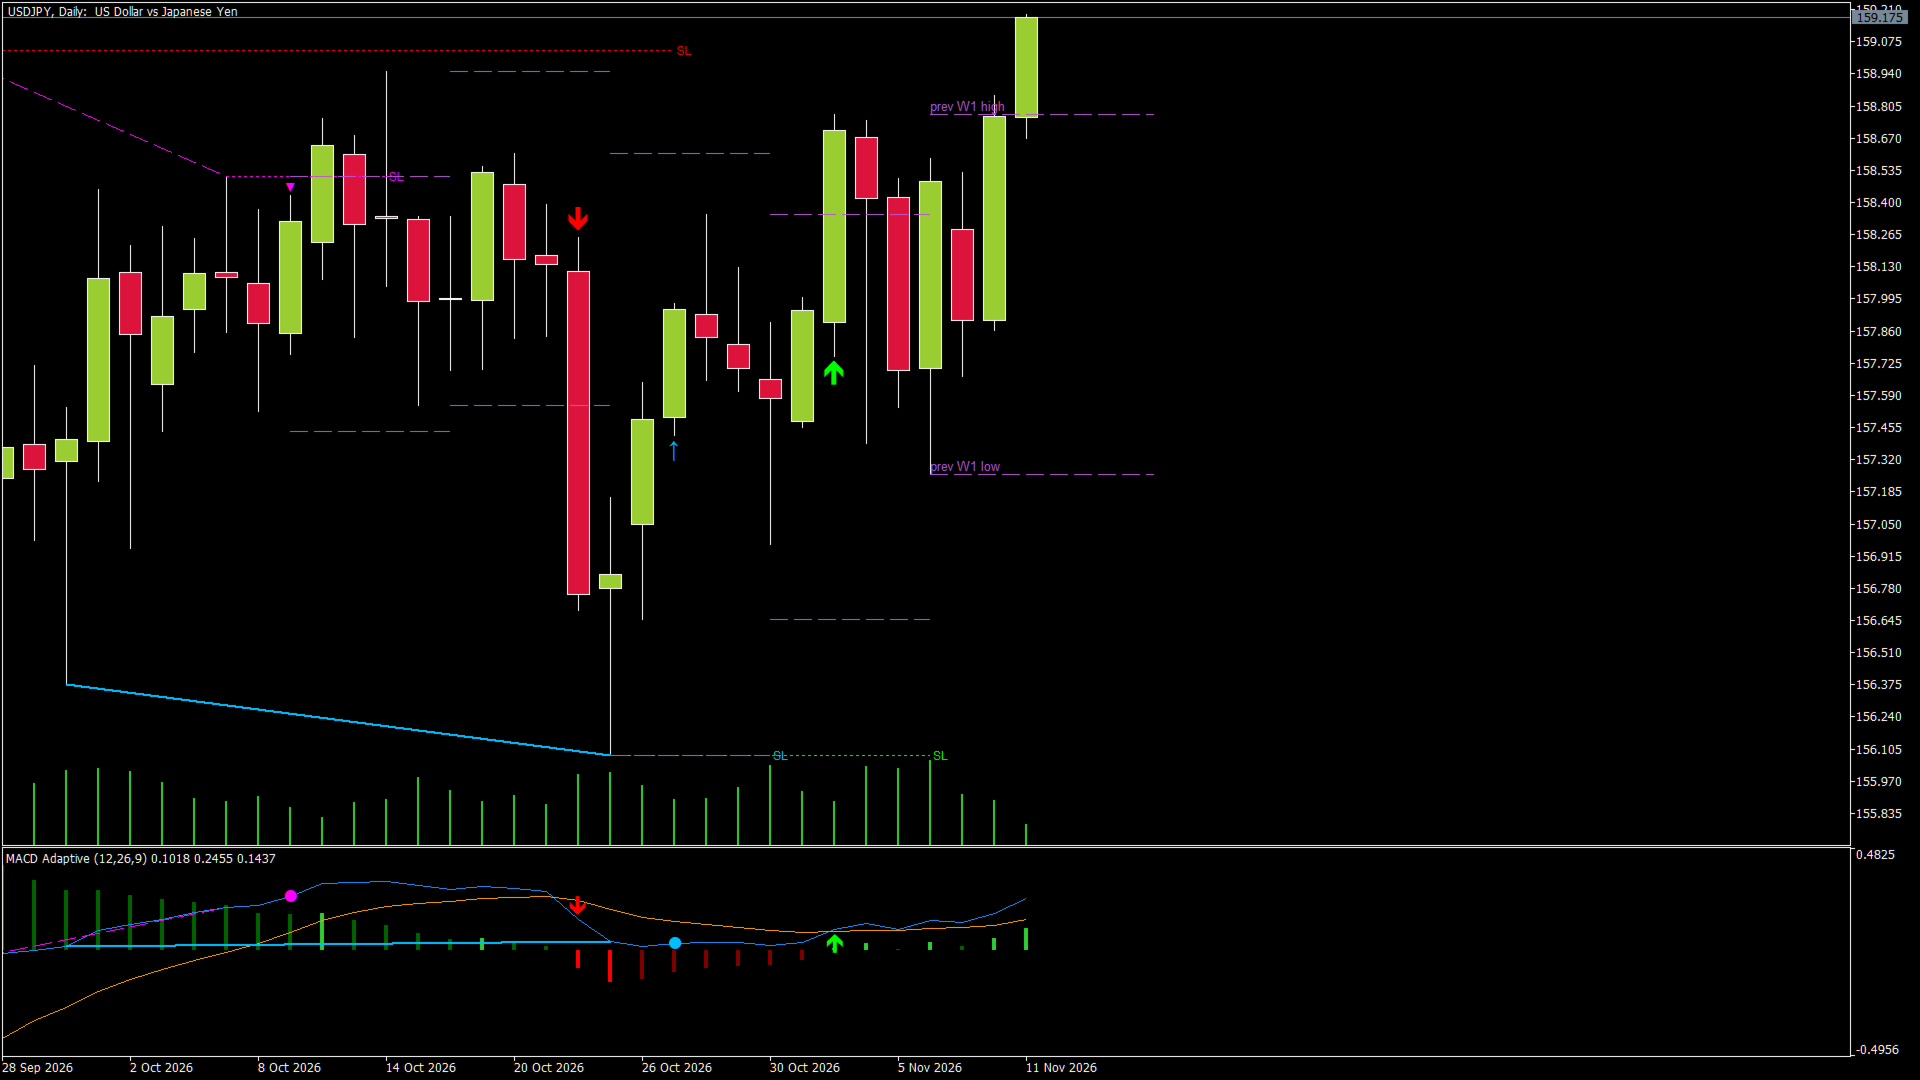
- The high and low of the previous candle of LevelsTF1 (default D1) and LevelsTF2 (default W1) are drawn as dashed lines across the current period. The most recent ones are labeled "prev D1 high", "prev D1 low" and so on.
- Optional: open and close (LevelsOpenClose) and the middle 50% (LevelsMid) of that candle.
- LevelsBack sets how many past periods are drawn.
- Levels are drawn only for timeframes higher than the chart. On a D1 chart the D1 levels are not shown; set LevelsTF1 = Current to switch a level set off.
- These levels are where many traders place orders: price often reacts there, stops are often placed behind them, and breakouts through them are watched.
7. A PRACTICAL WAY TO USE IT
The indicator shows where momentum changes. It does not tell you on its own which signal will work, so use it together with the trend and the levels:
1) Direction: check the trend on a higher timeframe (for example H4 or D1 for an H1 chart). Prefer signals in that direction.
2) Location: signals near a previous D1 / W1 high or low, or after a pullback to such a level, are more meaningful than signals in the middle of the range.
3) Trigger: a closed-bar arrow, or a hidden divergence in the direction of the trend (pullback ends), or a regular divergence at a strong level (possible reversal).
4) Stop: at the SL line (2 bars or structure) or behind the divergence pivot. If the stop is too large for your account, skip the trade or reduce the lot.
5) Exit: at the next level, at a fixed risk:reward, or when an opposite signal appears.
When to stay out:
- Arrows alternate Buy / Sell / Buy within a few bars: the market is sideways. Wait.
- The histogram is flat around zero: no momentum.
- A signal right before high-impact news.
Always test your own way of using it in the Strategy Tester (visual mode) or on a demo account first.
8. SUGGESTED STARTING SETTINGS
These are starting points, not optimized values:
- M1-M15 (intraday): defaults. If there are too many crosses, increase AdaptRange to 0.7 or the base periods (for example 16 / 34 / 9). Levels: D1 and W1.
- H1-H4: defaults. Levels: D1 and W1.
- D1: defaults. Levels: W1 and MN1.
- Very volatile symbols: try ERCenter 0.25. Calm symbols: try 0.35.
9. ALERTS
- AlertPopup: popup window with sound.
- AlertPush: push notification to the MetaTrader 5 mobile app (MetaQuotes ID required, see Quick start).
- AlertPossible: also alert the possible signal on the open bar (off by default, it can disappear).
- AlertDivergence: alert confirmed divergences.
Signal alerts contain the symbol, the timeframe, the direction and the close price of the signal bar. Divergence alerts contain the symbol, the timeframe, the direction and the type (regular or hidden).
10. USING THE INDICATOR IN AN EXPERT ADVISOR
Call iCustom with the indicator name and read the buffers (index: content):
0: histogram, 1: histogram color index, 2: MACD, 3: signal line,
4: Buy (MACD value on a buy bar, EMPTY_VALUE otherwise), 5: Sell,
6: possible Buy (open bar only), 7: possible Sell,
8: bullish divergence (on the confirming bar), 9: bearish divergence.
Read closed bars (shift 1 and older) for final values.
11. FAQ
- Does it repaint? No. Each bar uses only data up to that bar. Only the hollow arrow on the open bar can change, and it is marked as "possible".
- Why did an arrow disappear? It was the hollow "possible" arrow; the lines separated again before the bar closed.
- Why does the divergence appear later than the pivot? It needs PivotRight closed bars to confirm the pivot (see section 5).
- Why don't I see the D1 levels? You are on a D1 or higher chart, or the D1 history is still loading. It appears after the next tick.
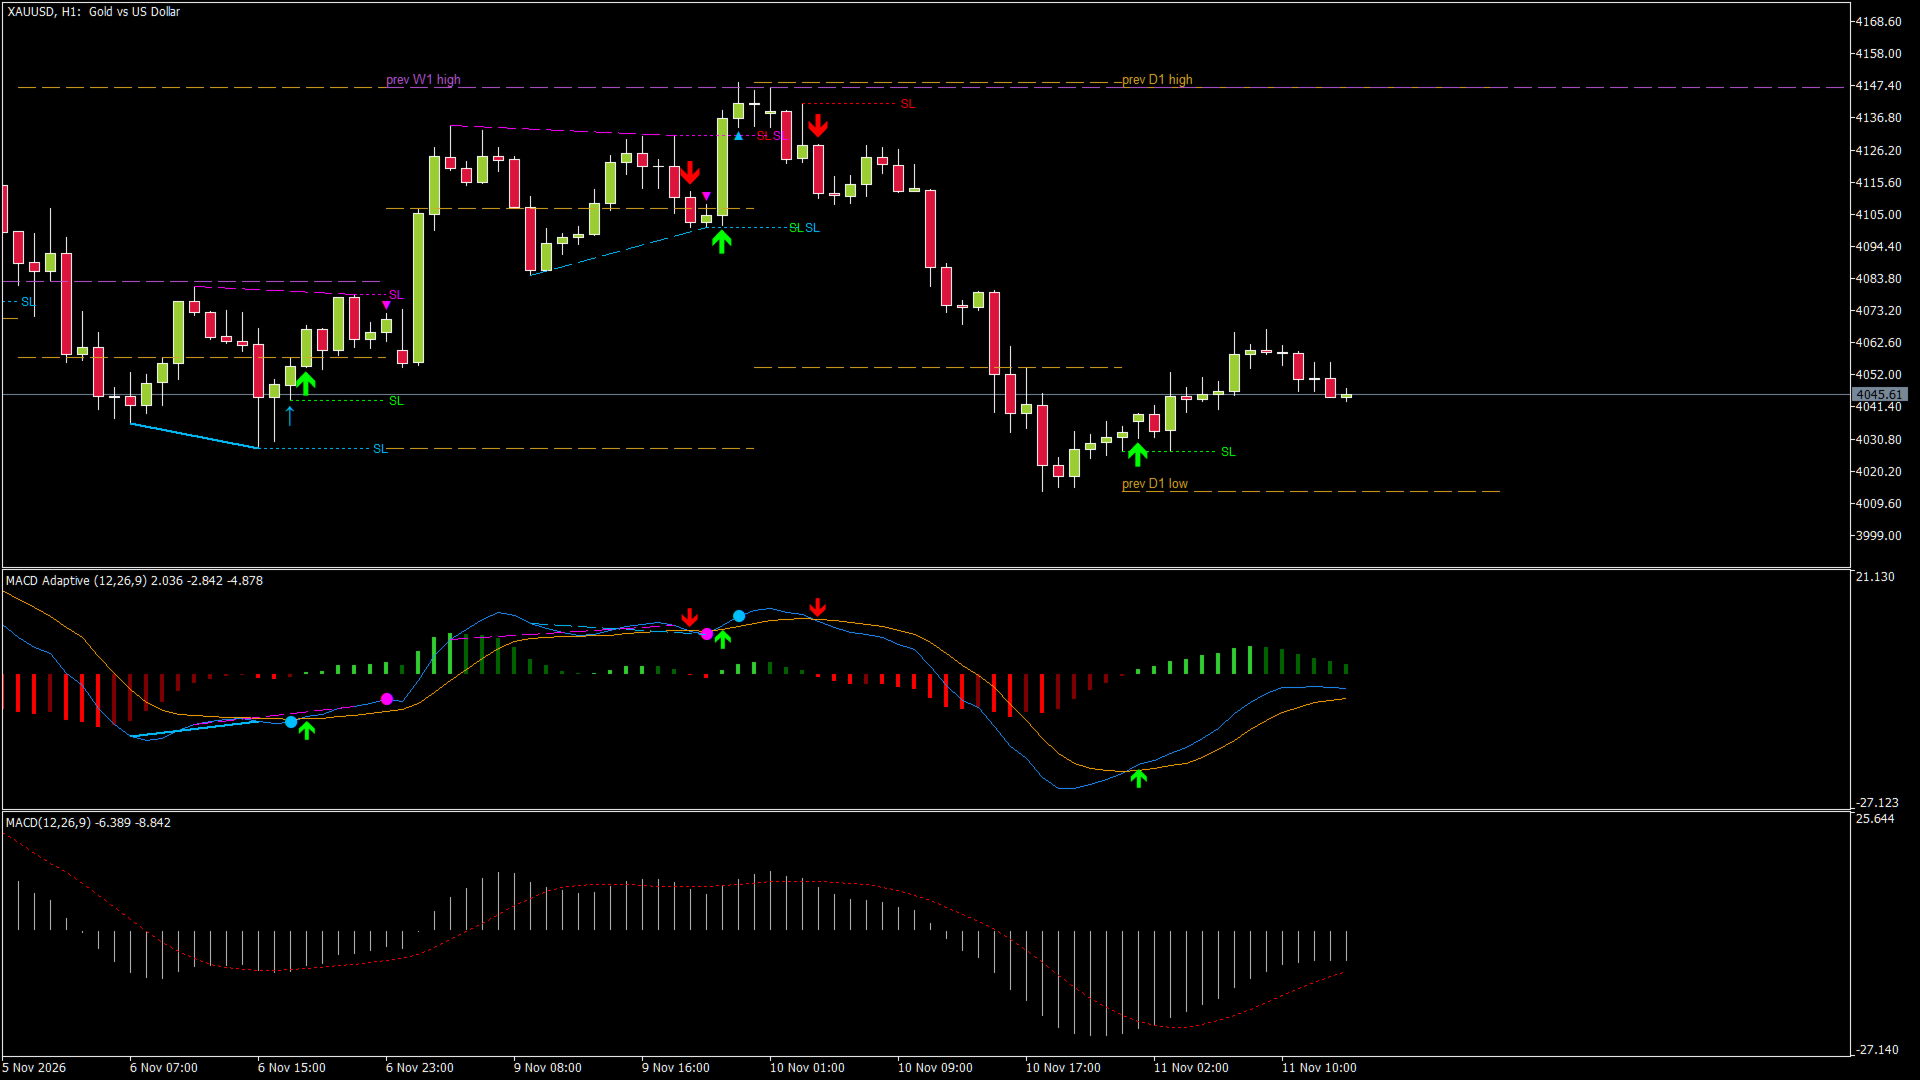
- Is it different from the standard MACD? With Adaptive = false it is a classic EMA MACD (note: the signal line is an EMA, while the built-in MetaTrader 5 MACD uses an SMA for the signal line). With Adaptive = true the periods change bar by bar.
INPUT PARAMETERS
MACD
- FastPeriod, SlowPeriod, SignalPeriod: base periods (12 / 26 / 9).
- PriceType: price used (Close by default).
Adaptive
- Adaptive: turn the adaptive periods on or off.
- ERPeriod: bars used to measure trend vs noise (10).
- AdaptRange: how much the periods can change. 0.5 = from 0.5x (clean trend) to 1.5x (pure noise) of the base periods.
- ERCenter: trend/noise value where the periods equal the base periods (0.3).
Signals
- ShowPossible: hollow arrow on the open bar.
- ArrowsOnPrice: also draw the arrows on the price chart.
- BuyColor, SellColor: arrow colors.
- ShowSignalSL: dotted SL line for the signals.
- SignalSLMode: Signal bar + previous bar / Structure (swing since the previous opposite cross) / Signal bar only.
- HistoryBars: chart objects only for the last N bars (3000).
Divergences
- ShowRegular, ShowHidden: which divergences to show.
- PivotLeft, PivotRight: bars on each side of a pivot. PivotRight is also the confirmation delay.
- DivMinBars, DivMaxBars: allowed distance between the two pivots.
- DivArrows: marks on the price chart.
- ShowDivSL: dotted SL line at the pivot.
- BullDivColor, BearDivColor: colors.
- SLLineBars: length of the SL lines in bars.
Higher timeframe levels
- LevelsTF1, LevelsTF2: timeframes of the levels (Current = off).
- LevelsBack: how many past periods to draw.
- LevelsOpenClose, LevelsMid: also the open / close and the middle of the candle.
- LevelsColor1, LevelsColor2: colors.
Alerts
- AlertPopup, AlertPush, AlertPossible, AlertDivergence.
IMPORTANT
This is a tool for analysis and manual trading. It does not open trades. No indicator guarantees profit: the signals show where momentum changes, and the decision, the stop and the position size are yours. Test it in the Strategy Tester or on a demo account first.