• 概述
  • 评论 (27)
  • 评论 (29)

Bermaui Channel

5

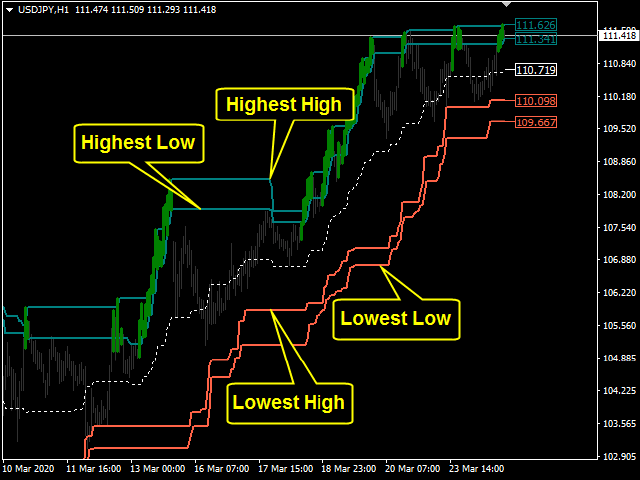
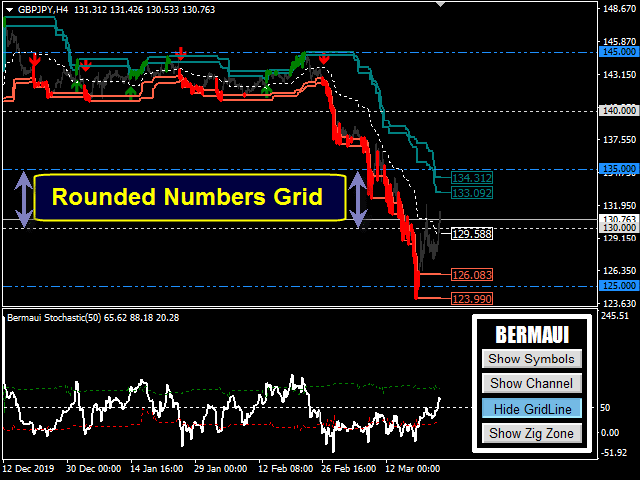
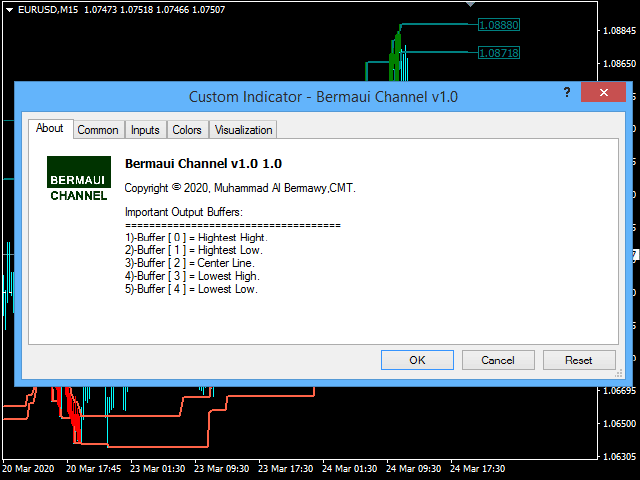
这是一个价格通道,在图表上显示五个重要的价格水平。这些级别是:

    1. 前 x 根柱线的最高价 (HH)。
    2. 前 x 根柱线的最高低点 (HL)。
    3. 中线。
    4. 前 x 根柱线的最低最高价 (LH)。
    5. 前 x 根柱线的最低价 (LL)。
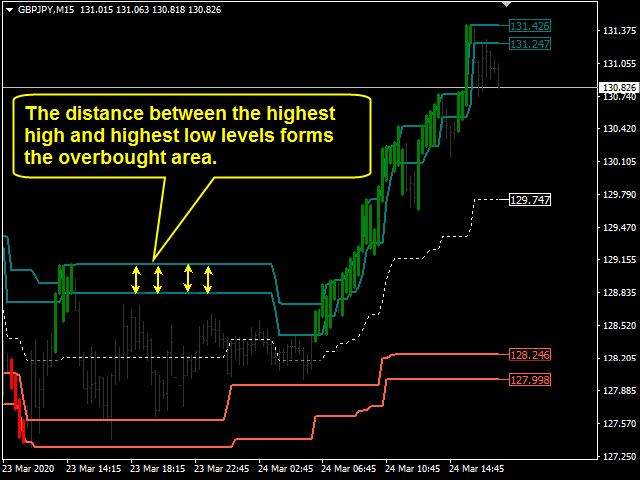
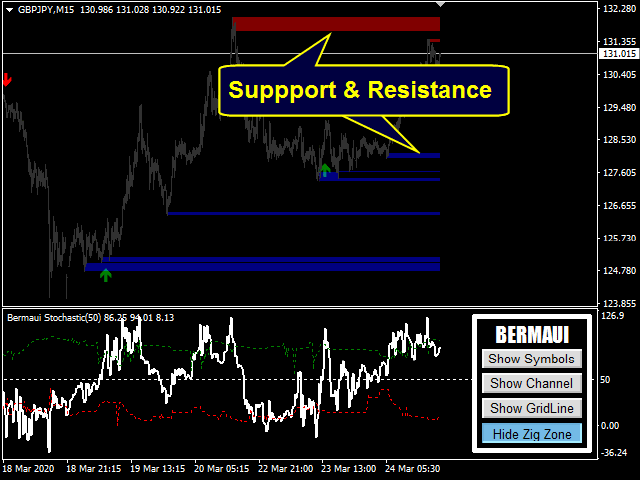
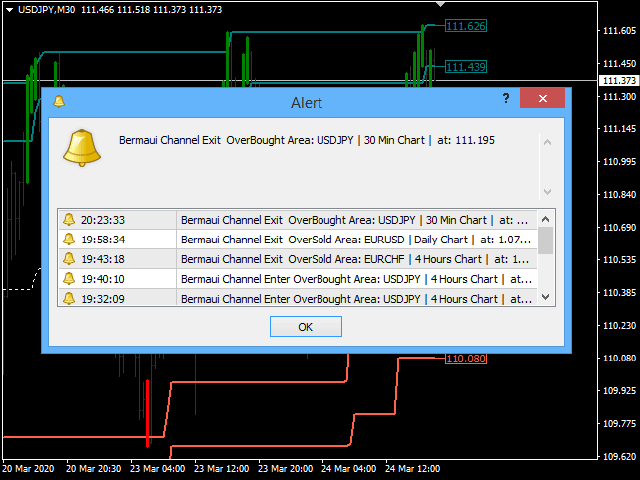
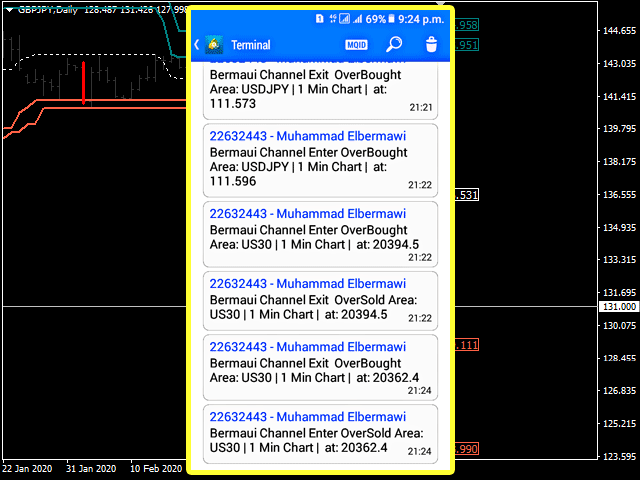
      如何Bermaui通道捕获 超买区域

        将 HH 和 HL 水平之间的距离视为超买区域。
            当价格蜡烛或柱线穿过 HL 向上时,这表明价格正在进入其超买区域。
                当价格蜡烛或柱线穿过 HL 向下时,这表明价格正在超出其超买区域。
                    当价格蜡烛穿过 HH 时,它会创造一个新的高点。这可能表明一个新的上升趋势的开始,该趋势将继续进行,直到价格再次反转下跌方向。

                      Bermaui Channels 如何捕捉 超卖区域
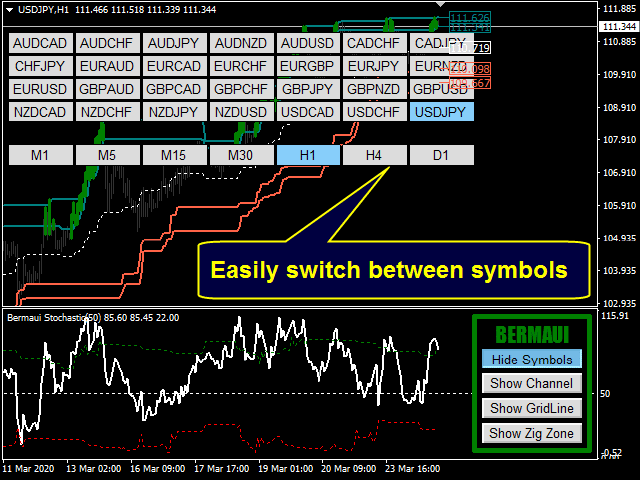
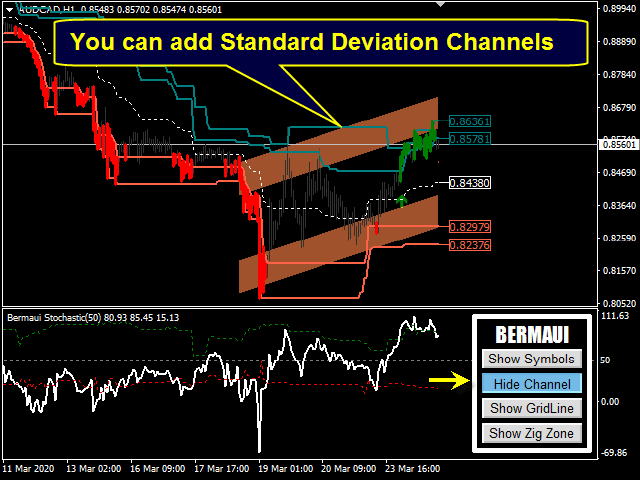
                        将 LL 和 LH 之间的距离视为超卖区域。
                            当价格蜡烛或柱线穿过 LH 向下时,这表明价格正在进入超卖区域。
                                当价格蜡烛或柱线穿过 LH 向上时,这表明价格正在超出其超卖区域。
                                    当价格蜡烛穿过 LL 时,它会创造一个新的低点。这可能表明新的下跌趋势的开始,该趋势将继续进行,直到价格反转其方向再次回到上行。


                                      伯毛伊海峡特色

                                        Bermaui Channel 不会重新绘制或重新计算其结果。
                                          它适用于加密货币、股票、指数、石油、黄金和所有时间范围。
                                            声音、电子邮件警报和移动通知。
                                              买入、卖出箭头有助于识别趋势信号。
                                                精心设计的参数可帮助用户轻松地在它们之间导航。
                                                  建立自己的专家顾问的缓冲区。
                                                    两种不同的颜色列表可供选择。
                                                      能够将超买和超卖绘制为价格蜡烛或条形图。

                                                        伯毛伊海峡参数

                                                        • 蜡烛。 BD% 计算中使用的蜡烛数量(最小值为 2)。
                                                        • 转移。向后移动的柱数。默认值为一。
                                                        • 声音警报。默认值为真。
                                                        • 发电子邮件。默认值为假。
                                                        • 发送通知。默认值为假。
                                                        • 颜色列表。您可以在两个颜色列表之间进行选择,也可以选择(什么都不做)。
                                                        • 显示价格标签。在通道的边缘。默认值为真。
                                                        • 价格标签宽度。默认值为一。
                                                        • 将 OB/OS 显示为:1. 条形| 2. 蜡烛| 3. 隐藏
                                                        • 超买区域颜色。默认为青色。
                                                        • 超卖区域颜色。默认为番茄。
                                                        • 看涨蜡烛颜色。默认值为绿色。
                                                        • 看跌蜡烛颜色。默认为红色。
                                                        • 烛芯宽度。默认值为一。
                                                        • 蜡烛主体宽度。默认值为四。
                                                        • 条宽。默认值为三个。


                                                        阅读此博客以了解如何使用缓冲区构建您自己的智能交易系统:
                                                        https://www.mql5.com/en/blogs/post/734560


                                                        如果您有任何问题,请通过私信与我联系,或者在评论部分写下它们。
                                                        Muhammad Al Bermaui,CMT


                                                        评论 20
                                                        awasthisp
                                                        724
                                                        awasthisp 2023.08.26 09:30 
                                                         

                                                        It is one of best indicator to capture OB and OS areas

                                                        mostafa gamal
                                                        43
                                                        mostafa gamal 2023.02.22 12:12 
                                                         

                                                        the author is helpful and you can trust in him and his style

                                                        Werner Majer
                                                        875
                                                        Werner Majer 2022.09.07 16:18 
                                                         

                                                        Very good indicator, in connection with the Stockastic, very good results

                                                        推荐产品
                                                        BE Channel OHLC
                                                        Valerij Alekseev
                                                        3 (1)
                                                        The creation of this indicator was inspired by the phrase of the famous trader Michael Covel "Price is the best indicator in the world". Not everyone is able to see the market through the eyes of a professional. Probably an indicator that does not distort the price and visualizes what is happening on the market can help you. Indicator "BE Channel OHLC" has been created for this purpose. The indicator name has not been chosen by chance. The indicator draws a channel using OHLC prices (OPEN, HIGH,
                                                        Projection Trend
                                                        Tatiana Savkevych
                                                        Projection Trend - a Forex arrow indicator without redrawing does not change its signals when the market situation changes, does not adjust to the chart. The signals given by him are unambiguous. Traders build a trading system that provides good signals 80-90% of the time. The indicator showing the points of entry and exit from the market with arrows is able to bring results not only in the Forex market, but also when working with binary options. You can buy it and install it in MetaTrader yo
                                                        Auto Order Block with break of structure based on ICT and Smart Money Concepts Futures Break of Structure ( BoS )             Order block ( OB )            Higher time frame Order block / Point of Interest ( POI )    shown on current chart           Fair value Gap ( FVG ) / Imbalance   ,  MTF      ( Multi Time Frame )    Volume Imbalance     ,  MTF          vIMB Gap’s Equal High / Low’s     ,  MTF             EQH / EQL Liquidity               Current Day High / Low           HOD /
                                                        PowerXXX
                                                        Marco Fornero Monia
                                                        PowerXXX measures the power of the current candlestick and displays it in numerical format and colors. The indicator can cover multiple timeframes and can be placed on the main chart or on the charts of the underlying indicators. The number of timeframes is selectable, as well as the color levels according to the power expressed. In the latest version, the power can be expressed as a function of the opening of the candle itself or as a function of the opening of the total candles before. There
                                                        Holy Renko PRO
                                                        Bianca Seara
                                                        3.5 (2)
                                                        About  Holy Renko is a trend identifier capable of identify small and long market movements. This indicator should be use in Renko Charts. VIDEO (information and tips) [HERE] How to install Renko Charts [HERE] Features Developed for Renko Charts Easy to analyze Fast signals Not repaint (when candle close)  Statistics panel Filters false signals Alerts, emails and push notifications  Advantages of Renko Chart Easy to install Easy to analyze Filter out the noise of wicks  Easy ident
                                                        Introduction to Smart Renko The main characteristics of Renko Charting concern price movement. To give you some idea on its working principle, Renko chart is constructed by placing a brick over or below when the price make the movement beyond a predefined range, called brick height. Therefore, naturally one can see clear price movement with less noise than other charting type. Renko charting can provide much clearer trend direction and it helps to identify important support and resistance level
                                                        Trend Analysis in act
                                                        Ihab Mohamed Kamal Fouda
                                                        The Trend Analysis Indicator is an innovative tool designed for traders and investors who seek to navigate the complexities of the financial markets with greater precision and insight. This powerful indicator is engineered to adeptly identify whether a market is trending or not, offering users a vital edge in their trading strategy. Key Features: Accurate Trend Detection : The core functionality of the Trend Analysis Indicator lies in its ability to accurately detect market trends. It analyzes p
                                                        Rira Renko
                                                        Vitor Palmeira Abbehusen
                                                        RENKO on Time Chart This indicator is an enhanced Renko, so you can watch the Renko bricks on the chart to understand price movement more clearly the other improvement is automated box size according to ATR (Average True Range) period you can set the ATR number as you want and the box size of Renko changes automatically based on price movement Inputs Mode: Box size is the input to specify the size of the Renko box you want to print on the chart. This input lets you choose the fixed b
                                                        Level 2 Trading
                                                        Thomas Bradley Butler
                                                        5 (8)
                                                        交易蜡烛里的东西。多少买家或多少卖家,看涨蜡烛,看跌蜡烛。确定谁在控制市场。 该指标是一种情绪指标,显示过去许多条柱的买卖双方交易量。第 2 级是通过买价和卖价进行交易的。许多情绪指标太快,很难确定交易方向。我更改了图形以反映日内交易。买价和卖价来自一段时间内交易的许多条柱的数量,使其更适合日间交易。 与更快的成交量情绪相比,进入的成交量已经放缓。最好在 5 分钟到 1 小时内进行交易。可以交易外汇和股票以及加密货币和指数。这可以与我的其他指标结合使用。做市的原则与保持市场平衡有关,然后一个元素接管,即买方或卖方,然后恢复平衡。 这个 2 级指标易于阅读和使用,只需按照交易量交易一些像样的头皮。加载回测器以试用并查看它是否适合您的策略 规则 负载指示器 等到买入或卖出克服 持仓直到市场平局
                                                        FREE
                                                        MT4 EA - FOREX Challenger Plus This unique automated trading system adopted 3 Layers of difference entry at two different price positions. The pre-defined lot size is actually divided into 3 trades and enters different price positions once the entry condition is fulfilled. If a drawdown occurs, the EA will open an additional position based on the pre-defined strategy, and when the total profit of all orders is greater than a certain value, all orders, including unprofitable ones, are closed. It
                                                        MT4 EA - FOREX Scorer Plus This unique automated trading system adopted 3 Layers of difference entry at two different price positions. The pre-defined lot size is actually divided into 3 trades and enters different price positions once the entry condition is fulfilled. If a drawdown occurs, the EA will open an additional position based on the pre-defined strategy, and when the total profit of all orders is greater than a certain value, all orders, including unprofitable ones, are closed. It is n
                                                        The expert works on the Fibonacci levels on the previous candle With some digital way to enter the deal On the five minute frame Work on currency pairs only Do not use TakeProfit or Stop Loss How the expert works It is placed on the three currency pairs GBPUSD GBPJPY GBP AUD Same settings without changing anything When he works, he will work on only one currency of them until it closes on a profit Profit is only seven points Please watch the video Explains how the expert works. Max Spread = 0.3
                                                        Mr Beast Trend Reverse
                                                        Luis Mariano Vazquez Marcos
                                                        MR BEAST TREND REVERSE RECOMENDED H1 EUR USD La estrategia "Trend Reverse" en el mercado de divisas (Forex) es un enfoque utilizado para identificar puntos de reversión de tendencias y capturar cambios de dirección en los precios de los pares de divisas. Esta estrategia se basa en la premisa de que las tendencias del mercado no duran para siempre y que se producirán puntos de inflexión. Este robot de trading de Forex ha sido desarrollado por MRBEAST como una herramienta para facilitar el trading
                                                        Holy Trend PRO
                                                        Bianca Seara
                                                        5 (1)
                                                        About Holy Trend was developed to identify trend and strength. VIDEO (information and tips) [HERE] Features Identifies trend Identifies strength of trend Identifies lines of support and resistance Easy to analyze Fast signals All timeframes Not repaint (when candle close) No settings required Can be used in Renko charts Can be used with indicator Holy Renko PRO Alerts, email and push notifications Advantages Sensitive identifier of trend able to identify the long, short movements and
                                                        This indicator Super Neuro Trend indicator.Indicator displays trend movement. Indicator helps to buy and sell. Features FiltPer- displays indicator period. deviation - displaus indicator deviation. Trend - displaus indicator trend.( true,false) Rectangle - displaus indicator rectangle. (true,false)  How to understand the status: If the trend color is green, trend is up. I f the trend color is red, trend is down. I f the trend waiting,trend waiting.     /////////////////////////////////////////
                                                        Global Trend
                                                        Vitalii Zakharuk
                                                        Global Trend Indicator, shows the signals for entry. Displays both entry points and the trend itself. Shows statistically calculated moments for entering the market with arrows. When using the indicator, the risk factor can be optimally distributed. Settings: Uses all one parameter for settings. Choosing a parameter, it is necessary to visually resemble it so that the appropriate graph has a projection of extremes. Parameters: Length - the number of bars for calculating the indicator.
                                                        该软件工具旨在简化以您选择的五种可自定义颜色创建水平趋势线和矩形的过程。 在 MT5 中绘制精确的水平趋势线可能具有挑战性,但使用此指标,您可以轻松地以适合您偏好的颜色创建它们。 此外,我们的工具还可以清晰显示与您绘制的水平线相关的价格水平。 我们重视您的反馈,并希望您发现该工具成为满足您交易需求的宝贵资产。 请随时与我们分享您的想法。 .......................................................................................... ..........................................................................................
                                                        Fibonacci Auto Levels
                                                        Mohamed yehia Osman
                                                        Possible Price reversals levels - based on  Fibonacci + Support +  Resistance Levels Auto levels drawn based on input index (Bars Count )  ---->>> Price Over 50% Fibo line ---> UP TREND ---> BUY when price drop near Support Lines  ---->>> Price Down 50% Fibo line ---> DOWN TREND ---> SELL when price goes up  near Resistance Lines  --->>> The more close price levels ----> the more possibility for price reversals --->>> are you a scalper --> try it on M1 charts with big index like 5000 bars  or
                                                        Long term stats is a trend indicator.  As the name suggests, it computes long term running average, standard deviation and min/max values Average and standard deviation are plotted on the graph and deviation value is taken as input parameter (similarly to bollinger bands). Historical minimum and maximum are plotted on the graph and updated for each bar, considering historical time series slope. (this is to somehow account for inflation/deflation) Can be used as filter for signals, as trigger to
                                                        FREE
                                                        Tree Of Life
                                                        Oeyvind Borgsoe
                                                        Tree Of Life EA is an fully automatic trading advisor which recognise patterns and trends in a highly accurate manner. It is designed to generate stable long-term gains while providing excellent risk management. After years of trading and testing, we have discovered spesific combinations of indicators and internal calculations that secure a solid foundation for a robust strategy. The main indicators Tree Of Life uses are the Moving Average and Stochastic. Together with internal calculation
                                                        Angry
                                                        Maryna Shulzhenko
                                                        Angry is a trend indicator, it indicates well the points of the beginning of the trend and its completion or reversal. This tool scans the market looking for the correct entry. Against the background of insignificant fluctuations, it is possible to identify a trend and indicate its direction. It uses only price data and analytics to calculate entry points. Does not use auxiliary indicators. Angry captures moments of stable price movement direction. There are only three types of trend: Bullish
                                                        RenkoMaPriceChannel
                                                        Sergey Deev
                                                        1 (1)
                                                        The indicator displays Renko bars on the chart, uses their data to calculate and display the moving average, PriceChannel and generates buy/sell signals. Renko is a non-trivial price display method. Instead of displaying each bar within a time interval, only the bars where the price moved a certain number of points are shown. Renko bars do not depend on a time interval, therefore the indicator works on any timeframe without losing its efficiency. The PriceChannel indicator displays the upper, lo
                                                        Random trade Random Buy Random Sell Random profit Random Take profit Random Stoploss Crayzy strategy [Important] 0.01 LOT with 10k balance ------------------------------------------------------------------ Contact Us now Do you want have a EA that trade with your strategy?  We will finish the EA in 1-3 working days  Prime Capital Viet Nam primecapitalvn@gmail.com
                                                        Introducing our innovative trading indicator, designed to transform the way you analyze price movements. The [Indicator Name] goes beyond traditional methods by dynamically drawing two distinct trends on the chart. The space between these trends acts as a unique reflection surface, providing valuable insights into potential market reversals and trend continuations. Key Features: Dual Trend Drawing: Automatically draws two trends on the chart, creating a visually distinctive analysis of price mov
                                                        FxBears Powers
                                                        Rachid Lafhil
                                                        3 (2)
                                                        FxBears Powers 致力于所有外汇对、金属、商品、期货、指数、能源、加密货币以及所有……以及从 M1 到 MN 的所有时间范围.........。 它基于供需和一些内部指标,它为您提供了一个非常强大的切入点,大部分时间为 0,您可以在测试中验证这一点..............。 它会立即在您的手机平台上向您发送信号,包括货币对名称、时间、时间范围、买入或卖出,   入场点、SL 和 TP....。 它在图表上为您提供卖出或买入箭头和 3 条线:TP、SL、入场点。 带有声音的即时通知。 输入没有复杂性,对于初学者和专业人士来说非常简单。 不重绘,不重绘。 使用此指标不再有损失,多年前对其进行测试,看看某一天的结果是否有损失......。
                                                        Min5 diamonds Indicator
                                                        Mohamed Kamel Touati
                                                        Diamonds Min5   - DM5-   DM5    is an indicator that suggests entering levels (sell or buy) ,it always follow the trends using parabolic sar ,  working on is so easy, you need just to attach it to the chart and all the magic will show , this indicator does n ot repeat itself or redraw signals . After months of testing, it provides a very good result       it works on all pairs with no excaption 
                                                        Median Renko Terminator
                                                        Lesedi Oliver Seilane
                                                        Median Renko Terminator works best with renko charts if you do not have a renko chart generator I will email it to you for free and give you the correct settings for scalping or to swing trade NON-REPAINT  COMES WITH ALERTS WHEN THERE IS A SIGNAL Conditions to sell: big purple arrow shows you the direction first then you take the small purple arrow to enter the same direction of the purple arrow. Conditions to buy: big white arrow shows you the up direction first then you take small white arrow
                                                        Before
                                                        Nadiya Mirosh
                                                        The Before indicator predicts the most likely short-term price movement based on complex mathematical calculations. Most of the standard indicators commonly used in trading strategies are based on fairly simple calculations. This does not mean that there were no outstanding mathematicians in the world at the time of their creation. It is just that computers did not yet exist in those days, or their power was not enough for the sequential implementation of complex mathematical operations. Nowa
                                                        SmartMass
                                                        Roberto Alvarez
                                                        5 (2)
                                                        SMARTMASS INDICATOR This indicator is different from all known volume indicators. It has a significant distinction; it is an algorithm that relates price movement to volume, attempting to find proportionality and efficient movement while filtering out noise and other movements that are more random and do not follow a trend or reversal. Ultimately, it reveals the true strength of the movement, indicating whether it has genuine support from bulls or bears or if it's merely a high-volume movement
                                                        CSS " currency strength slope "  is a a multi currency strength indicator that use Forex major currencies, EUR, USD, CAD, AUD, NZD, JPY, CHF, GBP. it use 28 major pairs to calculate the power of every currency using a based moving averages algorithm : you will see volatility clearly between currencies. input: MA Fast & Slow. - MA Mode : simple, exponential, smoothed, linear weighted - Applied Price : close, open, high, low, median price, typical price, weighted price.
                                                        该产品的买家也购买
                                                        Gann Made Easy
                                                        Oleg Rodin
                                                        4.96 (45)
                                                        Gann Made Easy 是一个专业且易于使用的外汇交易系统,它基于使用先生理论的最佳交易原则。 W.D.江恩。该指标提供准确的买入和卖出信号,包括止损和获利水平。您甚至可以使用推送通知在旅途中进行交易。 购买后请联系我!我将免费与您分享我的交易技巧和丰厚的红利指标! 您可能已经多次听说过江恩交易方法。通常 Gann 的理论不仅对于新手交易者而且对于那些已经有一定交易经验的人来说都是非常复杂的东西。这是因为江恩的交易方法在理论上并不那么容易应用。我花了几年时间来完善这些知识,并将最好的原则应用到我的外汇指标中。 该指标非常易于应用。您所需要的只是将其附加到您的图表并遵循简单的交易建议。该指标不断进行市场分析工作并寻找交易机会。当它检测到一个好的入口点时,它会为您提供一个箭头信号。该指标还显示止损和获利水平。 换句话说,当您像先生一样进行交易时,该指标会为您提供最佳江恩建议。江恩亲自告诉你此时此刻该做什么。但最好的部分是您不需要了解任何有关江恩交易原则的知识,因为该指标会为您完成整个市场分析工作。
                                                        Atomic Analyst
                                                        Issam Kassas
                                                        5 (1)
                                                        首先值得强调的是,该交易指标是非重绘、非延迟的指标,这使其成为手动和机器人交易的理想选择。 Atomic Analyst是一种PA价格行动指标,利用价格的力量和动量来寻找市场上更好的机会。配备了高级过滤器,可帮助去除噪音和假信号,并提高交易潜力。使用多层复杂的指标,Atomic Analyst扫描图表,并将复杂的数学计算转化为任何初学者都能理解并用来做出一致交易决策的简单信号和颜色。 “Atomic Analyst”是专为新手和经验丰富的交易者量身定制的综合交易解决方案。它将高级指标和一流功能融合为一体的交易策略,使其成为所有类型交易者的多功能选择。 日内交易和剥头皮策略:专为快速准确的日内交易和短期交易而设计。 日内和摆动交易策略:可用作追求价格大幅波动的日内和摆动交易者的可靠工具。 多货币和市场:凭借其可靠的精度,在不同的工具和市场上运作。 多个时间框架:可在多个时间框架上使用,性能良好。 稳定性:所有指标均不重绘、不重绘和不滞后,确保可靠的信号。 信号清晰度:提供箭头信号,用于清晰的入场和出场点。 实时警报:通过交易入场、SL和TP警报通知交易者。 多个利润水平:使用
                                                        Scalper Vault
                                                        Oleg Rodin
                                                        5 (27)
                                                        Scalper Vault 是一个专业的剥头皮系统,为您提供成功剥头皮所需的一切。该指标是一个完整的交易系统,可供外汇和二元期权交易者使用。推荐的时间范围是 M5。 该系统为您提供趋势方向的准确箭头信号。它还为您提供顶部和底部信号以及江恩市场水平。无论您拥有何种交易经验,该系统都易于使用。您只需要遵循简单的规则并每天重复该过程。 建议将此系统用于主要货币对。感谢您的关注! 请注意,该指标在策略测试器中可能无法正常工作。因此,我建议仅在模拟或真实账户的真实交易条件下使用该系统。 指示器提供所有类型的警报,包括推送通知。 购买指标后请与我联系。我将免费与您分享我的个人交易建议和出色的奖励指标! 祝您交易愉快,盈利!
                                                        TPSproTREND PrO
                                                        Roman Podpora
                                                        5 (15)
                                                        TPSpro TRENDPRO  - is a trend indicator that automatically analyzes the market and provides information about the trend and each of its changes, as well as giving signals for entering trades without redrawing! The indicator uses each candle, analyzing them separately. referring to different impulses - up or down impulse. Exact entry points into transactions for currencies, crypto, metals, stocks, indices!  -  Version MT5               DETAILED DESCRIPTION        /       TRADING SETUPS           
                                                        Quantum Trend Sniper Indicator MT4
                                                        Bogdan Ion Puscasu
                                                        4.59 (39)
                                                        介绍   量子趋势狙击指标 ,突破性的 MQL5 指标,正在改变您识别和交易趋势反转的方式!由拥有超过13年交易经验的资深交易员团队开发,     量子趋势狙击指标   旨在通过其创新的方式以极高的准确度识别趋势反转,将您的交易之旅推向新的高度。 ***购买量子趋势狙击指标,即可免费获得量子突破指标!*** 当量子突破指标识别出趋势反转时,它会向您发出警报和信号箭头,并建议您三个止盈水平。 它既适合新手交易者,也适合专业交易者。 量子 EA 通道:       点击这里 MT5版本:       点击这里 建议: 时间范围:  所有时间范围。为了获得最佳结果,我们建议在 M15、M30 和 H1 时间范围内使用它。 货币对:欧元兑美元、英镑兑美元、澳元兑美元、欧元兑英镑, EURAUD, XAUUSD 账户类型:ECN、Raw 或 Razor,点差极低 经纪时间:任意 经纪商:IC Markets、Pepperstone with Raw 和 Razor 的点差最低 建议止损:50 点 建议止盈水平:20 点、50 点和 1
                                                        首先,值得强调的是,这个交易工具是非重绘、非重画和非滞后的指标,非常适合专业交易。 智能价格行动概念指标是一个非常强大的工具,既适用于新手,也适用于经验丰富的交易者。它将超过20个有用的指标合并到一个指标中,结合了高级交易思想,如内圈交易员分析和智能资金概念交易策略。该指标侧重于智能资金概念,提供有关大型机构交易方式的见解,帮助预测它们的动向。 它在流动性分析方面尤其擅长,有助于理解机构的交易方式。它擅长预测市场趋势,并仔细分析价格波动。通过将您的交易与机构策略对齐,您可以更准确地预测市场走向。该指标多才多艺,擅长分析市场结构,识别重要的订单区块,并识别各种模式。 它擅长识别BOS和CHoCH等模式,理解动量的转变,并突出显示供需强劲的关键区域。它还擅长发现强大的不平衡,并分析价格创造更高高点或更低低点的模式。如果您使用斐波那契回撤工具,该指标可以满足您的需求。它还可以识别相等的高点和低点,分析不同的时间框架,并通过仪表板显示数据。 对于使用更高级策略的交易者,该指标提供了工具,如公平价值差指标和优惠和折扣区域的识别。它特别关注高时间框架订单区块,并在较长时间框架内彻
                                                        Advanced Currency Strength28 Indicator
                                                        Bernhard Schweigert
                                                        4.9 (662)
                                                        目前26%的折扣 任何新手或专家交易者的最佳解决方案! 这个指标是一个独特的、高质量的、可负担得起的交易工具,因为我们纳入了一些专有的功能和一个新的公式。只需一个图表,你就可以读出28个外汇对的货币强度!想象一下,你的交易将如何得到改善,因为你的交易是在你的手中进行的。想象一下,你的交易将如何改善,因为你能够准确地确定新趋势或剥头皮机会的触发点? 用户手册:点击这里  https://www.mql5.com/en/blogs/post/697384 这是第一本,原版的! 不要买一个毫无价值的崇拜者的克隆品。 特别的 子窗口中的箭头显示强劲的货币势头GAP将指导你的交易! 当基础货币或报价货币处于超卖/超买区域(外盘斐波那契水平)时,在个人图表的主窗口中出现警告信号。 当货币力量从外围区间回落时,回撤/反转警报。 十字星模式的特别警报 可选择多个时间框架,以快速查看趋势! 货币强度线在所有的时间框架中都非常平稳,当使用较高的时间框架来识别总体趋势,然后使用较短的时间框架来确定精确的入口时,效果非常好。你可以根据自己的意愿选择任何时间框架。每个时间框架都由其自身进
                                                        TPSpro RFI Levels
                                                        Roman Podpora
                                                        5 (13)
                                                        A key element in trading is zones or levels from which decisions to buy or sell a trading instrument are made. Despite attempts by major players to conceal their presence in the market, they inevitably leave traces. Our task was to learn how to identify these traces and interpret them correctly. Reversal First Impulse levels (RFI)   -  Version MT5                INSTRUCTIONS                 RUS                 ENG                                       R ecommended to use with an indicator   -  
                                                        Advanced Supply Demand
                                                        Bernhard Schweigert
                                                        4.92 (310)
                                                        现在优惠 33%! 任何新手或专业交易者的最佳解决方案! 该指标是一款独特、高质量、且价格合理的交易工具,因为我们已经整合了许多专有功能和新公式。 依据此更新,您将能够显示双重时间帧区域。 您不仅可以显示一个较高的时间帧,还可以同时显示图表时间帧,加上更高的时间帧:显示嵌套时区。 供需双方所有交易者都会喜欢它。 :) 重要信息披露 高级供需的最大潜力,请访问 https://www.mql5.com/zh/blogs/post/720245   想象您的交易如何得以改善,是因为您能够精准定位入场或目标位吗? 构建于新的底层算法,它可以更轻松地识别出买卖双方之间的潜在失衡。 这是因为它以图形方式展示供需最强劲区域,及其过去的表现(显示旧区域)。 这些功能旨在帮助您更轻松地发现最佳入场区域和价位。 现在您可以针对您的交易品种和时间帧来优化和编辑区域强度! 高级供需指标适用于所有产品和时间帧。 它是一个新的公式,非常新的功能是两个区域强度函数可由用户输入进行调整! 这在交易中是一大优势。 当您学习如何使用专有功能,例如带有价格游离最小 X 因子的区域强度时,您能够判断该区域强劲与否。 供
                                                        Entry Points Pro
                                                        Yury Orlov
                                                        4.7 (224)
                                                        这是一款 MT4 的趋势指标,可提供准确的入场交易信号,且无重绘或延迟。 它可应用在任何金融资产:外汇、加密货币、贵金属、股票、指数。 最好的结果出现在 M15+ 的时间帧内。 指标的 MT5 版本 重要! 购买后请联系我,以便获取详细指南和奖励。 视频 (6:22) - 一个信号赢取的利润等于指标价格的三倍。 视频 (4:44) - 它如何在测试器中工作,我的提示和技巧。 视频 (1:44) - 有关它如何处理加密货币和指数的几句话。 大多数交易者在 Entry Points Pro 指标的帮助下,在第一个交易周内就改善了他们的交易结果。 Entry Points Pro 指标的益处 入场信号无重绘或延迟 如果信号出现,并得到确认(如果信号所在烛条已收盘),则它不会再消失;不像是重绘指标,它会导致重大的财产损失,因为它们可以在显示信号后再将其删除。 无差错开仓 指标算法可令您找到入场交易(买入或卖出资产)的理想时机,从而提高每位交易者的成功率。 Entry Points Pro 可操作任何资产 它允许您在 MT4 平台上交易任何经纪商提供的加密货币、股票、
                                                        Scalper Inside PRO
                                                        Alexey Minkov
                                                        4.75 (55)
                                                        SALE NOW! Limited Time Offer! An exclusive indicator that utilizes an innovative algorithm to swiftly and accurately determine the market trend. The indicator automatically calculates opening, closing, and profit levels, providing detailed trading statistics. With these features, you can choose the most appropriate trading instrument for the current market conditions. Additionally, you can easily integrate your own arrow indicators into Scalper Inside Pro to quickly evaluate their statistics and
                                                        使用我们的自定义MT4指标发现成功外汇交易的秘诀! 您是否曾经想过如何在外汇市场上取得成功,一贯赚取利润,同时降低风险? 这是您一直在寻找的答案! 允许我们介绍我们的专有MT4指标,该指标将彻底改变您的交易方法。 独特的多功能性 我们的指标专为喜欢Renko和Rangebar Candle编队的用户而设计。 我们了解到,这些图表类型受到许多经验丰富的交易者的青睐,这就是为什么我们的指标与它们无缝集成,从而提供无与伦比的市场分析。 清晰的趋势信号 忘记复杂的分析! 我们的指标利用鲜艳的色彩和清晰的点结构来明确指示市场趋势。 红色和蓝色的点毫无疑问地对价格变动的方向留下了疑问,从而可以在您的交易中快速决策。 与HH/HL HL/LL策略对齐 如果您正在寻求一个指标,该指标无缝地与基于HH/HL和HL/LL结构的策略无缝合作,则不需要更多。 我们的工具不仅确定了这些形式,而且还促进了它们在投资过程中的有效利用。 绝对的清晰度和简单性 我们的首要任务是为您提供一种不仅有效而且易于使用的工具。 我们的指标是为了清晰而设计的,使您可以专注于做出投资决策,而不是
                                                        TrendMaestro
                                                        Stefano Frisetti
                                                        5 (2)
                                                        note: this indicator is for METATRADER4, if you want the version for METATRADER5 this is the link: TRENDMAESTRO recognizes a new TREND in the bud, he never makes mistakes. The certainty of identifying a new TREND is priceless. DESCRIPTION TRENDMAESTRO identifies a new TREND in the bud, this indicator examines the volatility, volumes and momentum to identify the moment in which there is an explosion of one or more of these data and therefore the moment in which prices have strong probability of f
                                                        目前八折优惠! 对任何新手或专家交易者来说都是最好的解决方案! 这个仪表板软件适用于28种货币对。它基于我们的两个主要指标(高级货币强度28和高级货币冲动)。它对整个外汇市场提供了一个伟大的概述。它显示高级货币强度值,货币运动速度和28个外汇对在所有(9)时间段的信号。想象一下,当你可以使用图表上的单一指标观察整个市场,以确定趋势和或剥头皮的机会时,你的交易将得到改善 我们已经在这个指标中建立了一些功能,使你更容易识别强势和弱势货币,同时识别和确认潜在的交易。该指标以图形方式显示货币的强势或弱势是增加还是减少,以及它在所有时间段的表现。 增加的新功能是动态市场斐波那契水平,它适应当前的市场条件变化,这是一个已经在我们的高级货币强度28和高级货币冲动指标中使用的成熟的加分项。 在交易时,总是将弱势货币和强势货币配对,这个新指标将帮助你做到这一点。 用户手册:点击这里  https://www.mql5.com/en/blogs/post/708783 特点  显示每个时间段的ACS28和GAP-speed(冲动)的货币强度值。 列:颜色代码以7种颜色
                                                        引入神奇外汇指标:释放精准交易的力量 你是否厌倦了寻找在所有时间框架上都能取得出色结果的完美外汇指标?别再继续寻找了!神奇外汇指标已经来到,改变您的交易体验,将您的利润推向新的高度。 神奇外汇指标基于尖端技术和多年的精心开发,堪称外汇市场上的强大和精确的巅峰之作。这个卓越的工具旨在满足各个层次的交易者需求,在追求持续盈利性方面提供无与伦比的优势。 神奇外汇指标的独特之处在于其无与伦比的适应性。无论您是日内交易者、波段交易者还是更喜欢长期持仓,该指标都经过优化,能在所有时间框架上取得出色的结果。然而,当在1小时时间框架上使用时,它的准确性和捕捉市场复杂走势的能力得到真正展示。 准备好对神奇外汇指标的准确性和可靠性感到惊讶。其先进的算法无缝结合了强大的指标、统计分析和趋势识别,实时为您提供全面的市场视图。指标的智能和动态信号使您能够自信地做出明智的交易决策,最大限度地提高获胜交易的机会。 不再犹豫和迷茫。神奇外汇指标消除了交易的猜测,使您在市场参与者中具有独特的优势。其用户友好的界面和直观的设计使得无论是经验丰富的专业人士还是初学者都能轻松掌握这一卓越工具的力量。 有了神奇外汇指标的支持,
                                                        FX Power MT4 NG
                                                        Daniel Stein
                                                        5 (8)
                                                        通过 mql5 和 Telegram 上 的晨间简报获取每日市场更新,包括详细信息和屏幕截图 ! FX Power MT4 NG 是我们长期以来非常受欢迎的货币强度计算器 FX Power 的下一代产品。 这款下一代强度计算器能提供什么?您所喜爱的原版 FX Power 的所有功能 附加功能 黄金/XAU 强度分析 更精确的计算结果 可单独配置的分析周期 可自定义计算限制,以获得更好的性能 为希望查看更多信息的用户提供特殊的多实例设置 无尽的图形设置,可在每个图表中设置您最喜欢的颜色 无数的通知选项,让您再也不会错过任何重要信息 采用 Windows 11 和 macOS 风格的全新圆角设计 神奇的移动指标面板 FX Power 主要功能 所有主要货币的完整强势历史 所有时间框架内的货币强弱历史 所有经纪商和图表的计算结果完全相同 100% 可靠的实时计算 -> 无重绘 可通过下拉列表选择分析时段 通过自定义模式单独配置分析时段 可在一个图表中使用多个实例 可移动 FX Power 显示屏(通过拖放) 适用于高分辨率 QHD、UHD 和 4K 显示器 自动终端配置 针对平板电脑
                                                        EasyTrade Indicator
                                                        Gabor Bocsak
                                                        5 (5)
                                                        多货币和多框架买卖提醒。 自动追踪止损和风险奖励止盈! 该指标扫描并分析市场,让您无所事事! 在一张图表上交易您的所有货币!   购买后请留言联系我,我会给您发送交易助理EA。 该指标使用多个振荡器和附加的过滤器来找到最佳的已确认进入点,因此您无需担心! 它会提醒您并为您选择观察的所有时间范围和货币绘制一个按钮。 只需按下按钮即可转到图表并打开交易! 该指标还为所有基础货币和市场观察货币绘制强度面板(可在设置中调整)。这将向您显示所有货币对和选择的更高时间范围。 在指标窗口中:带有趋势过滤器的特殊 MACD 直方图和图表货币的多时间框架趋势面板! 它提供所有货币和时间范围的交易警报,只需按下按钮即可转到图表! 展示: 绿色箭头:买入信号 红色箭头:卖出信号 出现买入或卖出信号后,只需按 EA 上的 EASYTRADE 按钮,它就会为您提供自动计算的手数、止损和止盈! 检查指示器窗口中的过滤器,对于多头交易,它必须为绿色,对于空头交易,它必须为橙色! 专家顾问的设置: https://www.mql5.com/en/blogs/post/
                                                        Quantum Breakout Indicator PRO
                                                        Bogdan Ion Puscasu
                                                        4.96 (26)
                                                        介绍     Quantum Breakout PRO   ,突破性的 MQL5 指标,正在改变您交易突破区域的方式!   Quantum Breakout PRO 由拥有超过 13 年交易经验的经验丰富的交易者团队开发,旨在通过其创新和动态的突破区域策略将您的交易之旅推向新的高度。 量子突破指标将为您提供带有 5 个利润目标区域的突破区域的信号箭头,以及基于突破框的止损建议。 它既适合新手交易者,也适合专业交易者。 量子 EA 通道:       点击这里 MT5版本:   点击这里 重要的!购买后请私信我领取安装手册。 建议: 时间范围:M15 货币对:GBPJPY、EURJPY、USDJPY、NZDUSD、XAUUSD 账户类型:ECN、Raw 或 Razor,点差极低 经纪商时间:GMT +3 经纪商:IC Markets、Pepperstone with Raw 和 Razor 的点差最低 规格: 不重漆! 最多 5 个建议利润目标区域 建议止损水平 可定制的盒子。您可以设置自己的 Box Time Start 和 Box Time E
                                                        PRO Renko System
                                                        Oleg Rodin
                                                        5 (24)
                                                        PRO Renko Arrow Based System for trading renko charts.  准确的信号交易任何外汇工具. 另外,我将免费提供系统的附加模块! PRO Renko系统是RENKO图表上高度准确的交易系统。该系统是通用的。 该交易系统可应用于各种交易工具。 该系统有效地中和了所谓的市场噪音,打开了获得准确反转信号的通道。 该指标易于使用,只有一个参数负责产生信号。 您可以很容易地使算法适应您感兴趣的交易工具和renko酒吧的大小。 我很乐意通过提供任何咨询支持来帮助所有客户有效地使用该指标。 祝您交易成功!购买后,立即写信给我! 我将与您分享我的建议和我的renko发电机。 另外,我将免费提供系统的附加模块!
                                                        TrendDecoder Premium
                                                        Christophe, Pa Trouillas
                                                        5 (3)
                                                        确定范围和下一步可能的走势   |  获得早期信号和趋势强度   |  在反转之前获得明确的退出   |  了解价格将测试哪些斐波水平 非重绘、非延迟指标 - 手动和自动交易的理想选择 - 适用于所有资产和所有时间单位 限时优惠 >>   50% OFF 购买后,  请联系我的频道  获取推荐设置 MT5   版本: 点击此处 使用   BladeSCALPER   和   PowerZONES   获取我们的完整方法 它是什么? TrendDECODER 集多种创新于一身,使趋势监测变得简单易行。 投射趋势线(Projective TrendLine)--快速参考即将到来的趋势 实时趋势线(RealTime TrendLine)与投射趋势线(Projective TrendLine)的对比 - 与之前的同方向走势相比,市场是加速还是放缓? 实时趋势线交叉 - 趋势正在偏离轨道 使用 GreyBox - 市场不再是趋势并进入新的过渡序列 使用 DecoderSignals 和 Blue/Orange Clouds - 利用作为动态支撑/阻力的 Blue/Orange
                                                        Currency Strength Wizard
                                                        Oleg Rodin
                                                        4.91 (44)
                                                        货币强度向导是一个非常强大的指标,为您提供成功交易的一体化解决方案。该指标使用多个时间范围内所有货币的数据来计算这个或那个外汇对的力量。此数据以易于使用的货币指数和货币电力线的形式表示,您可以使用它们来查看这种或那种货币的力量。 您所需要的只是将指标附加到您要交易的图表上,该指标将向您显示您交易的货币的真实强度。该指标还向您显示买卖量压力的极值,您可以在顺势交易时利用这些压力。该指标还显示了基于斐波那契的可能目标。该指标可用于各种交易时间范围。该指标支持各种货币对的交易。 该指标为您提供所有类型的警报,包括推送通知。 购买后请联系我。我将与您分享我的交易技巧,并免费为您提供丰厚的红利指标! 祝您交易愉快,获利丰厚!
                                                        Trend Forecasting
                                                        Mohamed Hassan
                                                        5 (15)
                                                        This indicator is unstoppable when combined with our other indicator called Katana. After purchase, send us a message and you could get Katana for FREE as a BONUS After purchase, send us a private message for your instructions.  MT5 version: click here 50 copies available at $55. There are 7 copies left before next price of $105. Don't miss this great deal!  The Trend Forecasting indicator is a very unique & easy tool that is able to make prediction about future price movement bas
                                                        Advanced Currency IMPULSE with ALERT
                                                        Bernhard Schweigert
                                                        4.91 (493)
                                                        目前31%的折扣!! 对任何新手或专家交易者来说都是最好的解决方案! 这个指标是一个独特的、高质量的、负担得起的交易工具,因为我们已经纳入了一些专有的功能和一个秘密的公式。只需一张图表,它就能给出所有28种货币对的警报。想象一下,你的交易将如何改善,因为你能够准确地确定新趋势或剥头皮机会的触发点 建立在新的基础算法上,它使识别和确认潜在交易变得更加容易。这是因为它以图形方式显示了一种货币的强势或弱势是否正在加速,并测量了这种加速的速度--把它想象成你汽车中的速度表。当你加速时,事情显然会发生得更快,这在外汇市场上也是一样的,即如果你配对的货币正在向相反的方向加速,你就会发现一个潜在的有利可图的交易。 货币动量的垂直线和箭头将指导你的交易! 动态的市场斐波那契23水平被用作警报触发器,将适应市场活动。如果冲动触及黄色触发线,您将在MetaTrader或您的电子邮件或推送警报中收到警报。然后你就知道作为一个交易员应该做什么。货币对和方向已经给出。只要点击警报按钮,就可以切换到该货币对或打开一个新的图表,以便进一步分析。警报级别可以通过用户输入来改变,可以选择3个敏感度级别
                                                        FX Volume
                                                        Daniel Stein
                                                        4.6 (35)
                                                        通过 mql5 和 Telegram 上 的 " 晨间简报 "获取每日市场更新,包括详细信息和屏幕截图 ! 外汇交易量(FX Volume)是第一个也是唯一一个从经纪商角度真正洞察市场情绪的交易量指标。 直接在您的图表上看到这些信息是真正改变游戏规则和突破性的交易解决方案。 受益于独特的市场数据洞察,如 比率(Ratios )显示货币多头和空头头寸的比率(百分比 比率变化 显示所选时间段内的多头比率及其百分比变化 总交易量 显示货币的总交易量(多头和空头),以手为单位 多头 交易量显示货币所有多头头寸的交易量 空头 交易量显示所有货币空头头寸的交易量 净多头 显示净多头交易量,即所有多头头寸减去所有空头头寸(以手为单位)。 净多头百分比 显示货币净多头交易量的变化 请阅读我们的基本教程 -> "如何使用外汇交易量进行交易 " 获取更多信息,如常见问题、交易技巧和教程视频,请访问我们的 外汇交易量公共信息频道 请 安装并运行 SI Connect 以建立与我们数据中心的持续连接 背景信息 我们都知道,外汇是一个分散的市场。这就是为什么我们必须打破常规思维,开发一个独
                                                        Shepherd Harmonic Pattern
                                                        Abdullah Alrai
                                                        4.68 (59)
                                                        这个指标将检测手动和自动方法在图表上绘制的谐波模式。 您可以从此链接查看用户手册: 添加您的评论并联系我们以获得它 有一个免费版本可以在mt4上尝试此产品。 您可以使用它来检测Gartley和Nenstar模式: https://www.mql5.com/en/market/product/30181 您可以从以下链接购买完整的MT4版本: https://www.mql5.com/en/market/product/15212 注意 指标具有控制面板,并将保存每个(图表和时间框架)设置。 您可以将其最小化以在图表上获得更多空间,并且如果您更喜欢使用其他分析工具,则可以按关闭按钮隐藏所有指标数据 当您使用此指标并更改设置,添加诸如移动平均线或布林带之类的指标时,此指标将自动保存您的模板编辑,并且您可以随时加载它们。 如果您使用的是Windows 10,请右键单击MetaTrader图标>兼容性>更改高DPI设置>系统(增强)以获得最佳屏幕设置(应在高清设备中完成)。 指标只是谐波交易理论的解释,用于检测图表上的谐波模式。 如果您想学习它,可以搜索Scott Carney的书,名为“Ha
                                                        TakePropips Donchian Trend Pro
                                                        Eric John Pajarillaga Aldana
                                                        4.82 (17)
                                                        TakePropips Donchian Trend Pro   (MT4) 是一款功能强大且有效的工具,可使用 Donchian 通道自动检测趋势方向,并为您提供进场和退场交易信号! 这个多功能指标包括趋势扫描器、交易信号、统计面板、筛选器、交易时段和警报历史仪表板。它旨在为您提供交易信号并节省您分析图表的时间! 您可以在我们的博文中下载用户手册和安装指南:   https   :// www.mql5.com/en/blogs/post/751368 今天立减 50%!价格从 98 美元降到 49 美元! 您可以在 Strategy Tester 上测试该指标(启用可视模式)。如果您喜欢在实时图表上进行测试,也可以给我发消息以获取 7 天试用版。 视频教程也可在说明下方获得更多详细信息。 如果您有任何问题或需要任何帮助,请与我联系。 TakePropips Donchian Trend Pro 指标适用于所有外汇对、金属、商品、指数和加密货币。 主要特点 交易信号 - 检测多个时间范围内所有货币对的买卖机会。它将为您提供警报并在图表上绘制交易信号,最多 3 个止盈价和一个止
                                                        How to use Pair Trading Station Pair Trading Station is recommended for H1 time frame and you can use it for any currency pairs. To generate buy and sell signal, follow few steps below to apply Pair Trading Station to your MetaTrader terminal. When you load Pair Trading Station on your chart, Pair Trading station will assess available historical data in your MetaTrader platforms for each currency pair. On your chart, the amount of historical data available will be displayed for each currency pai
                                                        RelicusRoad Pro
                                                        Relicus LLC
                                                        4.78 (139)
                                                        现在$ 147(更新后增加到$ 499) - 无限帐户(PC或Mac) RelicusRoad 用户手册 + 培训视频 + 访问 Private Discord Group + VIP 身份 一种看待市场的新方式 RelicusRoad 是世界上最强大的外汇、期货、加密货币、股票和指数交易指标,为交易者提供保持盈利所需的所有信息和工具。我们提供技术分析和交易计划,帮助每一位交易者取得成功,从初学者到高级。它是一个关键的交易指标,可以提供足够的信息来预测未来的市场。我们相信一个完整的解决方案,而不是图表上几个没有意义的不同指标。这是一个多合一指标,显示无与伦比且非常准确的信号、箭头 + 价格行为信息。 RelicusRoad 基于强大的人工智能,提供缺失的信息和工具来教育您并使您成为交易专家,成为成功的交易者。 几乎所有技术指标都滞后,这意味着它们只能报告已经发生的事情。因此,他们只确认您过去可以看到的价格已经在哪里。我们相信领先指标可以预测未来价格,而无需重新绘制,也不要过度依赖可能改变并导致重新绘制的滞后指标。如果您根据滞后指标进行交易并建立头寸,您就知道您已
                                                        PTS Precision Index Oscillator V2
                                                        PrecisionTradingSystems
                                                        5 (1)
                                                        精密指数振荡器(Pi-Osc)由Precision Trading Systems的Roger Medcalf开发 版本2经过精心重新编码,以在您的图表上加载速度非常快,还加入了一些其他技术改进,以提高体验。 Pi-Osc旨在提供准确的交易定时信号,旨在找到极端的耗尽点,这些点是市场被迫去触及,以清理每个人的止损单。 该产品解决了一个古老的问题,即知道极端点在哪里,这使得交易员的生活变得更加简单。 这是一个高度复杂的共识指标,与行业标准的振荡器相比,具有一些强大的区别。 它使用的一些特征包括需求指数、资金流动、RSI、随机指标、模式识别、成交量分析、标准偏差极端点以及不同长度上述各种变化的分歧。 乍一看,对于未经培训的人来说,它似乎与任何其他振荡器没有什么不同,但当与其他振荡器(如RSI或动量等)相对比时,这个指标的真正威力开始显现。 据我所知,没有其他振荡器可以频繁地精确指出顶部和底部,具有相同的定期效率。 精密指数振荡器由许多不同的数学方程组成,用于测量多个时间框架采样中的价格和成交量变动,从而高度准确地预测趋势可能发生转折的位置。 PTS P
                                                        M1 Arrow
                                                        Oleg Rodin
                                                        5 (13)
                                                        M1 Arrow - 基于市场的两个基本原则的盘中策略。 该算法基于使用附加过滤器对交易量和价格波动的分析。该指标的智能算法仅在两个市场因素合二为一时才会发出信号。该指标使用较高时间框架的数据计算 M1 图表上某个范围的波浪。为了确认波浪,该指标使用了成交量分析。 从理论上讲,该指标可以与其他时间框架一起使用,但您需要考虑到该指标最初是为在 M1 上交易而开发的这一事实。 该指标是一个现成的交易系统。交易者所需要的只是跟随信号。此外,该指标可以成为您自己的交易系统的基础。交易仅在分钟图表上进行。 尽管指标使用 MTF 原理,但指标算法尽可能稳定。 购买后,一定要写信给我!我将与您分享我的交易设置和建议!祝您交易成功!感谢您的关注!
                                                        作者的更多信息
                                                        True Direction Oscillator
                                                        Muhammad Elbermawi
                                                        4.89 (493)
                                                        或 (TDO),它是一种使用“ 纯动量 ”原理衡量价格变化率的指数。 当证券价格从 10 上涨到 15 时,价格变化率为 150%,但当它从 15 回落到 10 时,价格变化率仅为 33.3%。这就是为什么像“价格变化率”(ROC) 或“动量”这样的技术分析指标给出的上升价格走势读数高于下降价格走势读数的原因。 TDO 解决了这个问题,以帮助交易者正确读取动量。 重要信息 TDO 用户手册: https://www.mql5.com/en/blogs/post/717970 TDO 常见问题: https://www.mql5.com/en/blogs/post/722015 TDO 视频库: https://www.mql5.com/en/blogs/post/722018 TDO Expert Advisor 示例: https://www.mql5.com/en/blogs/post/731141 TDO 特性 TDO 以百分比计算纯动量,因此它用于比较来自不同市场的不同证券。 (例如:将 EURUSD 与 Gold & Dow Jones Industrial
                                                        Moving Average Cloud
                                                        Muhammad Elbermawi
                                                        4.93 (14)
                                                        或“MAC”。 这是一个旨在帮助您捕捉和交易趋势的指标。这个指标背后的想法可以在接下来的步骤中解释: 画一个快速移动的平均信封。 画一个缓慢移动的平均信封。 MAC Upper Band 是两个包络的高值之间的最高值。 MAC 下频带是两个包络的低值之间的最低值。 MAC 直方图云填充两个波段之间的距离,以显示方向的变化。 蓝云表示上升趋势,而红云表示下降趋势。 阅读下一篇博客,了解如何使用 MAC 缓冲区构建您自己的 EA 或扫描仪: https://www.mql5.com/en/blogs/post/734293 如何使用 MAC 使用 MAC 云作为过滤器来帮助您识别趋势方向。 使用您常用的交易工具在 MAC Clouds 的方向上进行交易,只是为了尽可能地消除错误信号。 使用建议的进入箭头可帮助您找到强大的趋势点作为起点。 MAC 功能 MAC 不会重新绘制或重新计算其结果。 它适用于加密货币、股票、指数、石油、黄金和所有时间范围。 声音、电子邮件警报和移动通知。 买入、卖出箭头有助于识别趋势信号。 精心设计的参数可帮助用户轻松地在它们之间导航。 建
                                                        Bermaui Bands
                                                        Muhammad Elbermawi
                                                        4.94 (89)
                                                        Bermaui Bands (BB) 是一种技术分析工具,有助于在价格波动和趋势价格变动之间进行过滤。这个指标背后的想法可以在接下来的步骤中解释: 将标准偏差计算为一个在 0 到 100 之间移动的振荡器。我将其命名为 Bermaui Deviation 百分比 (BD %)。 如果“BD %”接近于零,则波动率处于极端状态。此外,如果“BD %”接近 100,则波动性非常低。 高波动性意味着趋势市场的可能性很大,而低波动性意味着横向或区间市场。 中线是简单移动平均线 (SMA),因为标准偏差是根据 SMA 计算的。 将“BD %”添加到计算中具有相同条数的简单移动平均线,以获得上伯毛伊乐队。 从计算中具有相同条数的简单移动平均线中减去“BD %”以获得下伯毛伊乐队。 重要信息 Bermaui Bands 用户手册: https://www.mql5.com/en/blogs/post/718688 Bermaui Bands Expert Advisor 示例 : https://www.mql5.com/en/blogs/post/731143 如何使用它 使用 Bermau
                                                        MASR Bands
                                                        Muhammad Elbermawi
                                                        5 (10)
                                                        或 M oving 一个 verage 小号 upport [R esistance 带 。 MASR Bands 指标是一条移动平均线,由两条带共同作为支撑位和阻力位。据统计,MASR 波段 93% 的时间都包含价格蜡烛。以下是分步计算的方法: 1. 第一步是计算 X 时间段内的最高价 (HHV) 和最低价 (LLV)。 2. 第二步是用HHV除以LLV,得到它们之间的距离有多宽的百分比。我称这一步的结果为 MASR Filter。 3. MASR 过滤器 = 总和 ((HHV / LLV)-1) / 柱数 4. 我将上带称为 MAR,这是移动平均阻力的捷径。我将下频带 MAS 称为移动平均线支持的捷径。波段之间的移动平均线称为中心线。 5. MAR = MASR 中心 + (75% x MASR 过滤器 x MASR 中心) 6. MASR 中心是移动平均线。 7. MAS = MASR 中心 - (75% x MASR 过滤器 x MASR 中心) 重要链接 MASR 工具手册: https://www.mql5.com/en/bl
                                                        Bermaui Manual EA
                                                        Muhammad Elbermawi
                                                        5 (10)
                                                        这是一个交易网格系统的半自动专家顾问。这个想法是逐渐在市场中占据不同的位置,然后计算它们的盈亏平衡水平。当价格超过此盈亏平衡点达到预定距离时,所有打开的订单都会关闭。 重要信息 这是用户指南:   https://www.mql5.com/en/blogs/post/730567 您可以在此处使用我的任何其他产品尝试此 EA: https://www.mql5.com/en/users/bermaui314/seller 重要功能 EA 具有止损机制,以保护交易资金免受意外结果的影响。 您可以交易任何 MT4 符号,例如 EURUSD - XAUUSD - 石油 - 比特币。 您可以交易任何 MT4 时间范围。 我建议从 VPS 运行 EA。 参数和默认设置 1) 资金管理设置 开始批量。 建议使用默认设置为每 500 美元 0.01,杠杆为 1:400 或更多。 批次指数。 下一个订单的乘法大小。例如,如果起始手数为 0.01,手数指数为 2,则网格的手数大小将如下所示:0.01 – 0.02 – 0.04 – 0.08...等。 以点数获利。 盈
                                                        Bermaui Deviation Percent
                                                        Muhammad Elbermawi
                                                        4.94 (129)
                                                        或者 ( BD% ) 这是一个波动率指数,以百分比而不是点来衡量波动率。 BD% 的想法是根据在 0% 和 100% 之间移动的经典标准偏差 (CSD) 创建一个索引。 您可以使用 BD% 来比较同一证券在不同时间段或不同时间范围内的波动率。此外,您可以使用 BD% 以百分比而非点数来比较不同市场中不同证券之间的波动率。 如何使用“BD%” 如果 BD% 低于 90%,然后向上越过该水平,则表明价格可能在区间内波动。 如果 BD% 高于 90%,然后向下穿过该水平,并且价格已经高于其简单移动平均线,则这是新的上升趋势开始的迹象。随着 BD% 进一步下行,波动性和趋势强度正在增加。当 BD% 为 0% 时,这意味着波动率处于最高值。 如果 BD% 高于 90%,然后向下穿过该水平,并且价格已经低于其简单移动平均线,则这是新的下降趋势开始的迹象。随着 BD% 进一步下行,波动性和趋势强度正在增加。当 BD% 为 0% 时,这意味着波动率处于最高值。 要了解有关 BD% 的更多信息,请从此处阅读用户手册: https://www.mql5.com/en/blogs/
                                                        Classic Keltner Channel
                                                        Muhammad Elbermawi
                                                        4.9 (40)
                                                        或者 CKC。 该指标根据 Chester W. Keltner (1909–1998) 描述的经典 10 天移动平均线规则起作用。所有参数默认设置为Keltner系统的经典版本,用户可以根据需要进行更改。 重要信息 阅读 CKC 手册: https://www.mql5.com/en/blogs/post/736577 CKC Expert Advisor 示例: https://www.mql5.com/en/blogs/post/734150 关于 Keltner 通道公式 1. 根据典型价格 (= (最高价 + 最低价 + 收盘价) / 3) 将中心线计算为简单移动平均线。 2. 计算平均日波动幅度(ADR),即最高价和最低价之间的平均差,以相同的时期和计算方法为中线。 3. Keltner Buy Line = 中心线 + ADR。 4. Keltner 卖出线 = 中线 – ADR。 凯尔特纳 10 天移动平均线法则 Keltner 公式导致在图表上创建两条基本线。 1. 凯尔特纳购买线。 这是您覆盖卖出头寸并买入的线。 2. Keltn
                                                        Bermaui Pin Bars
                                                        Muhammad Elbermawi
                                                        5 (22)
                                                        Bermaui 销钉 或者 (BPB) 是一个指标,可以在图表上找到 Pin Bars 价格行为模式。 Pin Bars 是“Pinocchio Bars”的快捷方式,它是日本烛台的经典条形图案替代品. Bermaui Pin Bars 指标根据可以在后续步骤中解释的公式找到此模式: 首先 BPB 计算蜡烛主体的中心 (= [开盘 + 收盘] / 2)。 然后 BPB 找到实体中心和蜡烛低点之间的距离。 最后一步是将第 2 步的结果除以蜡烛图范围。 如果蜡烛主体中心太靠近蜡烛的高点或低点,则 BPB 会检测到 Pin Bar 模式并提醒用户。 Bermaui Pin Bars 公式 : https://www.mql5.com/en/blogs/post/729139 我通过添加以下内容增强了 Bermaui Pin Bars 功能: 多时间框架蜡烛方向面板 告诉您所有时间框架的当前蜡烛情况。其中绿点表示关闭>打开,红色表示关闭<打开,黄色表示关闭=打开。 Bermaui Bands 可帮助您确定当前趋势是看涨、看跌还是中性。 你可以从这里 阅读更多关于它的信息。 Berma
                                                        BACD Cloud
                                                        Muhammad Elbermawi
                                                        4.57 (7)
                                                        或 B ermaui 甲 verageÇonvergence d ivergence 云 ,它是一个振荡器,它示出了趋势方向和措施的百分比强度。 BACD Cloud计算如下: 1- 计算两个指数移动平均线。其中一个比另一个快。我会打电话给第一个(快)和第二个(慢) 2- 找到它们之间的中心,其中:中心 MA = (Fast + Slow) / 2 3- 计算 BACD 线如下:BACD = 100 *(快速/中心 MA) 4- 计算 BACD 信号线,它是 BACD 的指数移动平均线。公式是这样的:BACD信号=EMA(BACD) 5- 从图表中隐藏 BACD 信号线。 6- 计算 BACD 直方图线,即 BACD 线与其信号线之间的差值。 (注意:BACD 直方图在图表上绘制为一条线,而不是直方图。) 7- 如果(BACD 线 > BACD 直方图线),则绘制绿色云,以表示趋势。 8- 如果(BACD 线 < BACD 直方图线)然后画一个红云,代表趋势。 重要链接: BACD 云用户手册: https://www.mql5.com
                                                        Dual Bermaui Deviation Percent
                                                        Muhammad Elbermawi
                                                        5 (13)
                                                        或 DBD%。该指标由彩色带组成,根据两个 Bermaui Deviation Oscillator (BD%) 和两个移动平均线显示交易信号。 Bermaui Deviation Percent 是一种波动率指数,以百分比而非点数来衡量波动率。 BD% 的想法是根据在 0% 和 100% 之间移动的经典标准偏差 (CSD) 创建一个索引。 重要信息 DBD% 专家顾问示例:   https://www.mql5.com/en/blogs/post/731145 如果您想了解更多关于 BD% 的信息, 请阅读下一篇博文: https://www.mql5.com/en/blogs/post/718182 DBD% 由两个信号带组成,一个是快的,另一个是慢的。当快速和慢速看涨时,就会出现买入信号。当快速和慢速都看跌时,就会出现卖出信号。 DBD% 特点 两个不同时期的两个 BD% 的组合有助于捕捉不同的市场周期。 使用 BD% 作为趋势过滤器是一个很大的优势,因为 BD% 可以作为市场低波动性运动的过滤器。 在满足买入/卖出条件后的第一次开盘时出现信号。 精心设计的参数
                                                        Bermaui RSI Candles
                                                        Muhammad Elbermawi
                                                        5 (7)
                                                        该指标的想法是以蜡烛的形式绘制 RSI,可以与价格图表进行比较以生成买入和卖出信号。该指标不是我的发明。几年前我在互联网上创立了它。我更新了代码,添加了警报功能,添加了 Bermaui Utilities 工具组。 该指标计算用于绘制烛台的所有价格的 RSI(开盘价、最高价、最低价和收盘价的 RSI)。它使用它们中最高的来绘制高灯芯的 RSI 蜡烛,使用它们中最低的来绘制低灯芯的 RSI 蜡烛。 RSI 蜡烛的主体位于高点和低点之间。如果开盘的 RSI 低于收盘的 RSI,则认为 RSI 蜡烛看涨。如果开盘的 RSI 高于收盘的 RSI,则 RSI 蜡烛被视为看跌。 如何使用它 您可以在 RSI 蜡烛指标上交易趋势线突破,这将引领价格图表上的趋势,因为动量引领价格。 您可以在 RSI 蜡烛指标上绘制任何形式的经典图表模式,并像使用原始 RSI 一样进行交易。 它可以用作经典的 RSI。如果它穿过超买 (70%),则卖出,如果它穿过超卖 (30%),则买入。 您可以使用 RSI 蜡烛图和价格图表之间的背离来确认您的交易信号。 RSI 蜡烛特点 它不会重新绘制或重新计算其结果。 它
                                                        Horus EA
                                                        Muhammad Elbermawi
                                                        3.67 (3)
                                                        MT4 的 Horus EA 数千年前,古埃及人发明了一种计数系统,用于测量土地和称重商品。这个系统被称为“ 荷鲁斯之眼 ”。 荷鲁斯之眼与奥西里斯神的神话有关,成为法老们的神圣象征之一。 我使用荷鲁斯之眼中的数学方程和斐波那契数列构建了一个比著名的“马丁格尔系统”安全 89% 的负增长资金管理系统。 EA 的技术部分取决于 移动平均云 (MAC) 和 随机震荡指标 。 MAC随机技术分析系统如何工作? 1- 如果移动平均云 (MAC) 看涨,则当随机振荡器从下方穿过其超卖水平时,EA 会接受其买单。 2- 如果移动平均云 (MAC) 看跌,则当随机震荡指标从上方穿过其超买水平时,EA 将接受其卖单。 EA 重要功能 1- 每套交易一次。 2- 明确的止损和止盈。 3-自动幻数。 4- 处理任何 MT4 对或时间范围(欧元兑美元 – 黄金 – 石油 – 比特币等)。 5- 简单的设置系统,具有强大的功能。 要了解有关 MAC 随机系统的更多信息,请阅读此评论>>> 这里 所有 Bermaui 产品和信号 >>> 这里 建议 每 0.01 手
                                                        筛选:
                                                        awasthisp
                                                        724
                                                        awasthisp 2023.08.26 09:30 
                                                         

                                                        It is one of best indicator to capture OB and OS areas

                                                        mostafa gamal
                                                        43
                                                        mostafa gamal 2023.02.22 12:12 
                                                         

                                                        the author is helpful and you can trust in him and his style

                                                        Werner Majer
                                                        875
                                                        Werner Majer 2022.09.07 16:18 
                                                         

                                                        Very good indicator, in connection with the Stockastic, very good results

                                                        mrkaib
                                                        1062
                                                        mrkaib 2022.09.05 19:53 
                                                         

                                                        in the backtest it looks very well. now i go to test it in live.

                                                        AlbertZAR
                                                        665
                                                        AlbertZAR 2022.04.08 17:36 
                                                         

                                                        What a brilliant indicator, helps me stay on the right side of the market. Great work Muhammad!

                                                        iamgibson
                                                        338
                                                        iamgibson 2022.02.22 14:00 
                                                         

                                                        Bermaui Channel is a critical tool, coupled with the Bermaui Stoch, it takes out the stress of trading.

                                                        hungnq1992
                                                        1175
                                                        hungnq1992 2022.02.16 16:57 
                                                         

                                                        i rented the TDO indicator and found it very effective. I just hired more combined Bermaui Band indicator.

                                                        Robbert
                                                        935
                                                        Robbert 2022.02.06 16:11 
                                                         

                                                        This is my 4th indicator from this Author and same as the others, top quality and support !

                                                        aztron
                                                        216
                                                        aztron 2022.01.27 06:02 
                                                         

                                                        excellent indicator. very accurate

                                                        Frank Paetsch
                                                        6907
                                                        Frank Paetsch 2022.01.22 23:30 
                                                         

                                                        5 stars

                                                        soharsteel
                                                        360
                                                        soharsteel 2021.11.03 20:14 
                                                         

                                                        excellent indicatoer . liked it a lot

                                                        Robin Olov Henry Lundberg
                                                        745
                                                        Robin Olov Henry Lundberg 2021.10.28 12:54 
                                                         

                                                        Good indicator that gives an idea of where we are in the flow or trend, can be used as a counter trend indicator or a trend indicator depending on how you read the market. Muhammad is also very supportive and quick in replying in case you need any support or help with settings. 5/5! I own a few of Muhammads indicators and EAs and he is one of the few good ones here on mql5.

                                                        Uladzimir Veramei
                                                        675
                                                        Uladzimir Veramei 2021.10.20 23:30 
                                                         

                                                        Helpful indicator, integrated it with my main strategy. Also could be automated. Support from the author is quick, satisfied.

                                                        Blin81
                                                        136
                                                        Blin81 2021.10.07 09:55 
                                                         

                                                        Have already bought 2 indicators. All good, and happy that there are alot of support given.

                                                        Joshua Crisologo Joaquin
                                                        268
                                                        Joshua Crisologo Joaquin 2021.09.27 10:58 
                                                         

                                                        I rented it for now as I just wanted to get the author's Bermaui Stochastic. However, seeing how it visually helps you in your trading (especially if you're strategy revolves around heavily overbought/oversold areas) - this is a must buy. I'll definitely purchase it after the rent period.

                                                        Muhammad Elbermawi
                                                        52244
                                                        来自开发人员的回复 Muhammad Elbermawi 2021.09.27 14:55
                                                        Thanks a lot, Joshua 🙏💚
                                                        Alex421
                                                        59
                                                        Alex421 2021.09.21 23:18 
                                                         

                                                        Works well with proper risk management

                                                        spetrosyan1979
                                                        530
                                                        spetrosyan1979 2021.08.29 13:22 
                                                         

                                                        Very good 🔥

                                                        Muhammad Elbermawi
                                                        52244
                                                        来自开发人员的回复 Muhammad Elbermawi 2021.08.30 05:18
                                                        Thanks for the great review, my friend. I appreciate it 🙏 💚
                                                        You can join my telegram group from here:
                                                        https://t.me/BermauiChannel
                                                        kurniartanto
                                                        65
                                                        kurniartanto 2021.08.07 16:50 
                                                         

                                                        Decided to try this indicator as in my opinion it is easy to understand and follow. Moreover, the author also provides the rationale of the trade when he used this tool for trading.

                                                        Muhammad Elbermawi
                                                        52244
                                                        来自开发人员的回复 Muhammad Elbermawi 2021.08.07 16:55
                                                        Thanks for the great review, my friend. I appreciate it 🙏 💚
                                                        You can join my telegram group from here:
                                                        https://t.me/BermauiChannel
                                                        Aoss Thanasit
                                                        52
                                                        Aoss Thanasit 2021.07.23 14:28 
                                                         

                                                        Bermaui Channel is an indicator that makes trading It's easier to do. I like it a lot.

                                                        Muhammad Elbermawi
                                                        52244
                                                        来自开发人员的回复 Muhammad Elbermawi 2021.08.06 21:45
                                                        Thanks for the great review and stars 🙏💚
                                                        You can join my telegram group from here:
                                                        https://t.me/BermauiChannel
                                                        Hisham Ghoneim
                                                        301
                                                        Hisham Ghoneim 2021.07.21 14:00 
                                                         

                                                        I just rent the indicator, it looks great tool soon i will buy the indicator forever.

                                                        12
                                                        回复评论