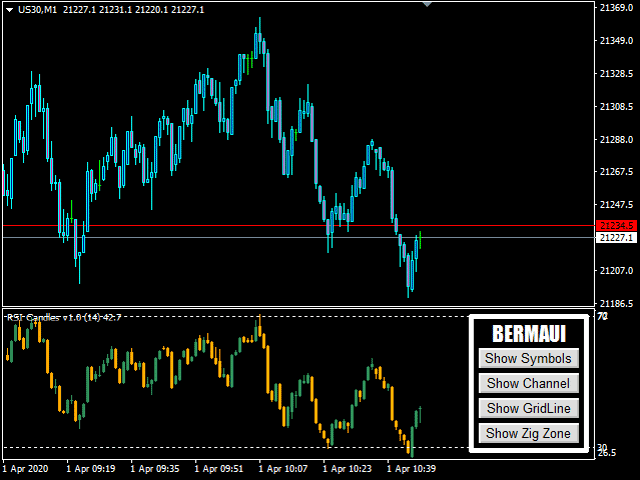
Bermaui RSI Candles
- 指标
- 版本: 1.0
- 激活: 20

该指标的想法是以蜡烛的形式绘制 RSI,可以与价格图表进行比较以生成买入和卖出信号。该指标不是我的发明。几年前我在互联网上创立了它。我更新了代码,添加了警报功能,添加了 Bermaui Utilities 工具组。
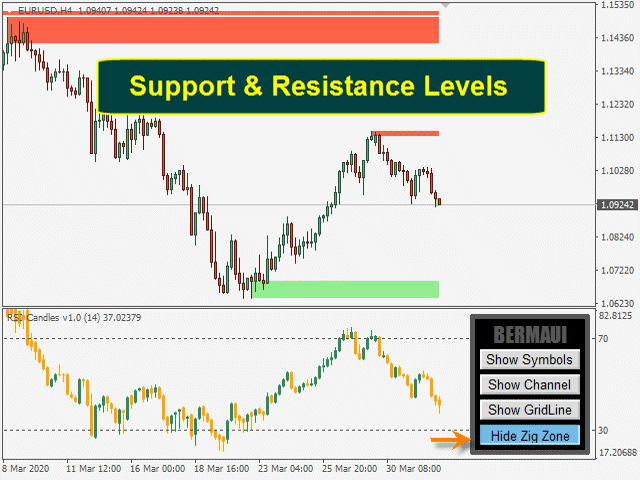
该指标计算用于绘制烛台的所有价格的 RSI(开盘价、最高价、最低价和收盘价的 RSI)。它使用它们中最高的来绘制高灯芯的 RSI 蜡烛,使用它们中最低的来绘制低灯芯的 RSI 蜡烛。 RSI 蜡烛的主体位于高点和低点之间。如果开盘的 RSI 低于收盘的 RSI,则认为 RSI 蜡烛看涨。如果开盘的 RSI 高于收盘的 RSI,则 RSI 蜡烛被视为看跌。
如何使用它
- 您可以在 RSI 蜡烛指标上交易趋势线突破,这将引领价格图表上的趋势,因为动量引领价格。
- 您可以在 RSI 蜡烛指标上绘制任何形式的经典图表模式,并像使用原始 RSI 一样进行交易。
- 它可以用作经典的 RSI。如果它穿过超买 (70%),则卖出,如果它穿过超卖 (30%),则买入。
- 您可以使用 RSI 蜡烛图和价格图表之间的背离来确认您的交易信号。
RSI 蜡烛特点
- 它不会重新绘制或重新计算其结果。
- 它适用于加密货币、股票、指数、石油、黄金和所有时间范围。
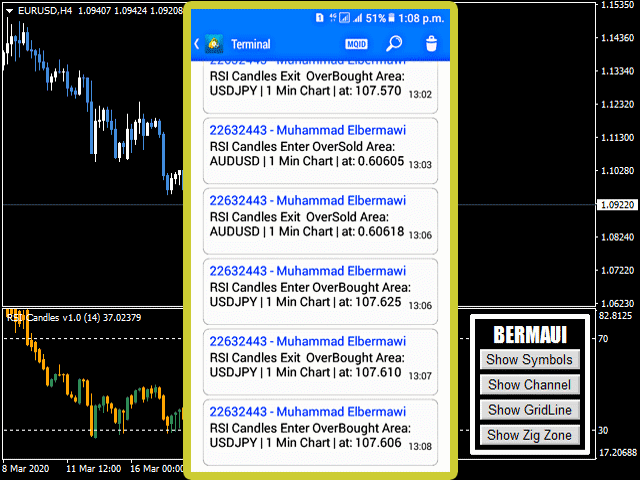
- 声音、电子邮件警报和移动通知。
- 在图表上显示超买和超卖信号的垂直线。
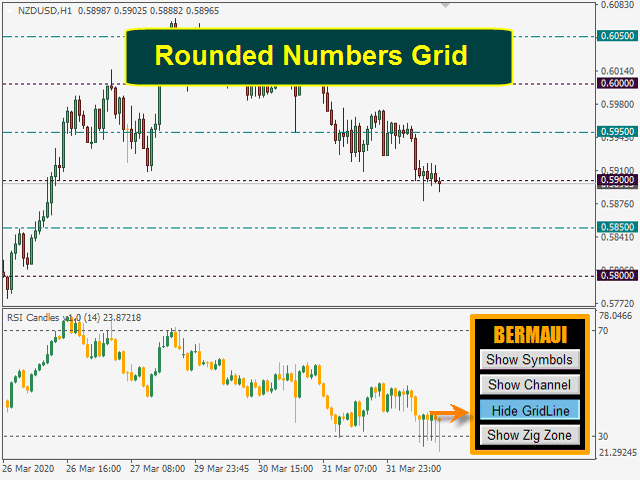
- 精心设计的参数可帮助用户轻松地在它们之间导航。
- 建立自己的专家顾问的缓冲区。
- 四种不同的颜色列表可供选择。
RSI 蜡烛参数
(1) 指标参数
- RSI 周期。默认值为 14。
- 超卖水平。默认值为 30%
- 超买水平。默认值为 70%
(2) V 线和警报
- 显示垂直线。如果为真,当 RSI 蜡烛穿过超买或超卖区域时,它将在图表上绘制垂直线。默认值为假。
- 声音警报。默认值为真。
- 发送电子邮件。默认值为假。
- 发送移动通知。默认值为假。
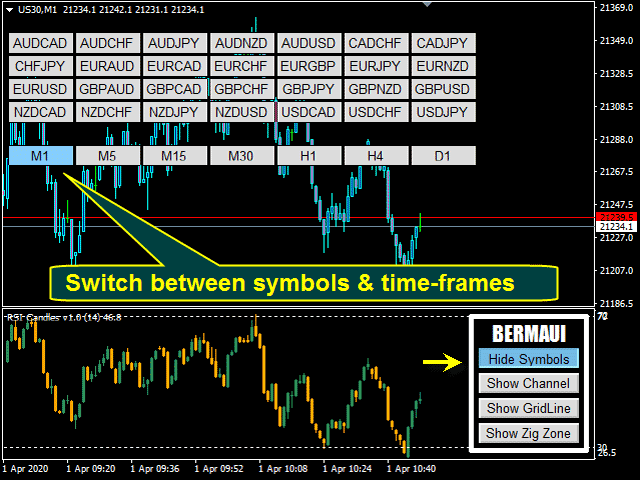
- 符号来源。从自定义交易 品种列表或 市场报价中获取交易品种。
- 符号列表(用“;”分隔)如果您从自定义列表中选择符号,则用“;”分隔符号。
- 按钮字体大小。默认值为十。
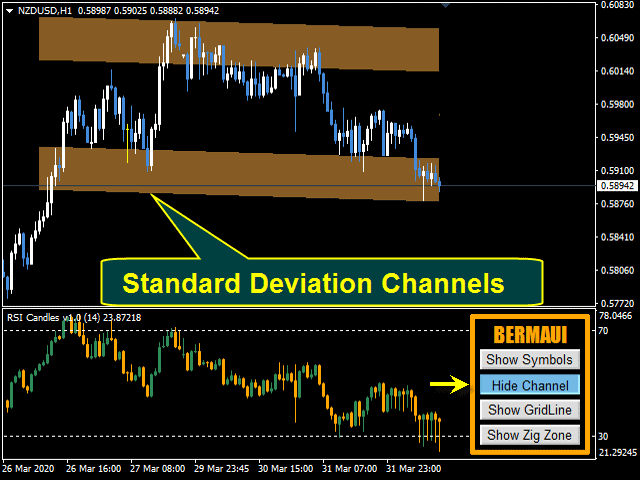
- 通道长度 [> 1]通道计算中使用的蜡烛数量。默认值为 100。
- 面板出现 [Shift + Letter]字母按加 shift 使面板出现。默认为“A”
- 面板消失 [Shift + Letter]字母按加shift 使面板消失。默认为“D”
- 图表颜色列表:用户可以为他的图表选择四种不同的颜色列表,或者如果他想使用自己的列表,他可以选择(什么都不做)。
Muhammad Al Bermaui,CMT


This is the best RSI indicator. HIghly recommnended. Please kindly send me the free Stochastic indicator. Thank you.