Bermaui Channel

5

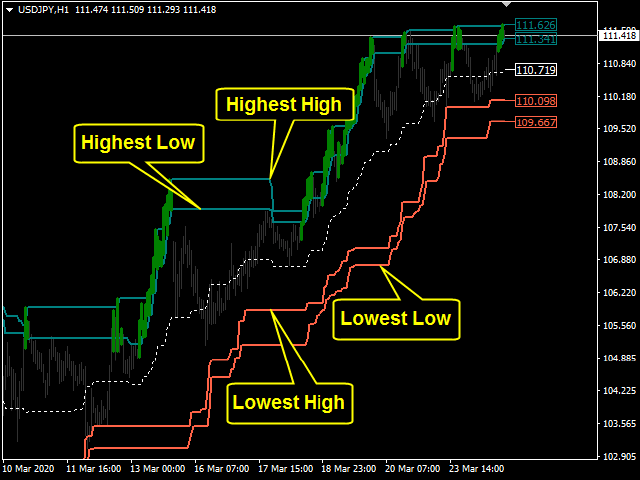
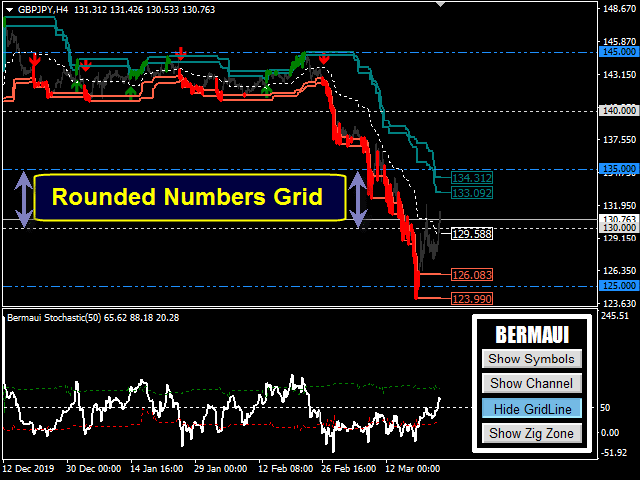
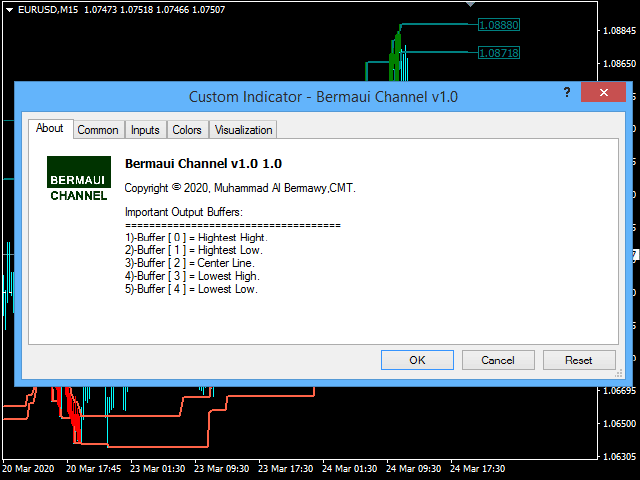
This is a price channel that shows five important price levels on the chart. Those levels are:

    1. The Highest High (HH) of the previous x bars.
    2. The Highest Low (HL) of the previous x bars.
    3. The Center Line.
    4. The Lowest High (LH) of the previous x bars.
    5. The Lowest Low (LL) of the previous x bars.

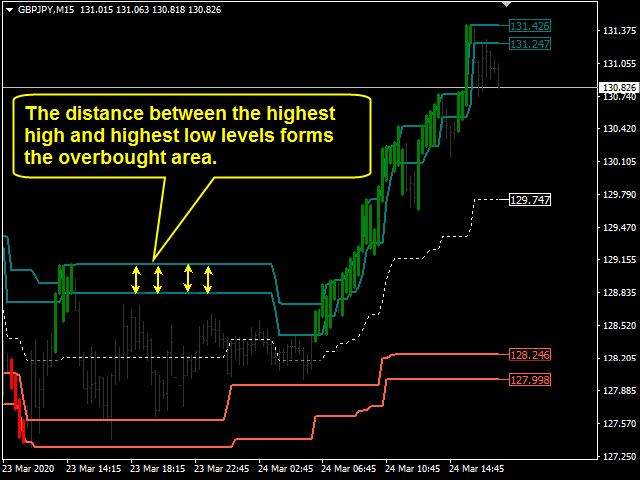
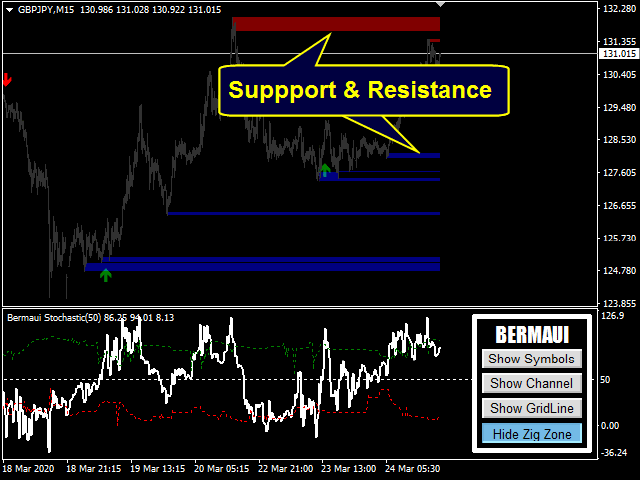
      How does Bermaui Channels Captures Overbought  area

        Think of the distance between HH and HL levels as an overbought area.
            When the price candles or bars crosses the HL to the upside this indicates that prices are getting inside its overbought area.
                When the price candles or bars crosses the HL to the downside this indicate that prices are getting outside its overbought area.
                    When the price candles cross the HH it creates a new high. This might indicate the beginning of a new uptrend that continues in progress until prices reverse its direction back again to the downside.

                      How does Bermaui Channels Captures Oversold  area

                        Think of the distance between LL and LH as an oversold area.
                            When the price candles or bars crosses the LH to the downside this indicates that prices are getting inside its oversold area.
                                When the price candles or bars crosses the LH to the upside this indicates that prices are getting outside its oversold area.
                                    When the price candles cross the LL it creates a new low. This might indicate the beginning of a new downtrend that continues in progress until prices reverse its direction back again to the upside.

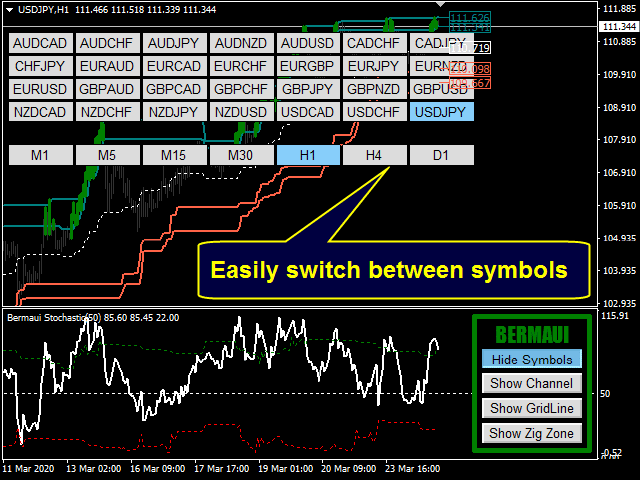
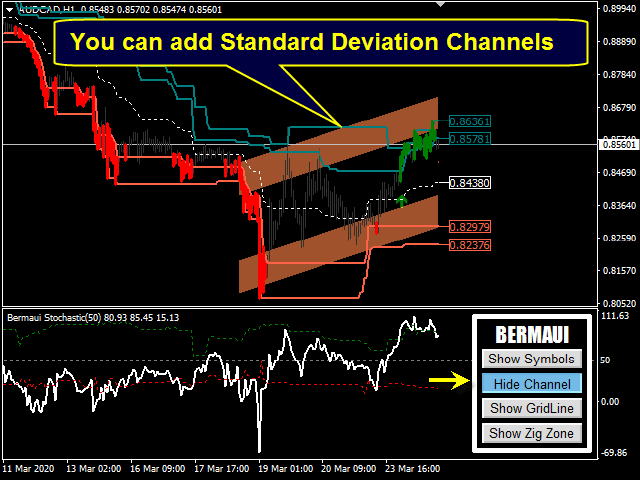
                                      Bermaui Channel Features

                                        Bermaui Channel does not repaint or recalculate its results.
                                          It works on cryptocurrencies, stock, index, oil, gold, and on all time frames.
                                            Sound, email alerts and Mobile Notification.
                                              Buy, sell arrows to help to identifying trend signals.
                                                Well-designed parameters to help the user easily navigate between them.
                                                  Buffer to build your own expert advisors.
                                                    Two different color lists to choose from.
                                                      The ability to draw overbought & oversold as price candles or bars.

                                                        Bermaui Channel Parameters

                                                          Candles. The number of candles used in BD% calculations (Minimum is 2).

                                                          Shift.The number of bars to backward shift. The default is one.

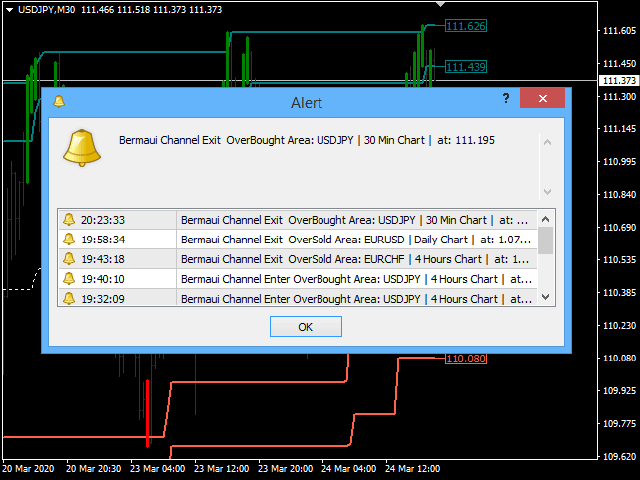
                                                          Sound Alert.The default is true.

                                                          Send Email.The default is false.

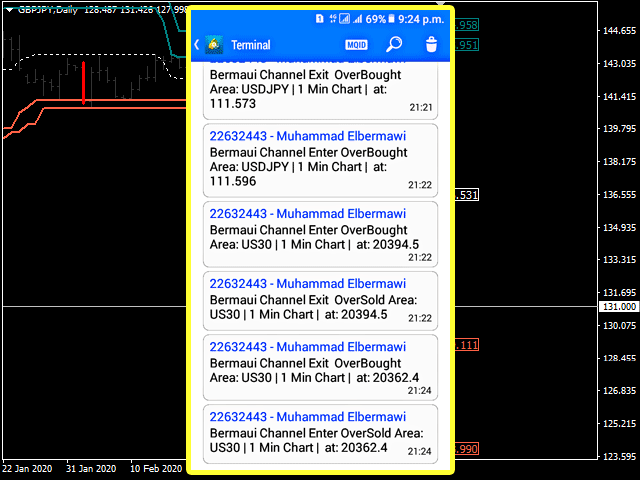
                                                          Send Notification.The default is false.

                                                          Colors List.You can choose between two color lists, or you can choose to (Do Nothing).

                                                          Show Price Label.At the edge of the channel. The default is true.

                                                          Price Label Width.The default is one.

                                                          Show OB/OS as:1. Bars| 2. Candles| 3. Hide

                                                          Overbought Area Color. The default is Teal.

                                                          Oversold Area Color.The default is Tomato.

                                                          Bullish Candles Color.The default is Green.

                                                          Bearish Candles Color.The default is Red.

                                                          Candle Wicks Width.The default is one.

                                                          Candle Body Width.The default is four.

                                                          Bars Width.The default is three.


                                                          Read this blog to know how to use the buffers in building your own expert advisor:
                                                          https://www.mql5.com/en/blogs/post/734560


                                                          If you have any questions then please, contact me via a private message or, write them in the comment section.
                                                          Muhammad Al Bermaui, CMT


                                                          리뷰 27
                                                          awasthisp
                                                          829
                                                          awasthisp 2023.08.26 09:30 
                                                           

                                                          It is one of best indicator to capture OB and OS areas

                                                          Werner Majer
                                                          921
                                                          Werner Majer 2022.09.07 16:18 
                                                           

                                                          Very good indicator, in connection with the Stockastic, very good results

                                                          mrkaib
                                                          1109
                                                          mrkaib 2022.09.05 19:53 
                                                           

                                                          in the backtest it looks very well. now i go to test it in live.

                                                          추천 제품
                                                          Auto Order Block with break of structure based on ICT and Smart Money Concepts (SMC) Futures Break of Structure ( BoS )             Order block ( OB )            Higher time frame Order block / Point of Interest ( POI )    shown on current chart           Fair value Gap ( FVG ) / Imbalance   -  MTF      ( Multi Time Frame )    HH/LL/HL/LH  -  MTF      ( Multi Time Frame )  Choch  MTF      ( Multi Time Frame )  Volume Imbalance     ,  MTF          vIMB Gap’s Power of 3 Equal High / Low’s  
                                                          BE Channel OHLC
                                                          Valerij Alekseev
                                                          3 (1)
                                                          The creation of this indicator was inspired by the phrase of the famous trader Michael Covel "Price is the best indicator in the world". Not everyone is able to see the market through the eyes of a professional. Probably an indicator that does not distort the price and visualizes what is happening on the market can help you. Indicator "BE Channel OHLC" has been created for this purpose. The indicator name has not been chosen by chance. The indicator draws a channel using OHLC prices (OPEN, HIGH,
                                                          TrendMaestro
                                                          Stefano Frisetti
                                                          5 (3)
                                                          Attention: beware of SCAMS, TRENDMAESTRO is only ditributed throught MQL5.com market place. note: this indicator is for METATRADER4, if you want the version for METATRADER5 this is the link:  https://www.mql5.com/it/market/product/108106 TRENDMAESTRO ver 2.5 TRENDMAESTRO recognizes a new TREND from the start, he never makes mistakes. The certainty of identifying a new TREND is priceless. DESCRIPTION TRENDMAESTRO identifies a new TREND in the bud, this indicator examines the volatility, volumes a
                                                          Seconds Chart - MetaTrader 4에서 초 단위 차트를 생성하는 독특한 도구입니다. Seconds Chart 를 사용하면 초 단위로 설정된 타임프레임으로 차트를 작성할 수 있어, 표준 분 또는 시간 단위 차트에서는 불가능한 유연성과 정밀한 분석이 가능합니다. 예를 들어, S15 타임프레임은 15초 동안의 캔들로 구성된 차트를 의미합니다. 모든 인디케이터, 전문가 자문(EA), 스크립트를 사용할 수 있으며, 표준 차트와 동일한 편리함으로 작업할 수 있습니다. 표준 도구와 달리, Seconds Chart 는 초고속 타임프레임에서도 높은 정확도와 지연 없이 작업할 수 있도록 지원합니다. Seconds Chart의 장점 1초부터 900초까지 의 타임프레임 지원. 즉시 로딩 MT5 터미널의 틱 데이터베이스 가져오기로 역사적 데이터를 빠르게 불러옵니다. MT5 터미널에서 Tick Database 유틸리티를 먼저 실행해야 틱 데이터베이스를 가져올 수 있습니다. 실시간 데이터 업데
                                                          Projection Trend
                                                          Tatiana Savkevych
                                                          Projection Trend - a Forex arrow indicator without redrawing does not change its signals when the market situation changes, does not adjust to the chart. The signals given by him are unambiguous. Traders build a trading system that provides good signals 80-90% of the time. The indicator showing the points of entry and exit from the market with arrows is able to bring results not only in the Forex market, but also when working with binary options. You can buy it and install it in MetaTrader you
                                                          PowerXXX
                                                          Marco Fornero Monia
                                                          PowerXXX measures the power of the current candlestick and displays it in numerical format and colors. The indicator can cover multiple timeframes and can be placed on the main chart or on the charts of the underlying indicators. The number of timeframes is selectable, as well as the color levels according to the power expressed. In the latest version, the power can be expressed as a function of the opening of the candle itself or as a function of the opening of the total candles before. There
                                                          Holy Renko PRO
                                                          Bianca Seara
                                                          3.5 (2)
                                                          About  Holy Renko is a trend identifier capable of identify small and long market movements. This indicator should be use in Renko Charts. VIDEO (information and tips) [HERE] How to install Renko Charts [HERE] Features Developed for Renko Charts Easy to analyze Fast signals Not repaint (when candle close)  Statistics panel Filters false signals Alerts, emails and push notifications  Advantages of Renko Chart Easy to install Easy to analyze Filter out the noise of wicks  Easy identification
                                                          Volume Bubble
                                                          Agus Santoso
                                                          블로그: https://www.mql5.com/en/blogs/post/769823 MT4: https://www.mql5.com/en/market/product/176181 MT5: https://www.mql5.com/en/market/product/176182 VOLUME BUBBLE [tambangEA]은 트레이더가 차트에서 비정상적인 시장 활동을 직접 식별할 수 있도록 설계된 프리미엄 시각적 거래량 압력 지표입니다. 이 지표는 비정상적인 델타/거래량 움직임을 감지하여 가격 움직임 주변에 깔끔한 버블 마커로 표시합니다. 각 버블은 거래량 압력 이벤트를 나타내므로 트레이더는 강한 참여, 불균형, 모멘텀 압력 또는 잠재적 흡수가 나타날 수 있는 지점을 빠르게 파악할 수 있습니다. 이 도구는 캔들별 거래량 데이터를 수동으로 분석할 필요 없이 시장 참여를 시각적으로 빠르게 파악하려는 트레이더를 위해 설계되었습니다. 핵심 개념 대부분의 가격 차트는 가격 움직임만 보여줍니다.
                                                          Trend Analysis in act
                                                          Ihab Mohamed Kamal Fouda
                                                          The Trend Analysis Indicator is an innovative tool designed for traders and investors who seek to navigate the complexities of the financial markets with greater precision and insight. This powerful indicator is engineered to adeptly identify whether a market is trending or not, offering users a vital edge in their trading strategy. Key Features: Accurate Trend Detection : The core functionality of the Trend Analysis Indicator lies in its ability to accurately detect market trends. It analyzes p
                                                          Rira Renko
                                                          Vitor Palmeira Abbehusen
                                                          RENKO on Time Chart This indicator is an enhanced Renko, so you can watch the Renko bricks on the chart to understand price movement more clearly the other improvement is automated box size according to ATR (Average True Range) period you can set the ATR number as you want and the box size of Renko changes automatically based on price movement Inputs Mode: Box size is the input to specify the size of the Renko box you want to print on the chart. This input lets you choose the fixed box siz
                                                          The expert works on the Fibonacci levels on the previous candle With some digital way to enter the deal On the five minute frame Work on currency pairs only Do not use TakeProfit or Stop Loss How the expert works It is placed on the three currency pairs GBPUSD GBPJPY GBP AUD Same settings without changing anything When he works, he will work on only one currency of them until it closes on a profit Profit is only seven points Please watch the video Explains how the expert works. Max Spread = 0.3
                                                          Mr Beast Trend Reverse
                                                          Luis Mariano Vazquez Marcos
                                                          MR BEAST TREND REVERSE RECOMENDED H1 EUR USD La estrategia "Trend Reverse" en el mercado de divisas (Forex) es un enfoque utilizado para identificar puntos de reversión de tendencias y capturar cambios de dirección en los precios de los pares de divisas. Esta estrategia se basa en la premisa de que las tendencias del mercado no duran para siempre y que se producirán puntos de inflexión. Este robot de trading de Forex ha sido desarrollado por MRBEAST como una herramienta para facilitar el trading
                                                          Holy Trend PRO
                                                          Bianca Seara
                                                          5 (1)
                                                          About Holy Trend was developed to identify trend and strength. VIDEO (information and tips) [HERE] Features Identifies trend Identifies strength of trend Identifies lines of support and resistance Easy to analyze Fast signals All timeframes Not repaint (when candle close) No settings required Can be used in Renko charts Can be used with indicator Holy Renko PRO Alerts, email and push notifications Advantages Sensitive identifier of trend able to identify the long, short movements and correc
                                                          This indicator Super Neuro Trend indicator.Indicator displays trend movement. Indicator helps to buy and sell. Features FiltPer- displays indicator period. deviation - displaus indicator deviation. Trend - displaus indicator trend.( true,false) Rectangle - displaus indicator rectangle. (true,false)  How to understand the status: If the trend color is green, trend is up. I f the trend color is red, trend is down. I f the trend waiting,trend waiting.     ///////////////////////////////////////////
                                                          Global Trend
                                                          Vitalii Zakharuk
                                                          Global Trend Indicator, shows the signals for entry. Displays both entry points and the trend itself. Shows statistically calculated moments for entering the market with arrows. When using the indicator, the risk factor can be optimally distributed. Settings: Uses all one parameter for settings. Choosing a parameter, it is necessary to visually resemble it so that the appropriate graph has a projection of extremes. Parameters: Length - the number of bars for calculating the indicator. Use
                                                          이 소프트웨어 도구는 사용자 정의 가능한 5가지 색상을 선택하여 수평 추세선과 직사각형을 생성하는 프로세스를 간소화하도록 설계되었습니다. MT5에서 정확한 수평 추세선을 그리는 것은 어려울 수 있지만 이 지표를 사용하면 원하는 색상으로 쉽게 추세선을 만들 수 있습니다. 또한 우리 도구는 귀하가 그리는 수평선과 관련된 가격 수준을 명확하게 표시합니다. 우리는 귀하의 피드백을 소중히 여기며 이 도구가 귀하의 거래 요구에 맞는 귀중한 자산이 되기를 바랍니다. 주저하지 말고 귀하의 생각을 우리와 공유해 주십시오. ..................................................................................
                                                          What indicator do you look at most on your MT4 charts? Is it the Moving Average? I d o not believe that the default grid lines on MT4 charts—which you likely see hundreds or thousands of times—are designed with the intent of helping the user win. This is why MT4 users apply various indicators and go through trial and error. Because it is a chart you look at every day, it must present reliable information that we humans can recognize intuitively. This indicator was born from a single core concep
                                                          Smart Fractals MT4
                                                          Mostafa Saad Saeed Shawara
                                                          제품 제목 Smart Fractals (MT4) – SmartView 시리즈의 일부 간단한 설명 MetaTrader 플랫폼에서 독특한 사용자 경험을 제공하는 Fractals 지표입니다. 이전에 사용할 수 없었던 고급 기능을 제공하며, 더블 클릭으로 설정 열기, 삭제하지 않고 지표 숨기기/표시하기, 지표 창을 전체 차트 크기로 표시하기 등의 기능을 포함합니다. SmartView Indicators 시리즈의 나머지 부분과 원활하게 작동하도록 설계되었습니다. 개요 SmartView 시리즈는 혁신적인 기능을 통해 MetaTrader 플랫폼의 지표에 독특하고 독특한 사용자 경험을 제공하여 지표 관리를 더 빠르고 쉽게 만듭니다. 각 지표는 차트에 스마트 제어 패널이 장착되어 있어 필수 정보를 표시하고 모든 중요한 기능에 빠르게 액세스할 수 있습니다. 이전에 사용할 수 없었던 고유한 기능 SmartView 시리즈는 지표 작업을 더 쉽고 빠르게 만드는 고급 기능을 제공합니다: 더블 클릭으로 설정
                                                          FREE
                                                          This indicator is a great utilities tools for Fibonacci Trader that draw their chart manually. This indicator do not draw any Fibonacci Retracement or Fibonacci Expansion. It is a utilities tool for modifying the Fibonacci level for Fibonacci object manually drawn on the chart. Just draw using the Fibonacci Retracement or other Fibonacci tool in MT4 as per normal. The select the Fibonacci you have just drawn. Make sure you have only 1 object selected. Then open up this Fibonacci Level Management
                                                          Bitcoin Trader Pro Indicator
                                                          Massimiliano Tuzzolino
                                                          Bitcoin Trader Pro Indicator is an advanced tool specifically designed for analyzing the cryptocurrency market, with a focus on BTCUSD. This indicator combines multiple technical analysis methods to generate precise and reliable trading signals. Perfect for both beginner and experienced traders, the Bitcoin Trader Pro Indicator provides everything you need to make informed trading decisions. My indicators for free. I only ask that leave your feedback to help me improve them or as a thank you. H
                                                          FREE
                                                          Fibonacci Auto Levels
                                                          Mohamed yehia Osman
                                                          Possible Price reversals levels - based on  Fibonacci + Support +  Resistance Levels Auto levels drawn based on input index (Bars Count )  ---->>> Price Over 50% Fibo line ---> UP TREND ---> BUY when price drop near Support Lines  ---->>> Price Down 50% Fibo line ---> DOWN TREND ---> SELL when price goes up  near Resistance Lines  --->>> The more close price levels ----> the more possibility for price reversals --->>> are you a scalper --> try it on M1 charts with big index like 5000 bars  or
                                                          Long term stats is a trend indicator.  As the name suggests, it computes long term running average, standard deviation and min/max values Average and standard deviation are plotted on the graph and deviation value is taken as input parameter (similarly to bollinger bands). Historical minimum and maximum are plotted on the graph and updated for each bar, considering historical time series slope. (this is to somehow account for inflation/deflation) Can be used as filter for signals, as trigger to
                                                          FREE
                                                          Cherokee
                                                          Andrey Kolmogorov
                                                          5 (1)
                                                          Cherokee  - is a professional adviser based on a trend tracking system with an adaptive algorithm. New sets are in the "Comments" section comments #2-3. Signal: 6 currency pairs Main Advantages 6 currency pairs; The EA does not use Martingale; The minimum starting deposit is $300; No need to close the robot during news releases; It works with 4 and 5-digit quotes; A multi-level model of a quantum set. Working parameters Currency pairs : EUR/USD, GBP/USD, EUR/CHF, USD/CHF, USD/CAD, USD/JPY ,  
                                                          Elystron MT4
                                                          Mehdi Faraz Fard
                                                          Elystron – Advanced  Trading Engine for XAUUSD Elystron is a professional trading system designed to manage losses through a structured recovery approach while targeting consistent net profit per cycle. Unlike traditional grid systems, Elystron treats every position as an independent cycle, applying a reverse recovery mechanism that ensures losses are compensated before profit is taken.   Live Signal (Real Account) Monitor Elystron performance in real market co
                                                          MQL Trendline EA
                                                          Martin Eshleman
                                                          3 (2)
                                                          Summary This EA will trade semi-automatically based on trend lines or horizontal lines that are manually plotted on the chart by the user. It can handle any number of lines per chart and each line can have its own adjustable settings. This EA manages every line separately based on specific user 'keywords' set for each line. Since each line has it's own independent settings, this is why there are very few shared inputs in this EA. Doing it this way allows for a single EA to manage many lines and
                                                          FREE
                                                          Moving Pivot Average    The pivot indicator compares the selected period with its counterpart from the previous period. The indicator uses very flexible algorithm for pivot value calculating. It allows you to allocate in days a certain time intervals (custom bars) and calculate the average pivot value based on High, Low and Close prices of these bars. How many custom bars will be taken into account is determined by the "Days" setting. The pivot line can be considered an average trend line and us
                                                          Identify Take
                                                          Oleksii Ferbei
                                                          4.5 (2)
                                                          Identify Take - trend trading strategy, market noise filtering and all necessary functions built into one tool! The system itself shows in the form of arrows when to buy and when to sell. Uses only one setting parameter. Simple, visual and effective trend detection. The intelligent algorithm of the Identify Take indicator shows the points of a potential market reversal. Most often, a good trend can be seen visually on the price chart. But an experienced trader must clearly understand the curre
                                                          Foolish Trader
                                                          Jan Isaac Rodriguez Castro
                                                          Foolish Trader is an Expert Advisor for MT4 designed with a simple yet effective logic, focused on following the main market trend. Its structure allows for dynamic lot management, applying a compound growth model to progressively take advantage of the account balance. This EA is focused on trading in the predominant market direction, with configurable parameters that make it easy to adapt to different symbols and trading styles. It is recommended for traders who prefer clean and easy-to-underst
                                                          Angry
                                                          Maryna Shulzhenko
                                                          Angry is a trend indicator, it indicates well the points of the beginning of the trend and its completion or reversal. This tool scans the market looking for the correct entry. Against the background of insignificant fluctuations, it is possible to identify a trend and indicate its direction. It uses only price data and analytics to calculate entry points. Does not use auxiliary indicators. Angry captures moments of stable price movement direction. There are only three types of trend: Bullish
                                                          RenkoMaPriceChannel
                                                          Sergey Deev
                                                          1 (1)
                                                          The indicator displays Renko bars on the chart, uses their data to calculate and display the moving average, PriceChannel and generates buy/sell signals. Renko is a non-trivial price display method. Instead of displaying each bar within a time interval, only the bars where the price moved a certain number of points are shown. Renko bars do not depend on a time interval, therefore the indicator works on any timeframe without losing its efficiency. The PriceChannel indicator displays the upper, lo
                                                          이 제품의 구매자들이 또한 구매함
                                                          Gann Made Easy
                                                          Oleg Rodin
                                                          4.83 (162)
                                                          Gann Made Easy 는 mr.의 이론을 사용하여 최고의 거래 원칙을 기반으로 하는 전문적이고 사용하기 쉬운 Forex 거래 시스템입니다. W.D. 간. 이 표시기는 Stop Loss 및 Take Profit Levels를 포함하여 정확한 BUY 및 SELL 신호를 제공합니다. PUSH 알림을 사용하여 이동 중에도 거래할 수 있습니다. 구매 후 거래 방법 안내 및 유용한 추가 지표를 무료로 받으시려면 저에게 연락주세요! 아마도 Gann 거래 방법에 대해 이미 여러 번 들었을 것입니다. 일반적으로 Gann의 이론은 초보자 거래자뿐만 아니라 이미 거래 경험이 있는 사람들에게도 매우 복잡한 것입니다. Gann의 거래 방식은 이론적으로 적용하기 쉽지 않기 때문입니다. 나는 그 지식을 연마하고 Forex 지표에 최고의 원칙을 적용하기 위해 몇 년을 보냈습니다. 표시기는 적용하기가 매우 쉽습니다. 차트에 첨부하고 간단한 거래 권장 사항을 따르기만 하면 됩니다. 지표는 지속적으로 시장 분석
                                                          The Propfolio Master Suite is the ultimate all-in-one analytical workstation for professional traders. Combining the power of the Beat The Market Maker (BTMM) methodology, Smart Money Concepts (SND/Liquidity), and Advanced Volume Profile, this suite replaces multiple different indicators with one optimized engine. Monitor up to 14 pairs simultaneously from a single chart, instantly identify market cycles, and seamlessly map institutional footprints with the click of a button. The Command Center
                                                          Scalper Inside PRO
                                                          Alexey Minkov
                                                          4.74 (69)
                                                          Scalper Inside PRO Scalper Inside PRO is an intraday trend and scalping indicator for MetaTrader 4 that uses an exclusive algorithm to quickly detect market direction and key target levels. It automatically calculates entry, exit and multiple profit targets, and shows detailed performance statistics so you can see how different instruments and strategies performed. This helps you choose the most suitable trading instruments for the current market conditions. Additionally, you can easily integrat
                                                          PZ Harmonacci Patterns
                                                          PZ TRADING SLU
                                                          3.17 (6)
                                                          Trade smarter, not harder: Empower your trading with Harmonacci Patterns This is arguably the most complete harmonic price formation auto-recognition indicator you can find for the MetaTrader Platform. It detects 19 different patterns, takes fibonacci projections as seriously as you do, displays the Potential Reversal Zone (PRZ) and finds suitable stop-loss and take-profit levels. [ Installation Guide | Update Guide | Troubleshooting | FAQ | All Products  ] It detects 19 different harmonic pric
                                                          M1 Sniper
                                                          Oleg Rodin
                                                          5 (23)
                                                          M1 SNIPER 는 사용하기 쉬운 거래 지표 시스템입니다. M1 시간대에 맞춰 설계된 화살표 지표입니다. 이 지표는 M1 시간대 스캘핑을 위한 단독 시스템으로 사용할 수 있으며, 기존 거래 시스템의 일부로도 사용할 수 있습니다. 이 거래 시스템은 M1 시간대 거래용으로 특별히 설계되었지만, 다른 시간대에도 사용할 수 있습니다. 원래는 XAUUSD와 BTCUSD 거래를 위해 이 방법을 설계했지만, 다른 시장 거래에도 유용하다는 것을 알게 되었습니다. 이 지표의 신호는 추세 방향과 반대로 거래될 수 있습니다. 저는 지표의 신호를 활용하여 양방향으로 거래할 수 있도록 돕는 특별한 거래 기법을 알려드립니다. 이 방법은 특별한 동적 지지선과 저항선 가격 영역을 활용하는 것을 기반으로 합니다. 구매하시면 M1 SNIPER 화살표 지표를 바로 다운로드하실 수 있습니다. 또한, 아래 스크린샷에 표시된 Apollo Dynamic SR 지표는 M1 SNIPER 도구를 사용하는 모든 사용자에게 무료로
                                                          Auto Optimized Parabolic RSI: 고급 3D 모멘텀 엔진 대부분의 개인 투자자용 보조지표는 시장의 변동성이 변하는 순간 무용지물이 되는 정적인 입력값에 의존하기 때문에 실패합니다. Auto Optimized Parabolic RSI는 자체적인 수학적 우위를 지속적으로 재계산하여 "보조지표 노후화" 문제를 해결하며, 기관급 퀀트 트레이딩의 적응력을 귀하의 MT5 터미널에 직접 제공합니다. 핵심 이점: 맞춤형 인메모리 3D 최적화   표준 자동 최적화 도구들은 일반적인 보조지표 호출로 터미널에 과부하를 일으켜 MT5 플랫폼을 멈추게 하는 경우가 많습니다. 이 도구는 이러한 병목 현상을 완전히 우회합니다. 맞춤형 네이티브 RAM 기반 계산기로 구축된 내부 엔진은 차트를 로드하거나 타임프레임을 변경할 때마다 빛처럼 빠른 3D 그리드 검색을 실행합니다. RSI 기간(주기), SAR 스텝(가속도) 및 SAR 최대치(속도 제한)를 동시에 스캔하여 플랫폼 지연 없이 수만 개의
                                                          NAM Order Blocks
                                                          NAM TECH GROUP, CORP.
                                                          3.67 (3)
                                                          MT4 Multi-timeframe Order Blocks detection indicator. Features - Fully customizable on chart control panel, provides complete interaction. - Hide and show control panel wherever you want. - Detect OBs on multiple timeframes. - Select OBs quantity to display. - Different OBs user interface. - Different filters on OBs. - OB proximity alert. - ADR High and Low lines. - Notification service (Screen alerts | Push notifications). Summary Order block is a market behavior that indicates order collection
                                                          Quants HL Break
                                                          Ferhat Mutlu
                                                          5 (2)
                                                          LH 및 HL 브레이크아웃을 찾기 위한 순수 가격 조치에 의한 고급 계산. 그것은 당신에게 시장에서 큰 반전 포인트를 줄 것입니다.LH 및 HL 신호는 traingle 브레이크 아웃에도 사용할 수 있습니다. 브레이크 아웃이 발생하면 강한 반전을 나타냅니다. 이동 평균에 대한 좋은 필터입니다. 추세 지표와 함께 사용하는 것이 좋습니다. 지원 및 저항, 공급 수요 지표에 대한 추가 확인으로 사용할 수 있습니다. 자세한 내용은 다음 외환 스레드에서 찾을 수 있습니다. 표시기가 다시 칠해지지 않습니다. Buffers :   SetIndexBuffer ( 0 ,UpBar);      SetIndexBuffer ( 1 ,UpBar2);           SetIndexBuffer ( 2 ,DnBar);      SetIndexBuffer ( 3 ,DnBar2);           SetIndexBuffer ( 4 ,UpBarTop);      SetIndexBuffer ( 5 ,UpBa
                                                          Dynamic Forex28 Navigator
                                                          Bernhard Schweigert
                                                          4.43 (7)
                                                          Dynamic Forex28 Navigator - 차세대 외환 거래 도구. 현재 49% 할인. Dynamic Forex28 Navigator는 오랫동안 인기 있는 지표의 진화형으로, 세 가지의 힘을 하나로 결합했습니다. 고급 통화 Strength28 지표(695개 리뷰) + 고급 통화 IMPULSE with ALERT(520개 리뷰) + CS28 콤보 신호(보너스). 지표에 대한 자세한 정보 https://www.mql5.com/en/blogs/post/758844 차세대 Strength 지표는 무엇을 제공합니까?  원래 지표에서 좋아했던 모든 것이 새로운 기능과 더 높은 정확도로 강화되었습니다. 주요 기능: 독점적인 통화 Strength 공식.  모든 시간대에 걸쳐 부드럽고 정확한 강도선. 추세와 정확한 진입을 식별하는 데 이상적입니다. 역동적인 시장 피보나치 수준(시장 피보나치).  이 지표에만 있는 고유한 기능. 가격 차트가 아닌 통화 강도에 피보나치가 적용됩니다.
                                                          PRO Renko System
                                                          Oleg Rodin
                                                          5 (30)
                                                          PRO Renko System 은 RENKO 차트 거래를 위해 특별히 고안된 매우 정확한 거래 시스템입니다. 이것은 다양한 거래 상품에 적용될 수있는 보편적 인 시스템입니다. 체계는 효과적으로 당신에게 정확한 반전 신호에 접근을 주는 소위 시장 소음을 중화합니다. 이 표시기는 사용하기가 매우 쉽고 신호 생성을 담당하는 매개 변수가 하나만 있습니다. 당신은 쉽게 당신의 선택의 어떤 무역 계기에 공구를 적응시킬 수 있고 renko 막대기의 크기. 나는 항상 당신이 내 소프트웨어로 수익성있게 거래 할 수 있도록 추가 지원을 제공 할 준비가되어 있습니다! 나는 당신에게 행복하고 수익성있는 거래를 기원합니다! 구매 후 저에게 연락하십시오! 내 렌코 차트 생성기를 보내드립니다. 또한 내 개인 권장 사항 및 시스템의 다른 모듈을 무료로 공유 할 것입니다!
                                                          RFI levels PRO
                                                          Roman Podpora
                                                          5 (1)
                                                          이 지표는 추세 반전 지점과 가격 반등 영역을 정확하게 보여줍니다.       주요 투자자들   . 새로운 트렌드가 형성되는 곳을 파악하고 최대한 정확하게 의사결정을 내리며 모든 거래를 완벽하게 통제합니다. TREND LINES PRO   지표와 함께 사용할 때 최대의 잠재력을 발휘합니다.  VERSION MT5 지표가 보여주는 내용: 새로운 추세의 시작 시 활성화되는 반전 구조 및 반전 수준. 최소한의 위험 대비 수익률을 갖는 이익 실현   (TAKE PROFIT)   및   손절매(STOP LOSS)   레벨 표시       RR 1:2   . 지능형 손실 감소 로직이 적용된 손절매 기능. 지정된 지표에서 두 가지 추세 유형에 대한 반전 패턴을 표시합니다. 지표: 트렌드를 따라   트렌드 라인 프로   (글로벌 트렌드 변화) 트렌드 프로   (빠른 트렌드 변화) 간단하고 효과적입니다       스캐너       실시간 추세 (신규). 다중 시간 프레임 도구 필터링. 표시하다  
                                                          Apollo SR Master
                                                          Oleg Rodin
                                                          5 (2)
                                                          Apollo SR Master는 지지/저항 구간에서의 거래를 더욱 쉽고 안정적으로 만들어 주는 특수 기능을 갖춘 지지/저항 지표입니다. 이 지표는 지역 가격의 고점과 저점을 감지하여 시간 지연 없이 실시간으로 지지/저항 구간을 계산합니다. 새롭게 형성된 저항 구간을 확인하기 위해 지표는 해당 저항 구간을 실제 매도 또는 매수 신호로 활용할 수 있음을 나타내는 특수 신호를 표시합니다. 이 경우, 저항 구간의 강도가 높아지고, 따라서 저항 구간에서의 성공적인 거래 가능성도 높아집니다. 이것이 바로 이 지표의 핵심 아이디어입니다. SR 존은 손절매와 이익실현을 더욱 쉽게 할 수 있도록 해줍니다. 신호 방향에 따라 SR 존 위 또는 아래 공간을 손절매로 활용할 수 있습니다. 또한, 반대쪽 SR 존은 잠재적 이익실현 영역으로 활용할 수 있습니다. 또한 Apollo SR Master 지표를 사용하는 모든 사용자에게 "Apollo Price Action System" 지표를 무료로 제공합니다.
                                                          이 지표를 구매하면 제 프로페셔널 트레이드 매니저를 무료로 드립니다. 우선 이 거래 시스템이 리페인팅, 리드로잉 및 레이그 인디케이터가 아니라는 점을 강조하는 것이 중요합니다. 이는 수동 및 로봇 거래 모두에 이상적인 것으로 만듭니다. 온라인 강좌, 설명서 및 프리셋 다운로드. "스마트 트렌드 트레이딩 시스템 MT5"은 새로운 및 경험이 풍부한 트레이더를 위해 맞춤형으로 제작된 종합적인 거래 솔루션입니다. 10개 이상의 프리미엄 인디케이터를 결합하고 7개 이상의 견고한 거래 전략을 특징으로 하여 다양한 시장 조건에 대한 다목적 선택이 가능합니다. 트렌드 추종 전략: 효과적인 트렌드 추이를 타기 위한 정확한 진입 및 손절 관리를 제공합니다. 반전 전략: 잠재적인 트렌드 반전을 식별하여 트레이더가 범위 시장을 활용할 수 있게 합니다. 스캘핑 전략: 빠르고 정확한 데이 트레이딩 및 단기 거래를 위해 설계되었습니다. 안정성: 모든 인디케이터가 리페인팅, 리드로잉 및 레이그가 아니므로 신뢰
                                                          GoldRush Trend Arrow Signal
                                                          Kirk Lee Holloway
                                                          5 (2)
                                                          GoldRush 트렌드 화살표 신호 GoldRush 트렌드 화살표 신호 지표는 XAU/USD 시장에서 고속 단기 스캘핑 트레이더를 위해 설계된 정밀한 실시간 트렌드 분석을 제공합니다. 1분 시간대에 특화되어 설계된 이 도구는 명확한 진입점을 표시하는 방향성 화살표를 제공하여 스캘퍼들이 변동성이 높은 시장 환경에서도 자신 있게 거래할 수 있도록 합니다. 이 지표는 PRIMARY 및 SECONDARY 경고 화살표로 구성됩니다. PRIMARY 신호는 추세 방향의 변화를 나타내는 흰색과 검은색 방향성 화살표이며, SECONDARY 신호는 PRIMARY 화살표가 지시하는 방향을 확인하고 잠재적인 거래 진입점을 표시하는 파란색과 빨간색 화살표입니다. 참고: 추세 방향이 변경된 후 PRIMARY 경고 화살표가 단 하나만 표시될 경우, 다수의 SECONDARY 파란색/빨간색 화살표가 표시될 수 있음을 유의해야 합니다. SECONDARY 신호는 신호 기준을 충족하는 어떤 캔들 이후에도 표시
                                                          Advanced Currency Strength28 Indicator
                                                          Bernhard Schweigert
                                                          4.91 (657)
                                                          현재 40% 할인 초보자 또는 전문가 트레이더를 위한 최고의 솔루션! 이 지표는 우리가 독점 기능과 새로운 공식을 통합했기 때문에 독특하고 고품질이며 저렴한 거래 도구입니다. 단 하나의 차트로 28 Forex 쌍의 통화 강도를 읽을 수 있습니다! 새로운 추세 또는 스캘핑 기회의 정확한 트리거 포인트를 정확히 찾아낼 수 있기 때문에 거래가 어떻게 개선될지 상상해 보십시오. 사용 설명서: 여기를 클릭  https://www.mql5.com/en/blogs/post/697384 그것이 첫 번째, 원본입니다! 쓸모없는 지망생 클론을 사지 마십시오. 더 스페셜  강력한 통화 모멘텀을 보여주는 하위 창의 화살표 GAP가 거래를 안내합니다! 기본 또는 호가 통화가 과매도/과매도 영역(외부 시장 피보나치 수준)에 있을 때 개별 차트의 기본 창에 경고 표시가 나타납니다. 통화 강도가 외부 범위에서 떨어질 때 풀백/반전 경고. 교차 패턴의 특별 경고 추세를 빠르게 볼 수 있는 다중 시간
                                                          Market Structure Patterns MT4
                                                          Samuel Manoel De Souza
                                                          5 (18)
                                                          Market Structure Patterns   is an indicator based on   smart money concepts   that displays   SMC/ICT   elements that can take your trading decisions to the next level. Take advantage of the   alerts ,   push notifications   and   email messages   to keep informed from when an element is formed on the chart, the price crosses a level and/or enters in a box/zone. Developers can access the values of the elements of the indicator using the   global variables  what allows the automation of trading d
                                                          Advanced Supply Demand
                                                          Bernhard Schweigert
                                                          4.91 (300)
                                                          현재 40% 할인! 초보자나 전문 트레이더를 위한 최고의 솔루션! 이 보조지표는 우리가 다수의 독창적 기능과 새로운 공식을 통합한 독특하고 고품질이며 저렴한 거래 도구입니다. 이 업데이트를 통해 이중 시간대를 표시할 수 있습니다. 더 높은 TF를 표시할 수 있을 뿐만 아니라 차트 TF와 더 높은 TF 모두를 표시할 수 있습니다: 중첩 영역 표시. 모든 Supply Demand 트레이더들이 좋아할 것입니다. :) 중요한 정보 공개 Advanced Supply Demand의 잠재력을 극대화하려면 다음을 방문하십시오. https://www.mql5.com/ko/blogs/post/720245   진입 또는 목표의 명확한 트리거 포인트를 정확히 찾아냄으로 해서 거래가 어떻게 개선될지 상상해 보십시오. 새로운 알고리즘을 기반으로 매수자와 매도자 간의 잠재적인 불균형을 훨씬 더 쉽게 분간할 수 있습니다. 왜냐하면 가장 강한 공급영역과 가장 강한 수요 영역과 과거에 어떻게 진행 되었는지를(이전
                                                          PZ Turning Points MT4
                                                          PZ TRADING SLU
                                                          1 (1)
                                                          Identify key turning points with reliable fractal analysis This indicator examines the price structure of fractals of different periods to determine possible reversal points in the market, providing timing to positional traders that already have a fundamental or technical valuation model. Unlike its younger brother, Reversal Fractals , this indicator won't miss reversals because of the period selected, and will find reversal fractals on a zig-zag fashion, ignoring those reversals which do not
                                                          외환 거래를 한다면, 통화 강도와 통화쌍 상관관계에 대한 상세한 정보를 아는 것은 거래 실력을 한 단계 끌어올리는 데 큰 도움이 됩니다. 상관관계를 분석하면 리스크를 절반으로 줄일 수 있고, 강도 분석을 통해 수익을 극대화할 수 있습니다. 이 지표는 통화 강도 분석과 통화쌍 상관관계를 결합하여 가장 적합한 통화쌍을 선택할 수 있도록 도와주는 하이브리드 접근 방식을 제공합니다. 통화 강도 분석 활용 방법 예를 들어, 당신의 거래 전략이 AUD/JPY 매수 기회를 제공한다고 가정해 봅시다. 하지만 KT 통화 강도 분석을 통해 JPY가 AUD보다 강해지고 있다는 것을 발견했다면, 이 거래는 손실로 끝날 가능성이 높습니다. 이 지표를 사용하면 이러한 손실을 쉽게 피할 수 있습니다. 통화쌍 상관관계 활용 방법 또 다른 예로, 거래 전략이 NZD/USD와 GBP/JPY 두 통화쌍 모두에 대해 매도 기회를 제공한다고 가정해 봅시다. KT 통화쌍 상관관계 분석을 사용하면 이 두 통화쌍 간 상관
                                                          Trend Catcher ind
                                                          Ramil Minniakhmetov
                                                          트렌드 캐처 인디케이터 트렌드 캐처 인디케이터는 개발자가 자체 개발한 맞춤형 적응형 트렌드 분석 지표들을 조합하여 시장 가격 움직임을 분석합니다. 단기적인 노이즈를 제거하고 근본적인 모멘텀 강도, 변동성 확대, 가격 구조 움직임에 집중하여 진정한 시장 방향을 파악합니다. 또한 이동 평균, RSI, 변동성 필터와 같은 맞춤형 지표들을 활용하여 가격을 평활화하고 트렌드를 필터링합니다. 실제 운영 모니터링 및 기타 제품은 다음 링크에서 확인하실 수 있습니다: https://www.mql5.com/en/users/mechanic/seller 텔레그램에서는 EA나 설정 파일을 판매하지 않습니다. 사기이니 주의하세요. 모든 설정 파일은 블로그에서 무료로 제공됩니다. 중요! 구매 후 즉시 연락 주시면 사용 방법 및 보너스를 드립니다!
                                                          Day Trader Master
                                                          Oleg Rodin
                                                          5 (15)
                                                          Day Trader Master 는 데이 트레이더를 위한 완벽한 거래 시스템입니다. 시스템은 두 개의 지표로 구성됩니다. 하나의 지표는 매수 및 매도를 위한 화살표 신호입니다. 얻을 수 있는 화살표 표시기입니다. 2차 지표를 무료로 드립니다. 두 번째 지표는 이러한 화살표와 함께 사용하도록 특별히 설계된 추세 지표입니다. 표시기는 반복하지 않고 늦지 않습니다! 이 시스템을 사용하는 것은 매우 간단합니다. 2색 선으로 표시되는 현재 추세 방향의 화살표 신호를 따라가기만 하면 됩니다. 파란색은 구매 추세입니다. 빨간색은 판매 추세입니다. 파란색 화살표는 매수 신호입니다. 빨간색 화살표는 매도 신호입니다. 추세선의 색상과 일치하려면 화살표의 색상과 신호의 방향이 필요합니다. 화살표 표시기는 주로 시간 간격 M5 및 M15에서 일중 거래를 위해 만들어졌습니다. 그러나 기술적으로 시스템은 다른 시간 간격으로 사용할 수 있습니다. 표시기에는 PUSH 메시지 기능이 있는 팝업 경고가 장착되어 있
                                                          KURAMA GOLD SIGNAL PRO (MT4) — 7층 필터, 자동 TP/SL, 품질 점수를 탑재한 XAUUSD 완벽 트레이딩 시스템 리페인트 없음. 리드로우 없음. 지연 없음. 모든 신호는 영구적입니다. 보이는 것이 그대로입니다. 보너스: 영구 라이선스 구매자에게 AI Zone Radar ($59 상당) + 전체 PDF 매뉴얼을 무료 제공. 구매 후 메시지를 보내주세요. AI Zone Radar: https://www.mql5.com/en/market/product/175834 트레이더의 신뢰: 활발한 골드 트레이더 커뮤니티에서 이미 사용 중. 정확도와 사용 편의성으로 호평을 받고 있습니다. 당신의 문제 — 그리고 해결책 골드가 하루 $30-50 움직인다는 걸 알고 있죠. 여기서 돈을 벌 수 있다는 것도. 하지만: - 너무 일찍 진입해서 가격이 당신 방향으로 가기 전에 $10 손절당함 - MA 터치마다 진입하지만 절반은 실패 - TP/SL 시스템이 없어서 너무
                                                          Dynamic Scalper System
                                                          Vitalyi Belyh
                                                          5 (1)
                                                          " Dynamic Scalper System " 지표는 추세 파동 내에서 스캘핑 방식으로 거래하도록 설계되었습니다. 주요 통화쌍 및 금에서 테스트되었으며, 다른 거래 상품과의 호환성이 가능합니다. 추가적인 가격 변동 지원을 통해 추세에 따라 단기 포지션 진입 신호를 제공합니다. 지표의 원리 큰 화살표는 추세 방향을 결정합니다. 작은 화살표 형태의 스캘핑 신호를 생성하는 알고리즘은 추세 파동 내에서 작동합니다. 빨간색 화살표는 상승 방향을, 파란색 화살표는 하락 방향을 나타냅니다. 민감한 가격 변동선은 추세 방향으로 그려지며, 작은 화살표의 신호와 함께 작용합니다. 신호는 다음과 같이 작동합니다. 적절한 시점에 선이 나타나면 진입 신호가 형성되고, 선이 있는 동안 미결제 포지션을 유지하며, 완료되면 거래를 종료합니다. 권장되는 작업 시간대는 M1~H4입니다. 화살표는 현재 캔들에 형성되며, 다음 캔들이 이미 시작되었더라도 이전 캔들의 화살표는 다시 그려지지 않습니다. 입력 매개
                                                          Master head and shoulders patterns for better trading decisions A head and shoulders pattern is a chart formation that resembles a baseline with three peaks, the outside two are close in height and the middle is highest. It predicts a bullish-to-bearish trend reversal and is believed to be one of the most reliable trend reversal patterns. It is one of several top patterns that signal, with varying degrees of accuracy, that a trend is nearing its end. [ Installation Guide | Update Guide | Trouble
                                                          PZ Double Top Bottom
                                                          PZ TRADING SLU
                                                          5 (1)
                                                          Trade double tops and bottoms effectively The PZ Double Top/Bottom Indicator is a technical analysis tool that helps traders identify potential price reversal patterns in the market. These patterns, known as double tops and bottoms, are characterized by two consecutive peaks or valleys in the price of an asset. Double tops and bottoms are often seen as potential reversal patterns because they can signal a change in the direction of the current trend. [ Installation Guide | Update Guide | Troubl
                                                          Gold Scalper Super
                                                          Aleksandr Makarov
                                                          5 (2)
                                                          Gold Scalper Super is an easy-to-use trading system. The indicator can be used as a standalone scalping system on the M1 time frame, as well as part of your existing trading system. Bonus: when purchasing an indicator, Trend Arrow Super is provided free of charge, write to us after purchase. The indicator 100% does not repaint!!! If a signal appears, it does not disappear! Unlike indicators with redrawing, which lead to the loss of a deposit, because they can show a signal and then remove it.
                                                          Cyclic Impulse
                                                          Vitalyi Belyh
                                                          차트를 구조화하고 주기적인 가격 변동을 식별하는 기술 지표입니다. 모든 차트에서 작업할 수 있습니다. 다양한 유형의 알림. 그래프 자체에도 추가 화살표가 있습니다. 역사를 재구성하지 않고, 촛불을 닫는 작업에 임한다. M5 이상에서 권장되는 TF입니다. 사용 및 구성이 쉬운 매개변수입니다. 매개변수가 다른 2개의 지표를 사용하는 경우, 다른 지표 없이 해당 지표만 사용할 수 있습니다. 2개의 입력 매개변수가 있습니다 주기성과 신호 지속 시간 이 2개의 매개변수는 차트 구조의 처리와 관련이 있습니다. Cyclicity - 역전 주기가 얼마나 자주 바뀌는지 조절하고 주기를 매끄럽게 합니다. Signal duration - 최소 숫자에서는 가격 움직임의 충격을 감지하고, 최대 숫자에서는 장기적 추세 움직임을 감지합니다.. --------------------------------
                                                          KuKl
                                                          IGOR KIRIANEN
                                                          The indicator is built on a non-standard Zig Zag, it draws accumulations after which if the price leaves this zone and a test of this zone occurs, then a sound signal is given and an arrow appears - after the test candle closes.The indicator does not redraw its signals, it is very easy to use, there are only three settings 1- this is the zig zag parameter 2- this is the minimum price exit from the zone 3- this is the maximum price exit from the zone. The lower the parameter for Zig Zag, the more
                                                          Trend Screener
                                                          STE S.S.COMPANY
                                                          4.79 (95)
                                                          트렌드 표시기, 트렌드 트레이딩 및 필터링을 위한 획기적인 고유 솔루션, 하나의 도구 안에 내장된 모든 중요한 트렌드 기능! Forex, 상품, 암호 화폐, 지수 및 주식과 같은 모든 기호/도구에 사용할 수 있는 100% 다시 칠하지 않는 다중 시간 프레임 및 다중 통화 표시기입니다. 기간 한정 특가: 지원 및 저항 스크리너 지표는 단 250 달러에 평생 제공됩니다. (원래 가격 65 달러) (제안 연장) Trend Screener는 차트에 점이 있는 화살표 추세 신호를 제공하는 효율적인 지표 추세 추종 지표입니다. 추세 분석기 표시기에서 사용할 수 있는 기능: 1. 트렌드 스캐너. 2. 최대 이익 분석이 있는 추세선. 3. 추세 통화 강도 측정기. 4. 경고가 있는 추세 반전 점. 5. 경고가 있는 강력한 추세 점. 6. 추세 화살표 Trend Screener Indicator가 있는 일일 분석 예, 일일 신호 성능...등은 여기에서 찾을 수 있습니다.   여기를 클릭하십시오.
                                                          Delta Fusion Pro
                                                          Francesco Secchi
                                                          5 (2)
                                                          Delta Fusion Pro – 인트라데이 트레이딩을 위한 고급 주문 흐름 분석 Delta Fusion Pro는 MetaTrader 4용 전문 지표로, 공격적인 주문 흐름을 드러내고 기관 압력의 강도와 방향을 실시간으로 보여줍니다. 기존의 거래량 지표와 달리, Ask와 Bid 거래량 간의 델타를 분석하여 반전 예측, 추세 확인 및 전문 관심 영역을 식별합니다. 주요 특징 지능형 자동 조정 시스템 다음 조건에 따라 모든 매개변수를 자동으로 조정합니다: 상품 유형 (외환, 암호화폐, 지수, 원자재, 주식) 운영 타임프레임 시장 변동성 (ATR) 최근 평균 거래량 초보 트레이더를 위한 수동 설정 없음 – 지표가 자동으로 보정됩니다! 기능 NetDelta 및 누적 델타 Ask/Bid 공격적 거래량 차이 계산, 사용자 지정 EMA 스무딩 실시간 방향 압력 시각화 히스토그램 색상 사용자 지정 (매수/매도) 가격/거래량 다이버전스 일반 및 숨겨진 다이버전스 자동 감지 강도 분류: 강/중/
                                                          제작자의 제품 더 보기
                                                          Berma Bands
                                                          Muhammad Elbermawi
                                                          5 (9)
                                                          Berma Bands(BBs) 지표는 시장 동향을 파악하고 이를 활용하려는 트레이더에게 귀중한 도구입니다. 가격과 BBs 간의 관계를 분석함으로써 트레이더는 시장이 추세 단계인지 범위 단계인지를 분별할 수 있습니다. 자세한 내용을 알아보려면 [ Berma Home Blog ]를 방문하세요. 버마 밴드는 세 개의 뚜렷한 선으로 구성되어 있습니다. 어퍼 버마 밴드, 미들 버마 밴드, 로어 버마 밴드입니다. 이 선들은 가격 주위에 그려져 전체 추세에 대한 가격 움직임을 시각적으로 표현합니다. 이 밴드들 사이의 거리는 변동성과 잠재적인 추세 반전에 대한 통찰력을 제공할 수 있습니다. 버마 밴드 라인이 각각에서 분리될 때, 그것은 종종 시장이 횡보 또는 범위 이동 기간에 접어들고 있음을 시사합니다. 이는 명확한 방향 편향이 없음을 나타냅니다. 트레이더는 이러한 기간 동안 추세를 파악하기 어려울 수 있으며 더 명확한 추세가 나타날 때까지 기다릴 수 있습니다. 버마 밴드 라인이 단일 라인으로
                                                          Bermaui Deviation Percent
                                                          Muhammad Elbermawi
                                                          4.94 (111)
                                                          또는 ( BD% )는 변동성을 포인트가 아닌 백분율로 측정하는 변동성 지수입니다. BD%의 개념은 0에서 100% 사이에서 움직이는 고전 표준 편차(CSD)에 따라 인덱스를 만드는 것입니다. BD%를 사용하여 다른 기간 또는 다른 기간의 동일한 증권에 대한 변동성을 비교할 수 있습니다. 또한 BD%를 사용하여 포인트가 아닌 백분율로 서로 다른 시장의 서로 다른 증권 간의 변동성을 비교할 수 있습니다. "BD%" 사용 방법 BD%가 90% 미만에서 이 수준을 상향 돌파하면 가격이 범위 내에서 움직일 수 있다는 신호입니다. BD%가 90%를 넘어 이 수준을 하향 돌파하고 가격이 이미 단순 이동 평균 위에 있다면 이는 새로운 상승 추세의 시작을 알리는 신호입니다. BD%가 하락세로 갈수록 변동성과 추세 강도가 증가하고 있습니다. BD%가 0%이면 변동성이 가장 높은 값에 있음을 의미합니다. BD%가 90%를 넘어 이 수준을 하향 돌파하고 가격이 이미 단순 이동 평균 아래에 있다면
                                                          Bermaui Manual EA
                                                          Muhammad Elbermawi
                                                          5 (10)
                                                          그리드 시스템을 거래하는 반자동 전문 고문입니다. 아이디어는 시장에서 점차적으로 다른 포지션을 취한 다음 손익분기점 수준을 계산하는 것입니다. 가격이 미리 결정된 거리만큼 이 손익분기점을 지나면 모든 열린 주문이 마감됩니다. 중요한 정보 다음은 사용자 가이드입니다.   https://www.mql5.com/en/blogs/post/730567 내 다른 제품과 함께 이 EA를 사용해 볼 수 있습니다. https://www.mql5.com/en/users/bermaui314/seller 중요한 기능 EA는 예상치 못한 결과로부터 거래된 자본을 보호하기 위한 손절매 메커니즘을 가지고 있습니다. EURUSD - XAUUSD - 석유 - 비트코인과 같은 모든 MT4 기호를 거래할 수 있습니다. 모든 MT4 기간을 거래할 수 있습니다. VPS에서 EA를 실행하는 것이 좋습니다. 매개변수 및 기본 설정 1) 자금 관리 설정 시작 로트. 레버리지가 1:400 이상인 경우 기본 설정을 50
                                                          Bermaui Bands
                                                          Muhammad Elbermawi
                                                          4.97 (68)
                                                          Bermaui Bands(BB)는 범위 및 추세 가격 움직임 사이를 필터링하는 데 도움이 되는 기술 분석 도구입니다. 이 지표의 이면에 있는 아이디어는 다음 단계에서 설명할 수 있습니다. 표준 편차를 0과 100 사이에서 이동하는 오실레이터로 계산합니다. 나는 그것을 Bermaui Deviation 퍼센트(BD %)라고 명명하겠습니다. "BD %"가 0에 가까우면 변동성이 극심합니다. 또한 "BD %"가 100에 가까우면 변동성이 매우 낮습니다. 높은 변동성은 추세 시장에 대한 큰 가능성을 의미하고 낮은 변동성은 횡보 또는 범위 시장을 의미합니다. 중간선은 표준편차가 SMA에 따라 계산되기 때문에 단순 이동 평균(SMA)입니다. Upper Bermaui Band를 얻으려면 계산에서 동일한 수의 막대를 사용하여 단순 이동 평균에 "BD %"를 추가하십시오. The Lower Bermaui Bands를 얻으려면 계산에서 동일한 수의 막대가 있는 단순 이동 평균에서 "BD %"를 빼십시오
                                                          MASR Bands
                                                          Muhammad Elbermawi
                                                          5 (5)
                                                          또는 M oving verage S upport를 R의 esistance 밴드. MASR 밴드 표시기는 지지 및 저항 수준으로 함께 작동하는 두 밴드로 둘러싸인 이동 평균입니다. 통계적으로 MASR 밴드는 시간의 93%에 가격 캔들을 포함합니다. 단계별로 계산하는 방법은 다음과 같습니다. 1. 첫 번째 단계는 X 기간 동안 최고 고가(HHV)와 최저 저가(LLV)를 계산하는 것입니다. 2. 두 번째 단계는 HHV를 LLV로 나누어 그들 사이의 거리가 얼마나 넓은지 백분율로 구하는 것입니다. 나는 이 단계의 결과를 MASR Filter라고 부른다. 3. MASR 필터 = 합계((HHV / LLV)-1) / 막대 수 4. 나는 이동 평균 저항의 지름길인 상위 밴드를 MAR이라고 부릅니다. 저는 이동 평균 지원의 지름길인 하단 밴드 MAS라고 부릅니다. 밴드 사이의 이동 평균을 중앙선이라고 합니다. 5. MAR = MASR 센터 + (75% x MASR 필터 x MASR 센터
                                                          Bermaui RSI Candles
                                                          Muhammad Elbermawi
                                                          5 (4)
                                                          이 지표의 아이디어는 매수 및 매도 신호를 생성하기 위해 가격 차트와 비교할 수 있는 양초 형태로 RSI를 그리는 것입니다. 지표는 내 발명품이 아닙니다. 나는 몇 년 전에 인터넷에서 그것을 설립했습니다. 코드를 업데이트하고 경고 기능을 추가했으며 Bermaui Utilities 도구 그룹을 추가했습니다. 표시기는 촛대를 그리는 데 사용되는 모든 가격의 RSI(시가, 고가, 저가 및 종가의 RSI)를 계산합니다. RSI 양초 높은 심지를 그리기 위해 가장 높은 값을 사용하고 RSI 양초 낮은 심지를 그리는 데 가장 낮은 값을 사용합니다. RSI 양초의 몸체는 고점과 저점 사이에 있습니다. 시가의 RSI가 종가의 RSI보다 낮으면 RSI 양초가 강세로 간주됩니다. 시가의 RSI가 종가의 RSI보다 높으면 RSI 캔들은 약세로 간주됩니다. 사용 방법 RSI 양초 지표에서 추세선 브레이크아웃을 거래할 수 있으며, 이는 모멘텀이 가격을 앞서기 때문에 가격 차트의 추세를 이끌 것입니다. RS
                                                          True Direction Oscillator
                                                          Muhammad Elbermawi
                                                          4.85 (364)
                                                          또는 (TDO) "순수 모멘텀 "의 원리를 사용하여 가격 변화율을 측정하는 지수입니다. 유가 증권 가격이 10에서 15로 상승하면 가격 변동률은 150%이지만 15에서 10으로 다시 하락하면 가격 변동률은 33.3%에 불과합니다. 이것이 "가격 변화율"(ROC) 또는 "모멘텀"과 같은 기술적 분석 지표가 내림차순에 제공된 것보다 상승하는 가격 움직임에 대해 더 높은 수치를 제공하는 이유입니다. TDO는 트레이더가 모멘텀을 올바르게 읽을 수 있도록 이 문제를 수정합니다. 중요한 정보 TDO 사용자 매뉴얼: https://www.mql5.com/en/blogs/post/717970 TDO FAQ : https://www.mql5.com/en/blogs/post/722015 TDO 비디오 라이브러리: https://www.mql5.com/en/blogs/post/722018 TDO 전문가 고문 예: https://www.mql5.com/en/blogs/post/731141 TDO
                                                          Moving Average Cloud
                                                          Muhammad Elbermawi
                                                          4.92 (13)
                                                          또는 "맥". 이것은 추세를 포착하고 거래하는 데 도움이 되도록 설계된 지표입니다. 이 지표의 이면에 있는 아이디어는 다음 단계에서 설명할 수 있습니다. 빠르게 움직이는 평균 봉투를 그립니다. 느리게 움직이는 평균 봉투를 그립니다. MAC Upper Band는 두 Envelopes의 high 사이의 가장 높은 값입니다. MAC Lower Band는 두 Envelope의 낮은 값 사이의 가장 낮은 값입니다. MAC 히스토그램 클라우드는 방향 변화를 보여주기 위해 두 밴드 사이의 거리를 채웁니다. Blue Cloud는 상승 추세를 나타내고 Red Cloud는 하락 추세를 나타냅니다. MAC 버퍼를 사용하여 자신의 EA 또는 스캐너를 구축하는 방법을 보려면 다음 블로그를 읽으십시오. https://www.mql5.com/en/blogs/post/734293 MAC 사용 방법 MAC 클라우드를 필터로 사용하여 추세 방향을 식별하는 데 도움이 됩니다. 가능한 한 잘못된 신호를 제거
                                                          Classic Keltner Channel
                                                          Muhammad Elbermawi
                                                          4.87 (30)
                                                          또는 CKC. 이 지표는 Chester W. Keltner(1909–1998)가 설명한 고전적인 10일 이동 평균 규칙에 따라 작동합니다. 모든 매개변수는 기본적으로 Keltner 시스템의 클래식 버전으로 설정되며 사용자가 원하는 경우 변경할 수 있습니다. 중요한 정보 CKC 매뉴얼 읽기: https://www.mql5.com/en/blogs/post/736577 CKC 전문가 고문 예: https://www.mql5.com/en/blogs/post/734150 Keltner 채널 공식 정보 1. 표준가(= (고가 + 저가 + 종가) / 3)에서 단순 이동 평균으로 중심선을 계산합니다. 2. 고가와 저가의 평균 차이인 ADR(Average Daily Range)을 중심선에 대해 동일한 기간 및 계산 방법으로 계산합니다. 3. Keltner 매수 라인 = 센터 라인 + ADR. 4. Keltner 판매 라인 = 센터 라인 – ADR. Keltner 10일 이동 평균 규칙 Kel
                                                          Bermaui Pin Bars
                                                          Muhammad Elbermawi
                                                          5 (13)
                                                          버마우이 핀 바 또는 (BPB)는 차트에서 핀 바 가격 행동 패턴을 찾는 지표입니다. Pin Bars는 Hammer, Inverted-Hammer, Hanging Man, 슈팅 스타, Dragon Fly Doji 또는 Grave Stone Doji와 같이 높이가 높거나 낮은 그림자와 매우 작은 몸체를 가진 일본 촛대의 대안인 고전적인 바 패턴인 "Pinocchio Bars"의 지름길입니다. . Bermaui Pin Bars 표시기는 다음 단계에서 설명할 수 있는 공식에 따라 이 패턴을 찾습니다. 처음에 BPB는 양초 몸체의 중심을 계산합니다( = [Open + Close] / 2). 그런 다음 BPB는 몸체 중심과 촛불 사이의 거리를 낮게 찾습니다. 마지막 단계는 2단계 결과를 양초 범위로 나누는 것입니다. 양초 본체 중심이 양초의 고점 또는 저점에 너무 가까우면 BPB가 핀 막대 패턴을 감지하고 사용자에게 경고합니다. 버마우이 핀 바 공식 : https://www.mql5.com
                                                          필터:
                                                          awasthisp
                                                          829
                                                          awasthisp 2023.08.26 09:30 
                                                           

                                                          It is one of best indicator to capture OB and OS areas

                                                          mostafa gamal
                                                          59
                                                          mostafa gamal 2023.02.22 12:12 
                                                           

                                                          사용자가 평가에 대한 코멘트를 남기지 않았습니다

                                                          Werner Majer
                                                          921
                                                          Werner Majer 2022.09.07 16:18 
                                                           

                                                          Very good indicator, in connection with the Stockastic, very good results

                                                          mrkaib
                                                          1109
                                                          mrkaib 2022.09.05 19:53 
                                                           

                                                          in the backtest it looks very well. now i go to test it in live.

                                                          AlbertZAR
                                                          670
                                                          AlbertZAR 2022.04.08 17:36 
                                                           

                                                          What a brilliant indicator, helps me stay on the right side of the market. Great work Muhammad!

                                                          iamgibson
                                                          338
                                                          iamgibson 2022.02.22 14:00 
                                                           

                                                          사용자가 평가에 대한 코멘트를 남기지 않았습니다

                                                          hungnq1992
                                                          1576
                                                          hungnq1992 2022.02.16 16:57 
                                                           

                                                          사용자가 평가에 대한 코멘트를 남기지 않았습니다

                                                          Robbert
                                                          1073
                                                          Robbert 2022.02.06 16:11 
                                                           

                                                          This is my 4th indicator from this Author and same as the others, top quality and support !

                                                          aztron
                                                          241
                                                          aztron 2022.01.27 06:02 
                                                           

                                                          사용자가 평가에 대한 코멘트를 남기지 않았습니다

                                                          Frank Paetsch
                                                          7501
                                                          Frank Paetsch 2022.01.22 23:30 
                                                           

                                                          5 stars

                                                          soharsteel
                                                          445
                                                          soharsteel 2021.11.03 20:14 
                                                           

                                                          excellent indicatoer . liked it a lot

                                                          Robin Olov Henry Lundberg
                                                          765
                                                          Robin Olov Henry Lundberg 2021.10.28 12:54 
                                                           

                                                          Good indicator that gives an idea of where we are in the flow or trend, can be used as a counter trend indicator or a trend indicator depending on how you read the market. Muhammad is also very supportive and quick in replying in case you need any support or help with settings. 5/5! I own a few of Muhammads indicators and EAs and he is one of the few good ones here on mql5.

                                                          Uladzimir Veramei
                                                          675
                                                          Uladzimir Veramei 2021.10.20 23:30 
                                                           

                                                          Helpful indicator, integrated it with my main strategy. Also could be automated. Support from the author is quick, satisfied.

                                                          Blin81
                                                          171
                                                          Blin81 2021.10.07 09:55 
                                                           

                                                          사용자가 평가에 대한 코멘트를 남기지 않았습니다

                                                          Joshua Crisologo Joaquin
                                                          268
                                                          Joshua Crisologo Joaquin 2021.09.27 10:58 
                                                           

                                                          I rented it for now as I just wanted to get the author's Bermaui Stochastic. However, seeing how it visually helps you in your trading (especially if you're strategy revolves around heavily overbought/oversold areas) - this is a must buy. I'll definitely purchase it after the rent period.

                                                          Muhammad Elbermawi
                                                          53529
                                                          개발자의 답변 Muhammad Elbermawi 2021.09.27 14:55
                                                          Thanks a lot, Joshua 🙏💚
                                                          Alex421
                                                          59
                                                          Alex421 2021.09.21 23:18 
                                                           

                                                          사용자가 평가에 대한 코멘트를 남기지 않았습니다

                                                          spetrosyan1979
                                                          524
                                                          spetrosyan1979 2021.08.29 13:22 
                                                           

                                                          Very good 🔥

                                                          Muhammad Elbermawi
                                                          53529
                                                          개발자의 답변 Muhammad Elbermawi 2021.08.30 05:18
                                                          Thanks for the great review, my friend. I appreciate it 🙏 💚
                                                          You can join my telegram group from here:
                                                          https://t.me/BermauiChannel
                                                          kurniartanto
                                                          65
                                                          kurniartanto 2021.08.07 16:50 
                                                           

                                                          Decided to try this indicator as in my opinion it is easy to understand and follow. Moreover, the author also provides the rationale of the trade when he used this tool for trading.

                                                          Muhammad Elbermawi
                                                          53529
                                                          개발자의 답변 Muhammad Elbermawi 2021.08.07 16:55
                                                          Thanks for the great review, my friend. I appreciate it 🙏 💚
                                                          You can join my telegram group from here:
                                                          https://t.me/BermauiChannel
                                                          Aoss Thanasit
                                                          52
                                                          Aoss Thanasit 2021.07.23 14:28 
                                                           

                                                          Bermaui Channel is an indicator that makes trading It's easier to do. I like it a lot.

                                                          Muhammad Elbermawi
                                                          53529
                                                          개발자의 답변 Muhammad Elbermawi 2021.08.06 21:45
                                                          Thanks for the great review and stars 🙏💚
                                                          You can join my telegram group from here:
                                                          https://t.me/BermauiChannel
                                                          Hisham Ghoneim
                                                          301
                                                          Hisham Ghoneim 2021.07.21 14:00 
                                                           

                                                          사용자가 평가에 대한 코멘트를 남기지 않았습니다

                                                          12
                                                          리뷰 답변