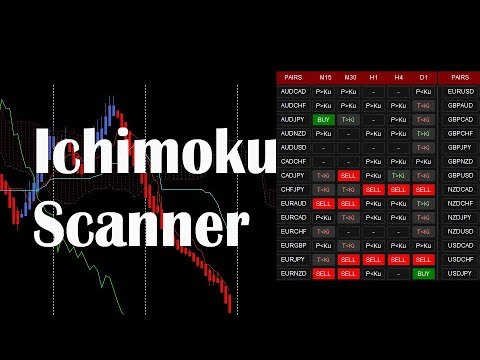
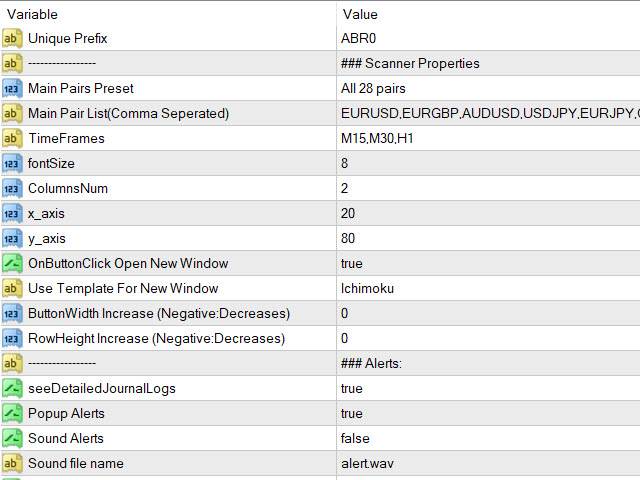
Ichimoku Scanner Dashboard
- 指标
- 版本: 2.19
- 更新: 16 二月 2021
- 激活: 20

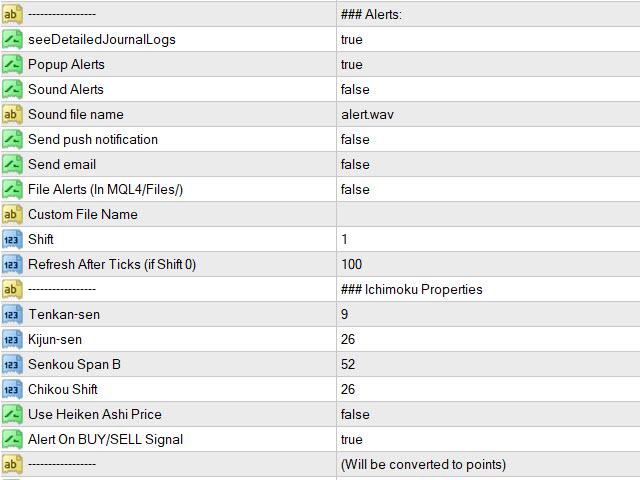
Dashboard uses Ichimoku Strategy to find best trades.
Get extra Indicators/Template:
And read more about detailed Product Description and usage here:
https://www.mql5.com/en/blogs/post/747457
Read more about Scanner Common features in detail here:
https://www.mql5.com/en/blogs/post/747456
Features:
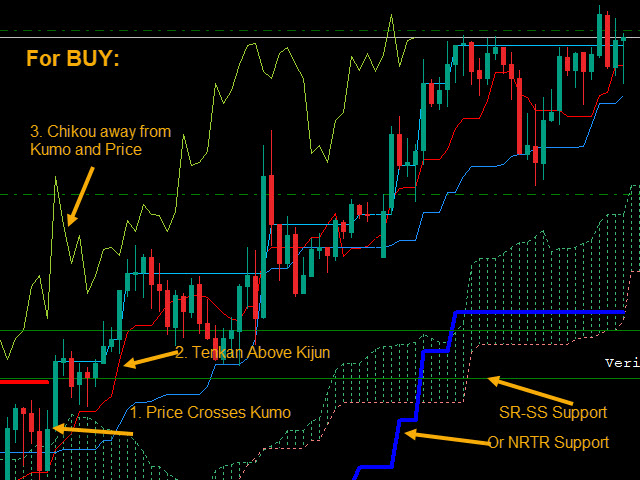
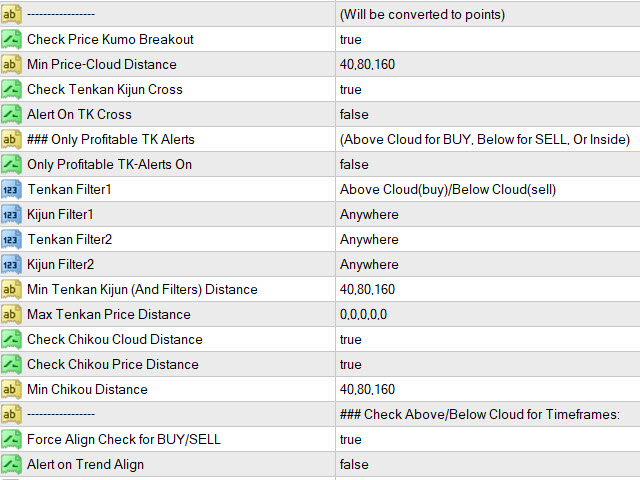
- Price Kumo Breakout
- Tenkan-Kijun Cross
- Chikou/CLoud and Chikou/Price
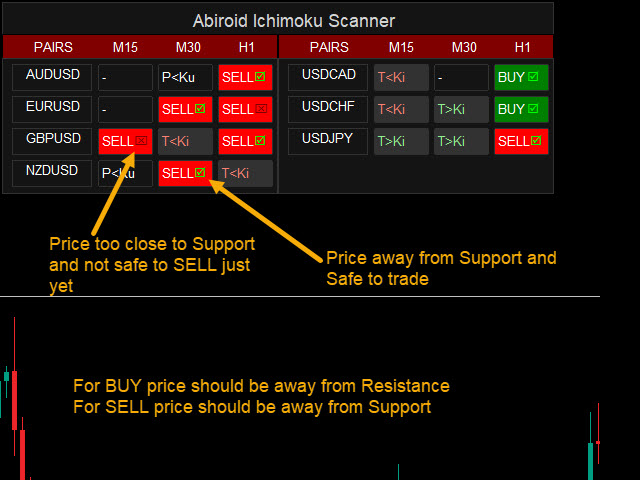
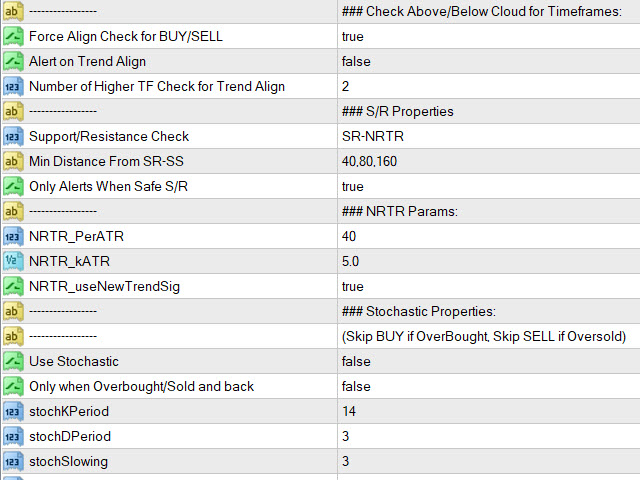
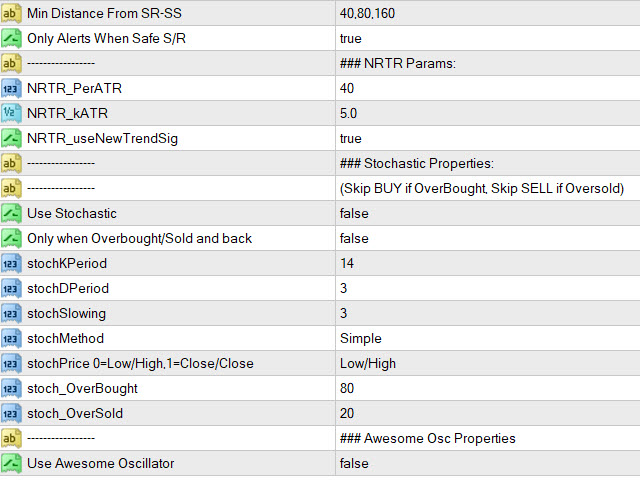
- Support/Resistance (SR-SS or SR-NRTR)
- Stochastic OB/OS and back
- Awesome Oscillator
- Higher Timeframe Ichimoku Trend Align


Very powerful tool!!!!!! The dashboard gives you a complete outlook at a glance, I have been trading with Ichimoku for quite a while and this is exactly what I am looking for.. And the support from the Author(Abir Pathak) is incredible.