Macd Scanner with embedded Trend filter

4.75

This scanner is monitoring the entire market for trade opportunities for all symbols and for all time frames. You don't have to look to all the charts, for all symbols and for all time frames. This scanner will alert you on your computer, or on your mobile, when a trade opportunity has been found. You never have to miss a trade opportunity!


This indicator is designed to scan all pairs and symbols, for all time frames, to find a cross of the MACD main and signal line.


MACD Definition

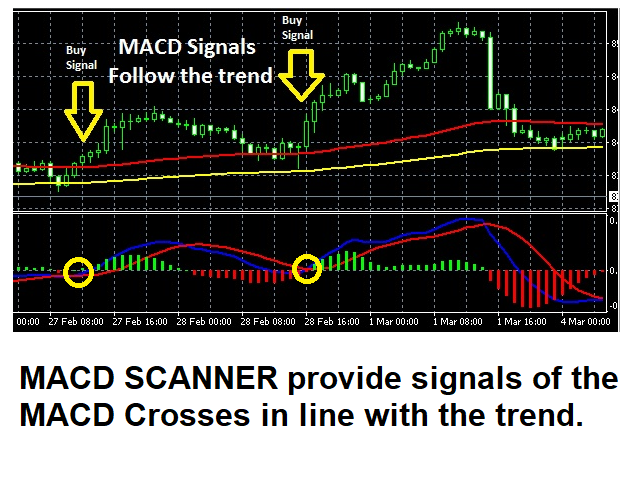
The MACD is used to follow trends. The MACD is calculated as follows: 12-period EMA - 26 period EMA (default values). The MACD signal is the EMA (9 days) of the MACD line.  The most important signal of the MACD is when the MACD crossed the signal line up or down. This gives us a signal that a trend might be emerging in the direction of the cross.

 Note: This indicator will not show information on the chart. This is a scanner and will provide reliable MACD trading alerts.


MACD Trading Strategy

The MACD strategy is to trade when there is a cross of the MACD and Signal line. However, you do not want to act on every signal. You will be most successful when you follow the trend.


This scanner has implemented multiple filters to provide most reliable MACD signals:

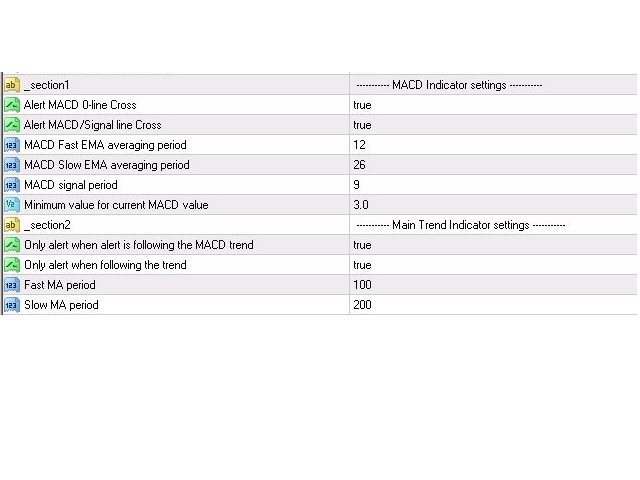
  • Signals will be filtered when it is not following the MACD trend. E.g. If the MACD is below the zero line, no Bullish alerts will be issued.
  • The scanner has an embedded trend filter, to only provide signals following the trend.
  • It will filter signals if the MACD value is low. If the MACD value is low, it means that the 12-period EMA and the 26 period EMA are close to each other. In this case, there is no strong trend, and you don't want to trade in this condition.


Trading Recommendations: 

  • Like for every indicator, the higher time frames are more reliable then shorter time frames. For that reason, the recommendation is to use the scanner for high time frames only (H1 or higher).
  • Do not enter the market when high critical news is expected the same day. High critical news can result in unexpected movements in the market, which can not be identified by any indicator. News can be found on e.g. the MQL website, DailyFX and investing.com.
  • Do not enter the market when the price is close to an important support or resistance.


Features

  • Provide trading signal to enter the market, for a MACD / Signal cross, in line with the mean trend.
  • Provide signals to exit the market, based on a counter trend MACD/Signal cross.
  • Scans all symbols visible in your Market Watch window, or all symbols available for your broker at the same time.
  • Indicator only have to be installed on one chart to scan the entire market.
  • Specify which time frame you want to monitor. Each time frame can be selected in the settings.
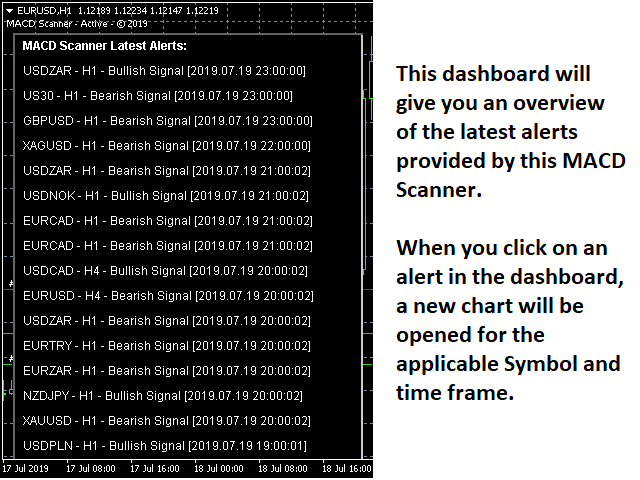
  • The dashboard will show the latest alerts provided by this Scanner. When you click on an alert in the dashboard, a new chart will be opened for the applicable Symbol and time frame. The new chart will highlight the alert with a vertical line.
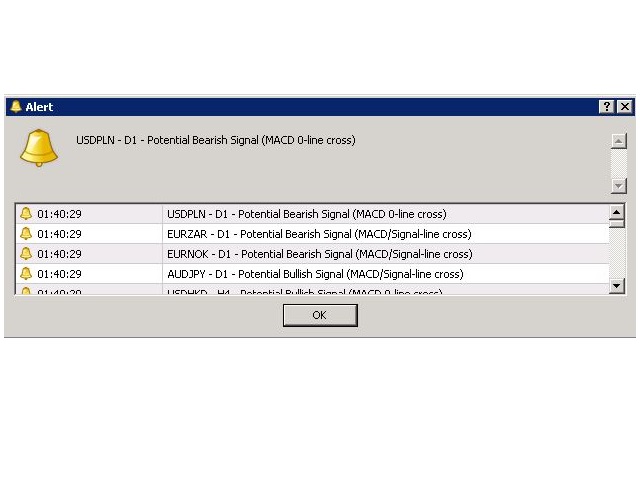
  • Receive Alerts in the MT4 terminal for each trade opportunity found.
  • Receive Alerts on your mobile phone, so you never miss a trade opportunity!
  • Low CPU usage.
  • Alerts for MACD Main / Signal crosses, with Trend filter
  • Alerts when the MACD 0-line is crossed


Installation

  • Download the Indicator in your MT4 terminal after you have purchased the product.
  • Put the indicator on one chart in your MT4 terminal (any chart can be used, any symbol and time frame can be used), and from that moment the entire market will be scanned for all pairs and symbols, and for all time frames as configured.


Parameters

Please refer to my blog for detailed clarification for all the settings.

      评分 6
      intan08
      1388
      intan08 2022.07.25 16:05 
       

      Pleased with this.

      Rogelio Hernandez
      76
      Rogelio Hernandez 2021.01.21 00:21 
       

      This is a really good product, quality, price and really good support are the key here. Thanks for this tool!

      Aravind Kolanupaka
      10179
      Aravind Kolanupaka 2019.03.06 10:25 
       

      Very good.

      推荐产品
      Clever RSI
      Carlos Forero
      Description Better version of RSI indicator which offer a complete visual trading strategy and realize an auto-optimization Support:   We create great tools for the entire trading community. Most of them are free. If you believe in what we do  Support Us Here.   KEY LINKS:   How to Install  –  Frequent Questions  -  All Products  How is this indicator useful? NEVER repaints. Detect best parameters of RSI indicator, based on profit factor during the specified period. This indicator can be used as
      My Point MT4
      Claudia Ramona Angerer
      4 (1)
      Diagnosis of major and minor pivot Trend detection with many signals Can be used in all symbols Can be used in all time frames Settings: Back Show: The number of candles it displays If you need any adjustments, or have any questions or suggestions, message me How to trade: Blue: sell signal Red: buy signal Blue and red at the same time: no signal Exit signal: Opposite signal
      Crypto_Forex MT4 版“趋势入场柱状图”指标,无需重绘。 - 趋势入场柱状图指标可用于在 Entry_bar 出现后搜索趋势方向的入场信号。 - 该指标的独特之处在于它同时考虑价格和交易量进行计算。 - 趋势入场柱状图有两种颜色:红色表示看跌趋势,蓝色表示看涨趋势。 - 一旦趋势稳定(至少 10 个连续的相同颜色柱状图),请等待 Entry_bar。 - 入场信号是柱状图中第一列颜色与第一列相反,第二列颜色为初始趋势颜色(参见图片)。 - 使用短线目标 - 根据当前趋势,选择图表上最接近的高点/低点。 - 指标内置移动端和 PC 端警报。 指标使用方法: - 买入信号:稳定的看涨趋势(蓝色柱状图柱状图)+ 柱状图上的 1 个红色柱状图 + 1 个蓝色柱状图(在此开多头仓位)。 - 卖出信号:持续看跌趋势(红色柱状图)+ 1 条蓝色柱状图 + 1 条红色柱状图(在此开空头仓位)。 点击这里查看高质量的交易机器人和指标! 这是仅在 MQL5 网站上提供的原创产品。
      Upper and Lower Trendline
      David Muriithi
      5 (2)
      This indicator uses a different approach from the previous version to get it's trendlines. This method is derived from Orchard Forex, and the process of making the indicator is demonstrated in there video   https://www.youtube.com/watch?v=mEaiurw56wY&t=1425s . The basic idea behind this indicator is it draws a   tangent line   on the highest levels and lowest levels of the bars used for calculation, while ensuring that the lines don't intersect with the bars in review (alittle confusing? I know
      FREE
      MQLTA Candle Timer
      MQL4 Trading Automation
      5 (1)
      MQLTA Candle Timer is an indicator that can show you the details about a symbol/pair and alert you before the close of a candle. Used in swing trading and not only, it can help your strategies knowing and be ready before the close of a candle. How does it work Simply add the indicator to the chart and set the notifications options. You can load a minimalistic interface or a full interface. The alert will be sent once per candle. Parameters All the parameters, that you can see in the picture, a
      FREE
      Description I think, almost all traders dream about non-lagging MA. I have realized that dream in my indicator. It allows forecasting future MA values! The indicator can be used in four different ways: The first one - forecast for the desired amount of bars. Thus, you are able to evaluate future price behavior. The second one - generating non-lagging "averages". That can be implemented by moving MA back by the half of the averaging period and setting the forecast the necessary amount of bars ahe
      FREE
      It could help to calculate Risk-Reward easily before placing a BUY-SELL position. TradeSizeCalculator is a Multi-Tasking Calculator. It will calculate the others when we define the value in one of the columns. Stoploss, risk percentage, risk-money, lot size, take-profit , reward-money, and reward-ratio. Depending on which value is changed. All values in the columns are editable. Also, we can get those calculation results by drag-drop the stop-loss/take-profit line. Parameter: The inputs below ar
      Mini FFMV Dashboard and CSM
      Opengates Success International
      1 (1)
      Mini Forex Market-View Dashboard and Mini-CSM Mini Full Forex Market View Dashboard is a miniature creation of FULL FOREX MARKET_VIEW Custom indicator created to give the Traders a full view of what is going on in the market but in a partial matter to make it conscise. It is useful most especially for those who don't like bogus indicators or those who have a PC with limited screen size. It uses a real time data to access the market and display every bit of information needed to make a successful
      为您介绍MQL4的Donchian通道指标,这是一个强大的技术分析工具,旨在提升您的交易成功率。该指标由四条线组成,代表了在指定时期内价格运动的上限和下限。 通过Donchian通道指标,您可以轻松识别市场潜在的突破和反转。上线显示指定时期内的最高点,而下线代表最低点。这两条线之间的空间形成一个通道,为您提供了有关资产交易价格范围的有价值见解。 但这还不是全部 - 我们进一步改进了这个令人难以置信的指标。我们的修改允许您按照一定百分比(表示为'shadowTop'和'shadowBottom')减小通道宽度。通过缩小通道,您可以更敏锐地感知价格波动,并准确定位入场和出场点。 无论您是经验丰富的交易者还是初学者,带有减小通道宽度的Donchian通道指标都是您交易工具箱中必备的工具。它能够让您基于市场波动和价格行为做出明智的决策。 不要错过将您的交易推向新高度的机会。体验带有减小通道宽度的Donchian通道指标的强大功能,释放您的交易潜力吧。
      DYJ BoS MT4 指标:智能识别市场结构变动 DYJ BoS MT4 指标   旨在自动检测并标记市场结构的重要变化,包括:   结构突破(BoS):   当价格发生重大波动,突破之前的结构点时,即检测到 BoS 事件。   趋势线突破确认: 指标会标记   可能的上升趋势线(UP)和下降趋势线(DN) ,表示持续创新高或创新低的走势。 当价格突破这些趋势线时,触发   红色(BEAR)和绿色(BULL)箭头 ,提示可能的趋势变化。 BoS 如何运作? BoS 事件   发生在价格   决定性突破之前的波动高点或低点   时,从而打破原有的市场结构:   突破前高 ,意味着市场可能进入   看涨趋势 。   跌破前低 ,可能暗示市场进入   看跌趋势 。 这一现象通常意味着   趋势的延续或新趋势的形成 ,帮助交易者更好地把握市场情绪变化。 交易管理策略 为了   提升准确性 ,建议:   初始交易时不设止损(SL)和止盈(TP) ,而是在   相同方向的下一个突破点   进行平仓。 或者, 当反方向出现 BoS 信号   时,及时止盈或止损。 对于有
      CYCLE WAVE OSCILLATOR indicator is an indicator based on cyclical price fluctuations. This indicator can help you determine overbought and oversold levels, and help you predict price trends within the cycle. MT5 Version here!  You can combine it with our indicators below to make your trading decisions more accurate: Supply Demand Ribbon MT4 Basic Feature: - Three Trend Types: + Zero + Basic + Advanced
      FREE
      ZoneDominator AI
      Mohammad Ziad Abdelwahed Alkahlah
      ZoneDominator AI — Adaptive Multi-Timeframe Support & Resistance Indicator Overview ZoneDominator AI is an advanced analytical indicator that continuously scans all timeframes to locate the most accurate and relevant Support & Resistance zones. It uses a unique combination of ATR volatility, Moving Averages, Price Action, and higher-timeframe confirmation to adapt in real time to market structure. You can choose your preferred trading style — Scalping, Intraday, or Swing — and the indicat
      该智能交易系统不进行任何交易,但它会扫描您的市场观察中的整个交易品种,并在不同的时间范围内逐一扫描每个股票,最后它会向您显示哪个交易品种在哪个时间范围内具有强大的吞没蜡烛。 此外,您可以定义 MA 周期和 RSI 上限和下限,它会显示哪个时间范围内的交易品种将穿越调整后的移动平均线,以及哪个时间范围内的交易品种将穿越移动平均线的上限或下限。 相对强弱指数。 Gāi zhìnéng jiāoyì xìtǒng bù jìnxíng rènhé jiāoyì, dàn tā huì sǎomiáo nín de shìchǎng guānchá zhōng de zhěnggè jiāoyì pǐnzhǒng, bìng zài bùtóng de shíjiān fànwéi nèi zhúyī sǎomiáo měi gè gǔpiào, zuìhòu tā huì xiàng nín xiǎnshì nǎge jiāoyì pǐnzhǒng zài nǎge shíjiān fànwéi nèi jùyǒu qiángdà de tūnmò làzhú. Cǐwài, nín
      FREE
      High Low Predict
      Thomas Bradley Butler
      This indicator is designed to help you forecast the potential high and low prices for the current trading day, based on the high and low of the previous day. It does this by applying a customizable percentage increase or decrease to those levels. How It Works: The idea is simple: It looks at the previous day's high and low prices and then adjusts them by a percentage you choose. Here's what that means: Predicted High: This is calculated by taking the high price of the previous day and adding a p
      TRENDIEST TREND LINE   ️️️️️ Do you want to become a constantly profitable 5-star forex trader? ️️️️️ Trendiest Trend Line is a one of a kind trend line indicator, Trend lines work until the market reverses or consolidates. Easily stay out of the chop and stay in the long trends! Key Features of Trendiest Trend Line Stay in strong trends longer with confidence Clearly shows you when the market is ranging to save you money Entry signals help you get in at a good price 100% reliable re
      這個獨特的自動趨勢線繪製指示器可在所有時間範圍內運行,可幫助您輕鬆交易短期趨勢反轉以及短期趨勢突破,表明市場上的資產更雄厚。 它獨特地使您可以儘早進入沉重的揮桿動作。 輸入包括: -Max Candles回顧趨勢線 -線型和顏色 -到外帶和帶週期的最大距離 -當確認蠟燭或價格收盤時,自動重新繪製趨勢線偏離樞軸的選項較低,較低或較高的高位(雙底低位和高支撐位)和最大蠟燭數以進行重新繪製。 -4個換行選項: 1)價格跌破線時刪除 2)不要刪除 3)燭線超出界限時刪除 4)在趨勢關閉時刪除 This unique auto trend line drawing indicator works on all time frames which can help you to easily trade short term trend reversals as well as  as well as short term trend breakouts indicating the stronger asset in the market. It uniquely allows you to
      Breakout Box
      Claus Dietrich
      4.33 (24)
      BREAKOUT-SESSION-BOX LONDON EU US ASIA Open watch the expectation of a volatile movement above or under the opening range We take the high of the range as Entry for a long trade and SL will be the low of the range and vice versa the low of the range as Entry for a short trade and the high for SL The size of the range is the distance to the TP (Take Profit) The range of the opening hours should not be larger than about 1/3 of the average daily range 4 breakout examples are already predefined: A
      FREE
      Chart patterns scanner
      Jan Flodin
      4.67 (6)
      这个多时间框架和多品种指标识别双顶/底,头     &     肩膀、三角旗/三角形和旗形图案。也可以仅在颈线/三角形/旗杆突破发生时设置警报(颈线突破 = 顶部/底部和头肩的确认信号)。 该指标也可用于单一图表模式。请在产品的     博客 。     结合您自己的规则和技术,该指标将允许您创建(或增强)您自己的强大系统。 特征 可以同时监控您的市场报价窗口中可见的所有交易品种。将该指标仅应用于一张图表,并立即监控整个市场。 可以监控从 M1 到 MN 的每个时间范围,并在模式被识别或颈线突破(顶部/底部和头肩)时向您发送实时警报。 支持所有 Metatrader 原生警报类型。 可以使用 RSI 作为趋势过滤器来正确识别潜在的逆转。 该指示器包括一个交互式面板。当单击一个项目时,将打开一个带有相关代码和时间范围的新图表。 该指标将信号写入一个文本文件,智能交易系统 (EA) 可以使用该文件进行自动交易。比如 这个产品 。您可以在     博客 。 输入参数 输入参数的描述和解释可以在 这里 找到。 重要的 请注意,由于具有多功能性,既不会在安装指标的图表上绘制买卖建议,也不会绘制线
      Special Agent
      Vitalii Zakharuk
      The advantage of working on the Special Agent signal indicator is that the trader does not need to independently conduct a technical analysis of the chart. Determining the market trend is an important task for traders, and the tool gives ready-made signals in the form of directional arrows. This tool is an arrow (signal). Special Agent is a trend indicator, a technical analysis tool that helps to determine the exact direction of the trend: either up or down price movement for a trading pair of
      Similar to logic used in: Golden MA MTF TT   Overview "Golden MA" indicator for OB/OS levels. It's based on High/Lows of higher timeframe (HTF) previous bar. Only useful in swing trading or scalping. Best for at least M15+. For lower timeframes you'll need to change StartPips to lower value to get consistent lines. Because lower timeframes will have smaller pip distances.   Features - Define Higher Timeframes for Current Timeframe: Use a comma-separated list to define the higher timeframe for th
      FREE
      Super Ichi
      Sinan Durkan
      What is the Super Ichi Indicator? Super Ichi is an advanced combination of Ichimoku Kinko Hyo and SuperTrend indicators. This powerful technical analysis tool is designed to identify market trends and generate trading signals. What Does It Do? Dual-Level Trend Analysis : Uses customized versions of Tenkan-sen and Kijun-sen lines Automatic Signal Generation : Displays visual markers (arrows) at crossover points Real-Time Alert System : Provides audio and visual alerts when new signals occur Dynam
      FREE
      Rira VWAP Bands
      Vitor Palmeira Abbehusen
      VWAP Bands gives you the regular Volume-Weighted Average Price and also the deviation bands. Use this indicator to see the possible amount of market movement, find support and resistance lines, find good spots for entry and exit,  and the most important feature is to find possible pivot points. This indicator has been mathematically improved by Rira team. The calculation begins at the start of each trading day
      Boost binary option profesional
      Sebastian Alejandro Merino Sepulveda
      Binarias & Forex (+90% Ratio-Win Next Candle) Espere que el precio llegue a una buena zona (fuerte) sea soporte, resistencia, zona de oferta o demanda, fibonacci level key, cifra redonda. Haciendo lo anterior definitivamente habrá una reversión en el precio y obtendrá su ITM en primera vela dando una efectividad del 100% siguiendo la tendencia. Es muy importante estar atento a las noticias fundamentales en el mercado y estas no afecten tu trading. Sesiones comerciales: cualquiera (24 horas).
      Dictator
      Vitalii Zakharuk
      The Dictator indicator is based on the process of detecting the rate of change in price growth and allows you to find points of entry and exit from the market. a fundamental technical indicator that allows you to assess the current market situation in order to enter the market of the selected currency pair in a trend and with minimal risk. It was created on the basis of the original indicators of the search for extremes, the indicator is well suited for detecting a reversal or a large sharp jer
      KT Tether Line MT4
      KEENBASE SOFTWARE SOLUTIONS
      The KT Tether Line is a trend-following tool consisting of three indicators that work together to generate trading signals. It can correctly identify market trends while signaling trade entries. It was first introduced by Bryan Strain in the Stock & Commodities magazine in 2000 in "How to get with the trend and out at the end." The Concept When a market trend is confirmed, the most challenging part is determining the timing of the entries. This indicator alerts you to potential trend reversals
      KT Displaced Moving Averages MT4
      KEENBASE SOFTWARE SOLUTIONS
      KT DMA is a modified and advanced version of the classic Displaced Moving Averages with buy/sell crossover alerts and a Multi-Timeframe scanner that shows DMA's direction across each real-time time frame. A Displaced Moving Average is a simple moving average that moves ahead or backward in a time frame (either short-term or long-term). It also allows you to predict price movement more accurately. Features Depicts the trend direction using the alignment of three moving averages. Buy/Sell signals
      Heikin Ashi Smoothed – MT4指标 Heikin Ashi Smoothed 是一款适用于 MetaTrader 4 (MT4) 的自定义指标,在传统的平均线蜡烛图基础上,通过加入额外的移动平均平滑处理,让趋势显示更加平滑直观。该方法极大减少了图表噪音,使得主趋势和可能的反转信号更加清晰,有助于把握市场方向。 主要特点 在图表上显示经过进一步平滑处理的 Heikin Ashi(平均足)K线,更清晰地反映价格走势 有效过滤小幅波动与虚假信号,趋势一目了然 更容易识别趋势反转,帮助避免因市场噪音导致的多余交易 适用于所有时间周期和任何品种(包括外汇、CFD、指数等) 计算轻巧高效,可在多图表、多周期下流畅运行 原理说明 Heikin Ashi Smoothed 首先计算标准的平均足四价(开盘、高点、低点、收盘),然后在此基础上再应用移动平均(如SMA或EMA)进行二次平滑处理。最终在图表上展现出极其平滑的K线,使细小波动被最大限度压制,主趋势方向更加明显。 通过不同的颜色和形状,趋势方向和强度一目了然,有助于持仓信心和避免因短期回调而频繁操作。 适用对象 采用趋势跟随
      FREE
      Waddah Attar Explosion MT4
      Do Thi Phuong Anh
      5 (1)
      The Waddah Attar Explosion (WAE) indicator is a potent tool in Forex trading, offering buy, sell, exit buy, and exit sell signals. It assesses trends as trend power and momentum as explosion power. Trend Direction: - Green bars indicate a bullish trend. - Red bars indicate a bearish trend. Signal Line: - A line serves as a threshold for momentum. Buy Trade Setup: **Entry:** Go long when a green bar crosses above the threshold. Place a stop loss below the entry candle. **Exit:** Close the tra
      Trendy Stocks for MT4
      Innovicient Limited
      Trendy Stock is a price following indicator that uses Stochastic to show when the price is out of the oversold or overbought areas.  The algorithm allows you to stay longer in a trend where the bulls or bears are in control. The indicator changes color immediately the price exits oversold/overbought state. In short, the downtrend [red] bars start to paint when the buying pressure decreases while the uptrend [green] bars form as the buy pressure kicks in.  For MT5 version, follow ::     https://w
      FREE
      这个多时间框架和多品种指标扫描吞没和镊子形态。 特征 可以同时监控您的市场报价窗口中可见的所有交易品种。将该指标仅应用于一张图表,并立即监控整个市场。 监控从 M1 到 MN 的每个时间范围,并在识别出吞没或镊子形成时向您发送实时警报。支持所有 Metatrader 原生警报类型。 使用 RSI 作为趋势过滤器,以正确识别潜在的逆转。 该指示器包括一个交互式面板。请参阅单独的屏幕截图。 输入参数 输入参数的描述和解释可以在 这里 找到。 重要的 我强烈建议将指标放在干净(空)的图表上,上面没有任何其他可能干扰扫描仪的指标。另请注意,由于具有多功能性,图表上不会绘制买入/卖出建议或线条和箭头。 我强烈建议将指标放在干净(空)的图表上,上面没有任何其他可能干扰扫描仪的指标。另请注意,由于具有多功能性,图表上不会绘制买入/卖出建议或线条和箭头。
      该产品的买家也购买
      Gann Made Easy
      Oleg Rodin
      4.83 (162)
      Gann Made Easy 是一个专业且易于使用的外汇交易系统,它基于使用先生理论的最佳交易原则。 W.D.江恩。该指标提供准确的买入和卖出信号,包括止损和获利水平。您甚至可以使用推送通知在旅途中进行交易。 购买后请联系我,即可免费获得交易指导和超棒的额外指标! 您可能已经多次听说过江恩交易方法。通常 Gann 的理论不仅对于新手交易者而且对于那些已经有一定交易经验的人来说都是非常复杂的东西。这是因为江恩的交易方法在理论上并不那么容易应用。我花了几年时间来完善这些知识,并将最好的原则应用到我的外汇指标中。 该指标非常易于应用。您所需要的只是将其附加到您的图表并遵循简单的交易建议。该指标不断进行市场分析工作并寻找交易机会。当它检测到一个好的入口点时,它会为您提供一个箭头信号。该指标还显示止损和获利水平。 换句话说,当您像先生一样进行交易时,该指标会为您提供最佳江恩建议。江恩亲自告诉你此时此刻该做什么。但最好的部分是您不需要了解任何有关江恩交易原则的知识,因为该指标会为您完成整个市场分析工作。
      M1 Sniper
      Oleg Rodin
      5 (22)
      M1 SNIPER 是一款易于使用的交易指标系统。它是一个专为 M1 时间框架设计的箭头指标。该指标可以作为独立的系统在 M1 时间框架下进行剥头皮交易,也可以作为您现有交易系统的一部分使用。虽然该交易系统专为 M1 时间框架交易而设计,但它也可以用于其他时间框架。我最初设计此方法是为了交易 XAUUSD 和 BTCUSD。但我发现这种方法在其他市场交易中也同样有用。 指标信号既可以顺势交易,也可以逆势交易。我教授一种特殊的交易技巧,帮助您利用指标信号进行双向交易。该方法基于使用特殊的动态支撑位和阻力位区域。 购买后,您可以立即下载 M1 SNIPER 箭头指标。此外,我还为所有 M1 SNIPER 工具用户免费提供下方屏幕截图所示的 Apollo Dynamic SR 指标!这两个指标的组合可以帮助您更轻松、更准确地利用 M1 时间框架进行交易。 购买后请联系我,免费获取交易提示和奖励指标! 祝您交易成功!
      Auto Optimized Parabolic RSI: 高级 3D 动量引擎 大多数零售指标之所以失效,是因为它们依赖于静态输入,一旦市场波动率发生变化,这些输入就会崩溃。Auto Optimized Parabolic RSI 通过不断重新计算自身的数学优势,解决了“指标衰退”的问题,将机构级别的量化自适应能力直接引入您的 MT5 终端。 核心优势:定制的内存 3D 优化   标准的自动优化器通常会导致 MT5 平台卡顿,因为它们通过标准的指标调用使终端超载。该工具完全绕过了这些性能瓶颈。内部引擎采用定制的原生基于 RAM 的计算器构建,每次加载图表或更改时间周期时,它都会执行极速的 3D 网格搜索。它同时扫描 RSI 周期(频率)、SAR 步长(加速度)和 SAR 最大值(速度限制),在绝对的毫秒级时间内测试数以万计的参数组合,且完全不会拖慢您的平台。它不是仅仅寻找一个“不错”的设置,而是映射整个参数空间,以寻找资产当前动量结构的绝对全局最大值。 严格的财务评分与逼真的交易模拟   与基于抽象“指标点数”进行优化评分的业余工具不同,该引擎的 3.10 版本严格与资金数学挂钩。每
      PZ Harmonacci Patterns
      PZ TRADING SLU
      3.17 (6)
      可以说,这是您可以为MetaTrader平台找到的最完整的谐波价格形成自动识别指标。它检测19种不同的模式,像您一样认真对待斐波那契投影,显示潜在的反转区域(PRZ),并找到合适的止损和获利水平。 [ 安装指南 | 更新指南 | 故障排除 | 常见问题 | 所有产品 ] 它检测19种不同的谐波价格形态 它绘制了主要,衍生和互补的斐波那契投影(PRZ) 它评估过去的价格走势并显示每个过去的形态 该指标分析其自身的质量和性能 它显示合适的止损和获利水平 它使用突破来表明合适的交易 它在图表上绘制所有样式比率 它实现了电子邮件/声音/视觉警报 受斯科特·M·卡尼(Scott M. Carney)的书的启发,该指标旨在满足最纯粹和最熟练的交易者的需求。但是,它采取了一种使交易更容易的方式:在向交易发出信号之前,它会等待Donchian朝正确方向突破,从而使交易信号非常可靠。 斐波那契投影与向量无关 它实现了电子邮件/声音/推送警报 它绘制了ABCD投影 重要提示: 为了符合 Scott M. Carney先生 的商标申诉,某些图案名称已重命名为不言自明的替代方式, Scott M.
      Scalper Inside PRO
      Alexey Minkov
      4.74 (69)
      Scalper Inside PRO – Since 2020. An exclusive indicator that utilizes an innovative algorithm to swiftly and accurately determine the market trend. The indicator automatically calculates opening, closing, and profit levels, providing detailed trading statistics. With these features, you can choose the most appropriate trading instrument for the current market conditions. Additionally, you can easily integrate your own arrow indicators into Scalper Inside Pro to quickly evaluate their statistics
      PRO Renko System
      Oleg Rodin
      5 (30)
      PRO Renko Arrow Based System for trading renko charts.  准确的信号交易任何外汇工具. 另外,我将免费提供系统的附加模块! PRO Renko系统是RENKO图表上高度准确的交易系统。该系统是通用的。 该交易系统可应用于各种交易工具。 该系统有效地中和了所谓的市场噪音,打开了获得准确反转信号的通道。 该指标易于使用,只有一个参数负责产生信号。 您可以很容易地使算法适应您感兴趣的交易工具和renko酒吧的大小。 我很乐意通过提供任何咨询支持来帮助所有客户有效地使用该指标。 祝您交易成功!购买后,立即写信给我! 我将与您分享我的建议和我的renko发电机。 另外,我将免费提供系统的附加模块!
      Quantum Breakout Indicator PRO
      Bogdan Ion Puscasu
      4.96 (26)
      介绍     Quantum Breakout PRO   ,突破性的 MQL5 指标,正在改变您交易突破区域的方式!   Quantum Breakout PRO 由拥有超过 13 年交易经验的经验丰富的交易者团队开发,旨在通过其创新和动态的突破区域策略将您的交易之旅推向新的高度。 量子突破指标将为您提供带有 5 个利润目标区域的突破区域的信号箭头,以及基于突破框的止损建议。 它既适合新手交易者,也适合专业交易者。 量子 EA 通道:       点击这里 MT5版本:   点击这里 重要的!购买后请私信我领取安装手册。 建议: 时间范围:M15 货币对:GBPJPY、EURJPY、USDJPY、NZDUSD、XAUUSD 账户类型:ECN、Raw 或 Razor,点差极低 经纪商时间:GMT +3 经纪商:IC Markets、Pepperstone with Raw 和 Razor 的点差最低 规格: 不重漆! 最多 5 个建议利润目标区域 建议止损水平 可定制的盒子。您可以设置自己的 Box Time Start 和 Box Time End。 接触 如果您
      The Propfolio Master Suite is the ultimate all-in-one analytical workstation for professional traders. Combining the power of the Beat The Market Maker (BTMM) methodology, Smart Money Concepts (SND/Liquidity), and Advanced Volume Profile, this suite replaces multiple different indicators with one optimized engine. Monitor up to 14 pairs simultaneously from a single chart, instantly identify market cycles, and seamlessly map institutional footprints with the click of a button. The Command Center
      购买此指标即可免费获得我的专业交易管理器。 首先,值得强调的是,这个交易系统是一个非重绘、非重画和非滞后的指标,这使得它非常适合手动和机器人交易。 在线课程,手册和下载预设。 “智能趋势交易系统 MT5”是专为新手和经验丰富的交易者量身定制的综合交易解决方案。它结合了超过 10 个优质指标,具有 7 多个强大的交易策略,使其成为适用于各种市场条件的多功能选择。 趋势跟随策略:提供精确的入场和止损管理,以有效地跟随趋势。 反转策略:识别潜在的趋势反转,使交易者能够利用区域市场的机会。 剃头策略:专为快速准确的日内交易和短期交易而设计。 稳定性:所有指标都不会重绘、不会重画和不会滞后,确保可靠的信号。 定制:支持自定义策略,以满足个人交易偏好。超过 7 种策略和组合可帮助您找到最佳策略。 信号清晰度:提供箭头信号,以指示清晰的入场和退出点。 实时警报:通过交易进出警报使交易者保持了解。 深入分析:提供更高时间框架的趋势分析和实时交易监控。 自适应颜色编码:利用蜡烛颜色编码来显示成交量、趋势和反转蜡烛信号。通过蜡烛颜色分析市场方向。 “智能趋势交易系统 MT5”赋予交易者必要的工具,以便在
      Please send me Direct message on MQL5 CHAT after purchasing the Indicator for Training and Installation Support There are some additional files that is important to use with the Indicator . So be sure to contact me after purchasing the Indicator So that I can add you for training and support . If you find any difficulty with installation then send me Direct message here So that I can connect with you via Anydesk or Teamview for the product installation. " Smart Order Block Indicator " to find m
      GoldRush Trend Arrow Signal
      Kirk Lee Holloway
      5 (2)
      GoldRush 趨勢箭頭信號 GoldRush 趨勢箭頭信號 指標為 XAU/USD 中的高速、短期短線交易者提供精確、實時的趨勢分析。 專為1分鐘時間框架設計,此工具顯示方向箭頭以明確顯示入場點,使短線交易者能在波動市場中自信操作。 該指標包含主要和次要警示箭頭。主要信號為白色和黑色方向箭頭,用於指示趨勢方向的轉變;次要信號為藍色和紅色箭頭,用於確認主要箭頭指示的方向並提示潛在交易入場點。 注意:當趨勢方向發生變化後僅出現一個主要警報箭頭時,請注意可能會出現多個次要藍/紅箭頭。次要信號將在滿足信號標準的任何蠟燭圖後出現,因此在長期趨勢移動中,螢幕上將顯示大量次要箭頭(如附帶的截圖所示)。您可在設置中開啟或關閉任一箭頭類型。 以下是我使用此指標進行交易的方式: - 對於買入入場,我會耐心等待白箭頭在蠟燭收盤時出現,並在下一根可用蠟燭收盤時出現藍箭頭時進行買入交易。 - 對於賣出入場,我會耐心等待黑箭頭在蠟燭收盤時出現,並在下一根可用蠟燭收盤時出現紅箭頭時進行賣出交易。 - 獲利了結/止損設置由使用者自行負責,但我個人使用最低R:R為1:2,並發現這在倫敦/紐約開盤等
      Day Trader Master
      Oleg Rodin
      5 (15)
      Day Trader Master 是一个完整的日间交易者交易系统。该系统由两个指标组成。一个指标是买入和卖出的箭头信号。这是你得到的箭头指示器。我将免费为您提供第二个指标。第二个指标是专门设计用于与这些箭头结合使用的趋势指标。 指标不重复也不迟到! 使用这个系统非常简单。您只需按照当前趋势方向的箭头信号,显示为双色线。蓝色是买入趋势。红色是一种销售趋势。蓝色箭头是买入信号。红色箭头是卖出信号。您需要箭头的颜色和信号的方向来匹配趋势线的颜色。 箭头指标主要是为 M5 和 M15 时间间隔的日内交易而创建的。但从技术上讲,该系统可以用于其他时间间隔。 指示器配备带有推送消息功能的弹出警报。 购买后一定要写信给我!我将为您提供与系统交易的个人建议,以及我的趋势指标。此外,还有丰厚的奖励等着您!
      Market Makers
      Mohamed Hassan
      5 (4)
      After purchase, contact me privately to receive 1 month of free testing with EA Forex Proton! This advanced MT4 trading robot automatically executes signals from any MT4 indicator, including Market Makers. The latest version also includes AI integration, allowing each trade signal to be analyzed using Artificial Intelligence. Live Signal with EA Forex Proton: Click here Market Makers is a powerful price action trading system designed to identify high-probability Buy and Sell opportunities based
      Apollo SR Master
      Oleg Rodin
      5 (2)
      Apollo SR Master 是一款支撑/阻力指标,其特殊功能使利用支撑/阻力区域进行交易更加便捷可靠。该指标通过检测局部价格顶部和底部,实时计算支撑/阻力区域,没有任何时间延迟。为了确认新形成的支撑/阻力区域,该指标会显示特殊信号,表明该支撑/阻力区域可以作为实际的卖出或买入信号。在这种情况下,支撑/阻力区域的强度会增强,因此从该区域进行交易的成功率也会更高。这正是该指标的核心理念。 SR区域也使止损和止盈的操作更加便捷。根据信号方向,可以将SR区域上方或下方的空间用作止损位。此外,相对的SR区域也可以用作潜在的止盈区域。 我还免费向所有 Apollo SR Master 指标的用户提供我的“Apollo 价格行为系统”指标。这两个指标结合使用将帮助您找到更好的入场点。 购买后请联系我,即可免费获得我的交易技巧以及我的“阿波罗价格行为系统”指标作为赠品!
      PZ Trend Trading
      PZ TRADING SLU
      4.8 (5)
      许多盈利交易者不仅知道如何识别市场趋势,而且也能把握趋势建立后的交易机会。 Pz 趋势交易 指标设计用来在趋势行情中尽可能的赚取利润。 已建立的趋势提供了一揽子交易机会,但大多数趋势交易指标完全忽视了它们,让交易者在趋势行情时完全不知道该如何做!一般趋势指标只通知有关的趋势变化,但根本不足以得到卓越的回报. Pz 趋势交易 指标比一般趋势指标显示多达 20 倍的交易 , 因为它注重所谓的市场时机。它不仅显示当前的市场趋势,也有回调,内柱线的突破和调整。它令您在趋势回调之后介入,安全的柱线内突破金字塔加仓,以及发现潜在的反转,和已知的调整。 趋势改变 一个趋势改变在市场方向变化时发生。趋势变化在图表上用带数字的彩色圆圈显示。蓝色 (1) 信号为上涨开始, 而红色 (1) 信号为下跌开始。趋势变化并非评估当前价格动作的结果, 它意味着交易设置是不定时地。如果您正确使用本指标, 在趋势变化时, 您将将已经入场 (参看下面的调整)。 回调 但凡趋势在运动中,行情上下抖动,盈利者收割利润,且其它参与者入场。趋势回调代表好的买入机会,通常是由主力获利离场导致。如果行情在回调后回归上行, 指标将
      GOLD Impulse with Alert
      Bernhard Schweigert
      4.67 (12)
      这个指标是我们2个产品 Advanced Currency IMPULSE with ALERT  +   Currency Strength Exotics 的一个超级组合。 它适用于所有时间框架,并以图形方式显示8种主要货币和一种符号的强势或弱势冲动! 该指标专门用于显示任何符号的货币强度加速,如黄金、异国货币对、商品、指数或期货。这是它的第一个指标,任何符号都可以被添加到第9行,以显示黄金、白银、石油、DAX、US30、MXN、TRY、CNH等的真实货币强度加速(冲动或速度)。 建立在新的基础算法上,它使识别和确认潜在的交易更加容易。这是因为它以图形方式显示了一种货币的强势或弱势是否正在加速,并测量了这种加速的速度--把它想象成你汽车中的速度表。当你加速时,事情显然会发生得更快,这在外汇市场上也是一样的,即如果你配对的货币正在向相反的方向加速,你就会发现一个潜在的有利可图的交易。 动态市场斐波那契28水平被用作警报触发器,将适应市场活动。如果冲动击中黄色触发线,你将收到警报。然后你就知道作为一个交易员应该做什么。货币对和方向已经给出。只需点击警报按钮,就可以切换到该货
      Market Structure Patterns MT4
      Samuel Manoel De Souza
      5 (18)
      Market Structure Patterns   is an indicator based on   smart money concepts   that displays   SMC/ICT   elements that can take your trading decisions to the next level. Take advantage of the   alerts ,   push notifications   and   email messages   to keep informed from when an element is formed on the chart, the price crosses a level and/or enters in a box/zone. Developers can access the values of the elements of the indicator using the   global variables  what allows the automation of trading d
      Advanced Supply Demand
      Bernhard Schweigert
      4.91 (300)
      现在优惠 40%! 任何新手或专业交易者的最佳解决方案! 该指标是一款独特、高质量、且价格合理的交易工具,因为我们已经整合了许多专有功能和新公式。 依据此更新,您将能够显示双重时间帧区域。 您不仅可以显示一个较高的时间帧,还可以同时显示图表时间帧,加上更高的时间帧:显示嵌套时区。 供需双方所有交易者都会喜欢它。 :) 重要信息披露 高级供需的最大潜力,请访问 https://www.mql5.com/zh/blogs/post/720245   想象您的交易如何得以改善,是因为您能够精准定位入场或目标位吗? 构建于新的底层算法,它可以更轻松地识别出买卖双方之间的潜在失衡。 这是因为它以图形方式展示供需最强劲区域,及其过去的表现(显示旧区域)。 这些功能旨在帮助您更轻松地发现最佳入场区域和价位。 现在您可以针对您的交易品种和时间帧来优化和编辑区域强度! 高级供需指标适用于所有产品和时间帧。 它是一个新的公式,非常新的功能是两个区域强度函数可由用户输入进行调整! 这在交易中是一大优势。 当您学习如何使用专有功能,例如带有价格游离最小 X 因子的区域强度时,您能够判断该区域强劲与否。 供需
      CRT Candle Range Theory HTF MT4.   Ultimate CRT Indicator: Advanced ICT Concepts and Malaysian SnR Trading System Discounted   Price   $50  !!     Secure your lifetime access   now   before it switches to   subscription-only ! Master the Market Maker's Footprints with the Most Advanced Candle Range Theory Indicator Unlock the true power of   Smart Money Concepts (SMC)   and trade precisely like the institutions with the   Ultimate CRT Indicator . Built exclusively for serious traders, this indic
      PZ Turning Points MT4
      PZ TRADING SLU
      1 (1)
      该指标检查不同时期分形的价格结构,以确定市场中可能的反转点,从而为已经具有基本或技术估值模型的仓位交易者提供时机。与它的弟弟 Reversal Fractals不同 ,该指标不会因为所选时期而错过反转,并且会以之字形方式找到反转分形,而忽略那些没有足够动量来引发持续价格波动的反转。 [ 安装指南 | 更新指南 | 故障排除 | 常见问题 | 所有产品 ] 转折点可以开始长期趋势 指示器不重涂 它实现了各种警报 可自定义的颜色和尺寸 该指示符是无功或滞后信号,因为分形是奇数个条形的地层,是中间地带中最高或最低的条形,并且指示符在分形中的所有条形都闭合时绘制。但是,具有预先设定的方向偏差的交易者会发现该指标非常有用,可以提早进入切入点。 该指标既不是下探信号指标,也不是完整的交易系统。请不要这样评价或审查它。 输入参数 最小分形数:分形上的最小条形数。必须为奇数,例如3、5、7、9、11、13,... 最大分形:分形上的最大条形数量。必须为奇数,例如3、5、7、9、11、13 ... 最大历史柱数:指标加载时评估的过去柱数。 颜色:自定义箭头和线条的颜色和大小。 警报:启用或禁用各
      PZ Support Resistance
      PZ TRADING SLU
      3.33 (3)
      厌倦了绘制支撑线和阻力线? 支撑阻力 是一个多时间指标,可以自动检测并绘制图表中的支撑线和阻力线,并具有非常有趣的变化:随着时间的推移测试价格水平及其重要性的提高,线变得越来越粗。 [ 安装指南 | 更新指南 | 故障排除 | 常见问题 | 所有产品 ] 一夜之间增强您的技术分析 无需浏览图表即可检测重要的价格水平 一目了然地识别所有价格水平的相对优势 每次交易最多可节省半小时的绘图线 指标显示所有价格水平的期限 指示器不重涂 过去和现在的价格水平因接近程度而崩溃,并根据当前的市场行为进行了调整。在动作发生的地方绘制了线条,而不一定在峰值处绘制了线条。 价格水平随着时间的推移而被拒绝,变得越来越暗 定期清除不重要的价格水平以避免噪音 可自定义的时间范围选择和崩溃因子 它实现了电子邮件/声音/推送警报的突破 输入参数 指标设置:指标将从当前时间段读取价格,但您可以选择另一个。例如,您可以在H4图表中显示D1支撑线和阻力线。您还可以使用 价格水平密度 参数选择在图表上显示多少价格水平。 颜色设置:根据重要性输入所需的支撑线和阻力线颜色。 标签设置:(可选)可以在指示器中显示用于
      Dynamic Scalper System
      Vitalyi Belyh
      5 (1)
      “ Dynamic Scalper System ”指标专为在趋势波内进行剥头皮交易而设计。 已在主要货币对和黄金上进行测试,并可与其他交易工具兼容。 提供顺势短线建仓信号,并提供额外的价格变动支持。 指标原理: 大箭头决定趋势方向。 在趋势波内,我们采用一种生成小箭头形式的剥头皮交易信号的算法。 红色箭头代表看涨方向,蓝色箭头代表看跌方向。 敏感的价格变动线会沿着趋势方向绘制,并与小箭头信号协同作用。 信号运作方式如下:当线在适当时刻出现时,将形成入场信号;在出现线时,持仓;线完成后,平仓。 建议的操作时间范围为M1 - H4。 箭头在当前K线上方形成,如果下一根K线已开仓,则不会重新绘制上一根K线上方的箭头。 输入参数 Trend Wave Period - 趋势方向(大箭头)的周期,改变趋势波的时间间隔。值 1 表示趋势方向的最长持续时间,参数值越大,持续时间越短。 Scalper Arrows Period - 信号箭头(小箭头)的计算周期,改变入场信号的生成频率。值 3 表示最频繁的生成频率,参数值越大,箭头频率越低,准确度越高。 这些参数可以根据不同的时间范
      They say history repeats itself. What if you could prove it in real-time? The Propfolio Ghost Pattern is an advanced algorithmic pattern-matching engine. It empowers you to select any current price action structure on your chart and instantly scan thousands of historical candles to find the exact moment in the past where the market did the exact same thing. Once it finds the highest probability match, it projects the historical outcome into the future as "Ghost Candles"—giving you a highly calcu
      Atomic Analyst
      Issam Kassas
      5 (5)
      首先值得强调的是,该交易指标是非重绘、非延迟的指标,这使其成为手动和机器人交易的理想选择。 用户手册:设置、输入和策略。 Atomic Analyst是一种PA价格行动指标,利用价格的力量和动量来寻找市场上更好的机会。配备了高级过滤器,可帮助去除噪音和假信号,并提高交易潜力。使用多层复杂的指标,Atomic Analyst扫描图表,并将复杂的数学计算转化为任何初学者都能理解并用来做出一致交易决策的简单信号和颜色。 “Atomic Analyst”是专为新手和经验丰富的交易者量身定制的综合交易解决方案。它将高级指标和一流功能融合为一体的交易策略,使其成为所有类型交易者的多功能选择。 日内交易和剥头皮策略:专为快速准确的日内交易和短期交易而设计。 日内和摆动交易策略:可用作追求价格大幅波动的日内和摆动交易者的可靠工具。 多货币和市场:凭借其可靠的精度,在不同的工具和市场上运作。 多个时间框架:可在多个时间框架上使用,性能良好。 稳定性:所有指标均不重绘、不重绘和不滞后,确保可靠的信号。 信号清晰度:提供箭头信号,用于清晰的入场和出场点。 实时警报:通过交易入场、SL和TP警报通知交易者
      目前有26%的折扣!! 这个指标是我们两个主要指标( Advanced Currency Strength 28   &  Advanced Currency IMPULSE with ALERT )的一个超级组合。它显示了28个外汇对的TICK-UNITS货币强度值和警报信号。可以使用11种不同的Tick-Units。它们是1、2、3、4、5、6、10、12、15、20和30秒。子窗口中的Tick-Unit栏将被显示并向左移动,当在一秒钟的定时器中至少有一个Tick。 只用一个图表,你就可以剥28个外汇货币对的头皮!想象一下,你的剥头皮将如何提高。想象一下,你的剥头皮将如何改善,因为你能够准确地确定剥头皮机会的触发点? 这是市场上第一个在比1分钟更短的时间内工作的货币强度指标! 它是为那些希望快速进出并从市场中切出小点数的快速剥头皮者准备的。 用户手册:点击这里 https://www.mql5.com/en/blogs/post/727178 特点。 为28个货币对提供嘀嗒单位的卖出/买入警报,有一个按钮可以快速打开目标图表。 在3种敏感模式中选择一种(慢-中-快
      KURAMA GOLD SIGNAL PRO(MT4版)— 7层过滤器、自动TP/SL、品质评分搭载 XAUUSD完整交易系统 不重绘。不重画。不延迟。每个信号永久固定。所见即所得。 福利:购买买断版许可证可免费获得 AI Zone Radar(价值$59)+ 完整PDF手册。购买后请给我发消息。 AI Zone Radar: https://www.mql5.com/en/market/product/175834 交易员的信赖:已被活跃的黄金交易员社区使用。因精度和易用性获得赞誉。 你的问题 — 以及解决方案 你知道黄金每天波动$30-50。你知道这里有钱可赚。但是: - 入场过早,价格反向$10后才朝你的方向走 - 每次MA触碰都入场,结果一半都失败 - 没有TP/SL系统,所以持仓太久或离场太早 - 在死寂时段交易,然后想为什么什么都不顺 KURAMA GOLD SIGNAL PRO解决了这一切。不是用一个过滤器,而是七个。 工作原理 — 3步 1. 图表上出现箭头信号 2. 在面板上查看TP价格、SL价格、品质评分、风险回报比 3. 下单并等待 无
      购买后请联系我,获取基于此指标的奖励EA。 Self Optimizing Double MA Strategy 是一款专业级别的交易工具,旨在消除参数猜测。它由内置的自动优化引擎驱动,通过在后台模拟数千种参数组合,不断适应不断变化的市场条件,从而保持统计上的优势。 该指标不依赖于静态、过时的设置,而是动态更新其内部逻辑,为当前的时间周期和交易品种寻找最赚钱的配置。 核心功能 内置自动优化:系统会根据您选择的更新频率,定期重新计算快速 MA、慢速 MA 和 RSI 的周期,确保您的设置始终与当前的市场节奏保持一致。 MA 发散过滤器:一项核心的趋势强度指标,仅在移动平均线积极发散时才确认信号的有效性。这可以防止在均线收敛或平缓的盘整市场中产生虚假的入场信号。 时序评分引擎:内部模拟器在图表上绘制任何实时信号之前,会根据您的具体目标(例如最大化利润因子或最小化回撤)对历史信号进行评估。 动态 ATR 区域:根据实时市场波动率,自动计算并在图表上直观地投射出止盈和止损区域。 实时绩效仪表板:直接在您的图表上跟踪并显示实时的系统指标,包括历史胜率、平均回撤以及产生的总点数。 完美支持 EA
      Gold Scalper Super
      Aleksandr Makarov
      5 (2)
      Gold Scalper Super is an easy-to-use trading system. The indicator can be used as a standalone scalping system on the M1 time frame, as well as part of your existing trading system. Bonus: when purchasing an indicator, Trend Arrow Super is provided free of charge, write to us after purchase. The indicator 100% does not repaint!!! If a signal appears, it does not disappear! Unlike indicators with redrawing, which lead to the loss of a deposit, because they can show a signal and then remove it.
      Advanced Currency Strength28 Indicator
      Bernhard Schweigert
      4.91 (657)
      目前40%的折扣 任何新手或专家交易者的最佳解决方案! 这个指标是一个独特的、高质量的、可负担得起的交易工具,因为我们纳入了一些专有的功能和一个新的公式。只需一个图表,你就可以读出28个外汇对的货币强度!想象一下,你的交易将如何得到改善,因为你的交易是在你的手中进行的。想象一下,你的交易将如何改善,因为你能够准确地确定新趋势或剥头皮机会的触发点? 用户手册:点击这里  https://www.mql5.com/en/blogs/post/697384 这是第一本,原版的! 不要买一个毫无价值的崇拜者的克隆品。 特别的 子窗口中的箭头显示强劲的货币势头GAP将指导你的交易! 当基础货币或报价货币处于超卖/超买区域(外盘斐波那契水平)时,在个人图表的主窗口中出现警告信号。 当货币力量从外围区间回落时,回撤/反转警报。 十字星模式的特别警报 可选择多个时间框架,以快速查看趋势! 货币强度线在所有的时间框架中都非常平稳,当使用较高的时间框架来识别总体趋势,然后使用较短的时间框架来确定精确的入口时,效果非常好。你可以根据自己的意愿选择任何时间框架。每个时间框架都由其自身进行了优化。
      Cyclic Impulse
      Vitalyi Belyh
      构建图表并识别周期性价格变动的技术指标。 可以在任何图表上工作。 几种类型的通知。 图表本身还有额外的箭头。 无需重新绘制历史记录,只需关闭蜡烛即可。 建议使用 M5 及以上的 TF。 易于使用和配置参数。 当使用 2 个具有不同参数的指标时,您可以单独使用它们,而无需其他指标。 有 2 个输入参数 周期性和信号持续时间 这两个参数处理图表结构的处理。 Cyclicity 调节反转周期的变化频率,平滑周期。 Signal duration 为最小数字,检测价格变动中的脉冲,最大长期趋势变动。    ---------------------------------------------------------------------------------------
      作者的更多信息
      Exit Manager
      Victor Christiaanse
      5 (2)
      Enhance Your Trading with the Exit Manager Elevate your trading strategy with the Exit Manager, designed to ensure optimal closure of your trades at precisely the right moments. Once you've placed an order, our Exit Manager steps in and starts monitoring the order based on YOUR predetermined conditions, and can even trail your stop loss to mitigate risk. Key Features: Set & Forget Functionality With the Exit Manager, simply place your trade and let the tool do the rest. It continuously monitor
      Click and Go Trade Manager: The Ultimate MT5 Execution Suite Precision Execution. Professional Performance Tracking. Total Control. In the world of   Smart Money Concepts (SMC) , ICT, and high-frequency scalping,   precision is your only edge.   Most traders lose not because their analysis is wrong, but because their execution is slow and their psychology is undisciplined. The Hard Truth:   If you are still manually calculating lot sizes or dragging lines while the price moves against you,   you
      Click and Go Trade Manager
      Victor Christiaanse
      5 (8)
      Click and Go Trade Manager: The Ultimate MT4 Execution Suite Precision Execution. Professional Performance Tracking. Total Control. In the world of Smart Money Concepts (SMC) , ICT, and high-frequency scalping, precision is your only edge. Most traders lose not because their analysis is wrong, but because their execution is slow and their psychology is undisciplined. The Hard Truth: If you are still manually calculating lot sizes or dragging lines while the price moves against you, you are trad
      Keyboard Trading
      Victor Christiaanse
      5 (1)
      Keyboard Trading  Open and Close orders with your keyboard. This tool allows you to open and close orders with your keyboard. As opening and closing orders with your keyboard is faster than with your mouse, this tool is very useful for Scalpers. How does it work? If you press the key "b", it will open a buy order with lot size, SL and TP as specified in the settings. If you press the key "s", it will open a sell order with lot size, SL and TP as specified in the settings. If you press the key "c
      FREE
      Three Moving Average Scanner
      Victor Christiaanse
      5 (8)
      This scanner is monitoring the entire market for trade opportunities for all symbols and for all time frames. This scanner will alert you on your computer, or on your mobile, when a trade opportunity has been found. Three moving average strategy   The three moving average strategy is a very popular and proven strategy. The slowest moving average is used to determine the direction of the trend. If the price is above the slowest moving average, we are in a Bullish market and if the price is below
      Trendline Trading
      Victor Christiaanse
      3 (1)
      If you use Resistance and Support Trendlines in your trading, this tool will be very useful for you!  The Trendline Trading EA is a smart and easy tool to helps you in your trading using trendlines on your chart. Just create a trendline for the Resistance and Support, and the EA will create pending orders when the price touch the trendline. The following orders will be created when the price touch the trendline: Pending order in case the price breaks the trendline Pending order in case the price
      Ichimoku Scanner
      Victor Christiaanse
      5 (1)
      This scanner is monitoring the entire market for Ichimoku trade opportunities for all symbols and for all time frames. You don't have to look to all the charts, for all symbols and for all time frames. This scanner will alert you on your computer, or on your mobile, when a trade opportunity has been found.  You never have to miss a trade opportunity!   This indicator is designed to scan all pairs and symbols, for all selected time frames, to find a Tenkan and Kijun Cross or a breakout of the Ich
      This indicator is designed to scan all pairs and symbols, for all selected time frames, to find a cross of moving averages. The 4 Moving Average Strategy The scanner has 4 moving averages: - 2 moving averages to define the trend - 2 moving averages are used to find the right moment to send an alert If the fast trend MA is above the slow trend MA, than it is considered as a bullish market and it will only provide bullish alerts. If the fast trend MA is lower then the slow trend MA, it is conside
      This scanner is monitoring the entire market for trade opportunities for all symbols and for all time frames. You don't have to look to all the charts, for all symbols and for all time frames. This scanner will alert you on your computer, or on your mobile, when a trade opportunity has been found.  You never have to miss a trade opportunity! This indicator is designed to scan all pairs and symbols, for all selected time frames, to find an Engulfing Candlestick Pattern. Features The scanner will
      Exit Manager MT5
      Victor Christiaanse
      Enhance Your Trading with the Exit Manager Elevate your trading strategy with the Exit Manager, designed to ensure optimal closure of your trades at precisely the right moments. Once you've placed an order, our Exit Manager steps in and starts monitoring the order based on YOUR predetermined conditions, and can even trail your stop loss to mitigate risk. Key Features: Set & Forget Functionality With the Exit Manager, simply place your trade and let the tool do the rest. It continuously monitors
      筛选:
      sunnychow
      9043
      sunnychow 2024.04.23 15:47 
       

      Nice

      intan08
      1388
      intan08 2022.07.25 16:05 
       

      Pleased with this.

      Rogelio Hernandez
      76
      Rogelio Hernandez 2021.01.21 00:21 
       

      This is a really good product, quality, price and really good support are the key here. Thanks for this tool!

      Lasse Michael Holm
      1604
      Lasse Michael Holm 2020.05.11 15:04 
       

      用户没有留下任何评级信息

      Bruce Chen
      44
      Bruce Chen 2019.12.22 13:43 
       

      用户没有留下任何评级信息

      Aravind Kolanupaka
      10179
      Aravind Kolanupaka 2019.03.06 10:25 
       

      Very good.

      回复评论