Three Moving Average Scanner
- 指标
- 版本: 3.12
- 更新: 6 二月 2023
- 激活: 5

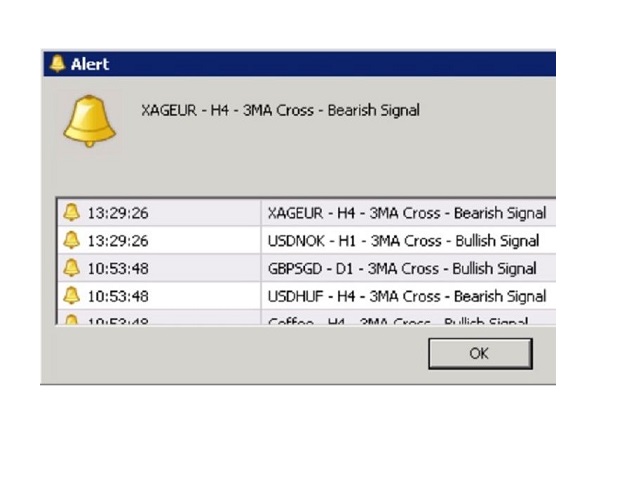
This scanner is monitoring the entire market for trade opportunities for all symbols and for all time frames. This scanner will alert you on your computer, or on your mobile, when a trade opportunity has been found.
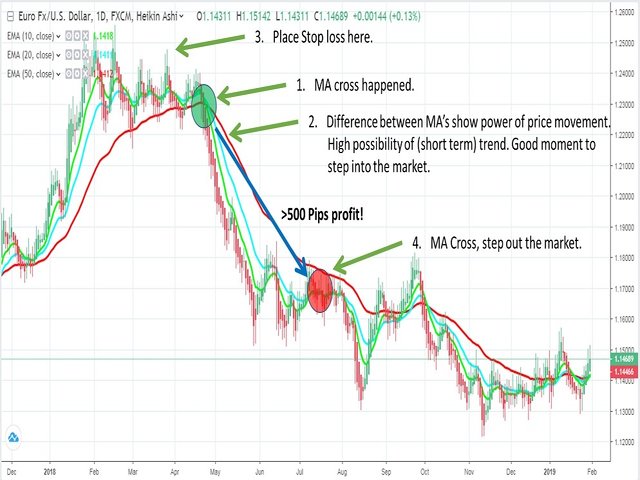
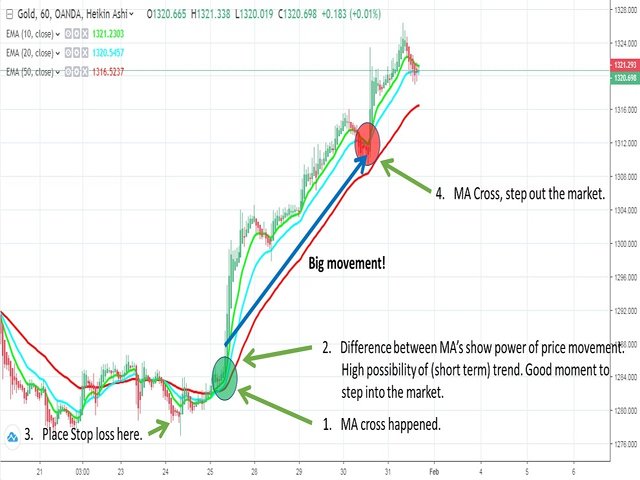
Three moving average strategy
The three moving average strategy is a very popular and proven strategy.
The slowest moving average is used to determine the direction of the trend. If the price is above the slowest moving average, we are in a Bullish market and if the price is below the slowest moving average we are in a Bearish market.
When the price is above the slowest moving average, we are looking for buying opportunities. When the fast moving average is crossing above the medium moving average, it is a good moment to step into the market.
Note: This scanner can also be used to find crosses for 2 moving averages
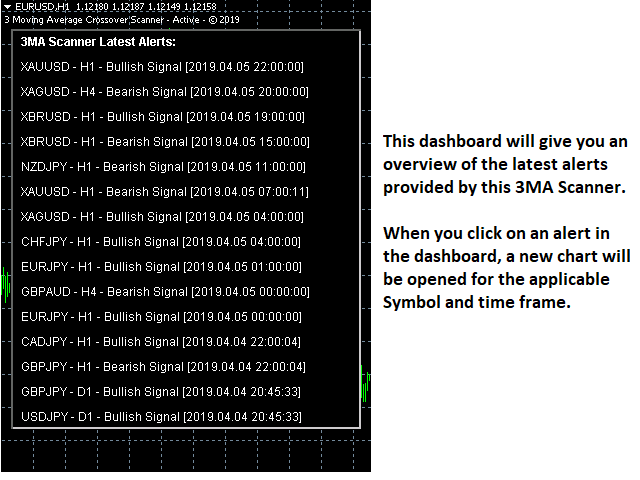
Moving Average Alerts
The scanner creates an alert when the following rules all are applicable:
The fast moving average crosses the medium moving average, or the medium moving average crosses the slow moving average.
Bullish Alerts: Fast moving average is higher than the medium moving average, and medium moving average is higher than the slow moving average.
Bearish Alerts: Fast moving average is lower than the medium moving average, and medium moving average is lower than the slow moving average.
The distance between each moving average is more than the minimum distance as specified in the parameter.
The Scanner is also able to send alerts if the price has touched one of the Moving Averages. By default this option is turned off, but can be turned on in the indicator settings.
Trend filter is available. If Trend Filter is set to True, alerts will be filtered as following:
- Buy Alerts (Fast MA crosses Medium MA or Slow MA from below) only if the current Price is above the Trend Moving Average- Sell Alerts (Fast MA crosses Medium MA or Slow MA from above) only if the current Price is below the Trend Moving Average
Features
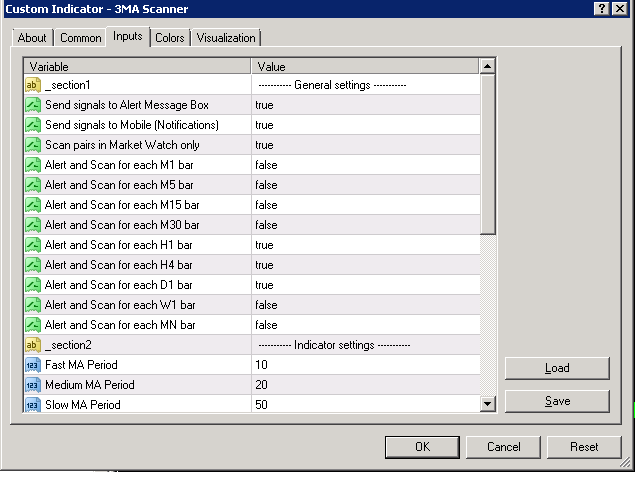
- Scans all symbols visible in your Market Watch window, or all symbols available for your broker at the same time.
- Specify which time frame you want to monitor.
- Receive Alerts on your mobile phone! (MT4 notifications are use)
- Receive Alerts in the MT4 terminal.
- Dashboard to show latest alerts.
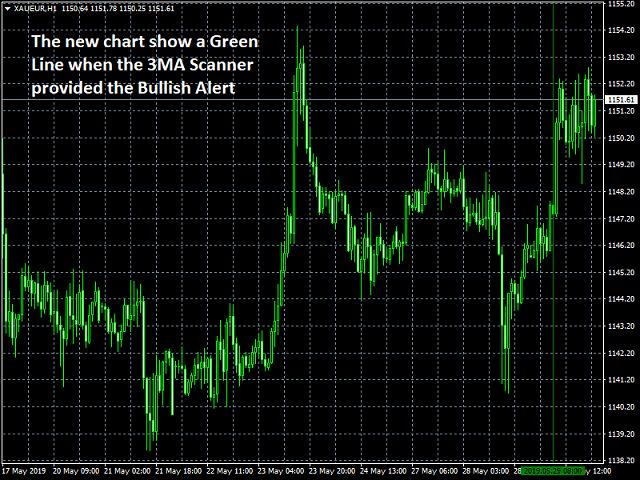
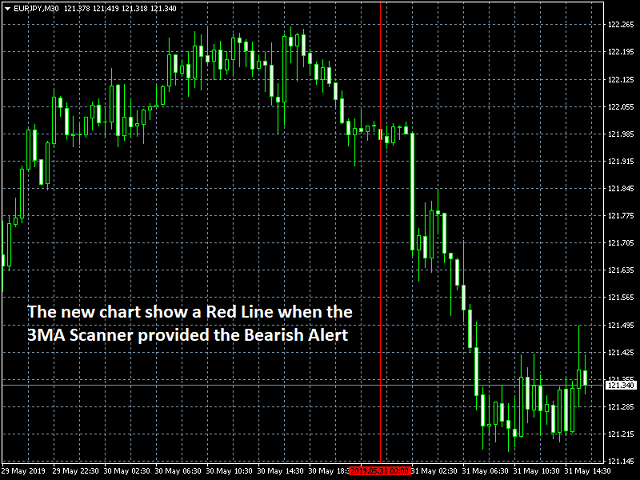
The dashboard will show the latest alerts provided by this Scanner. When you click on an alert in the dashboard, a new chart will be opened for the applicable Symbol and time frame. The new chart will highlight the alert with a vertical line.
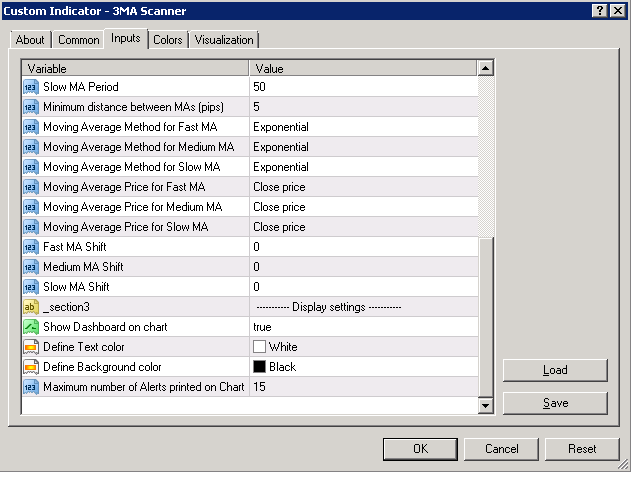
The moving average settings can be specified for each moving average.
Install the indicator only on one chart to scan the entire market.
Trading Recommendations
Higher time frames are more reliable than shorter time frames (H1 or higher).Do not enter the market when high critical news is expected the same day. High critical news can result in unexpected movements in the market, which can not be identified by any indicator. News can be found on e.g. the MQL website.
Do not enter the market when the price is close to an important support or resistance.
Please refer to my blog for detailed clarification for all the settings.

Easy settings and received multiple alerts almost immediately after installing. Thanks Victor for the awesome indicator!