MQLTA Candle Timer

5

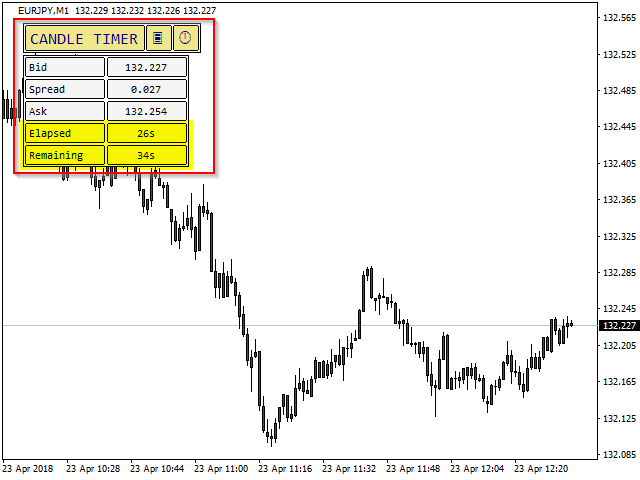
MQLTA Candle Timer is an indicator that can show you the details about a symbol/pair and alert you before the close of a candle. Used in swing trading and not only, it can help your strategies knowing and be ready before the close of a candle.


How does it work

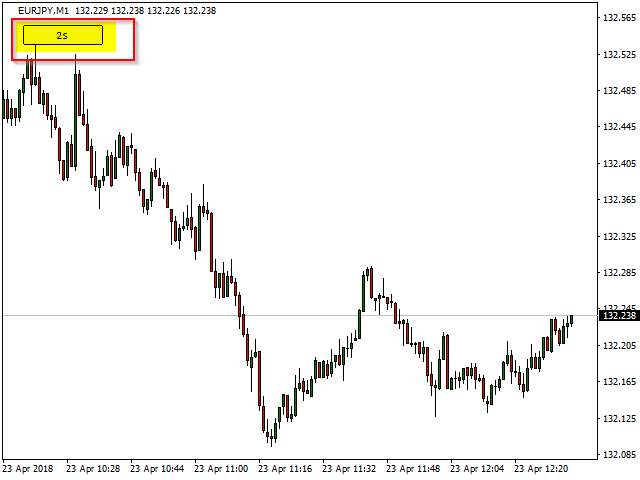
Simply add the indicator to the chart and set the notifications options. You can load a minimalistic interface or a full interface. The alert will be sent once per candle.
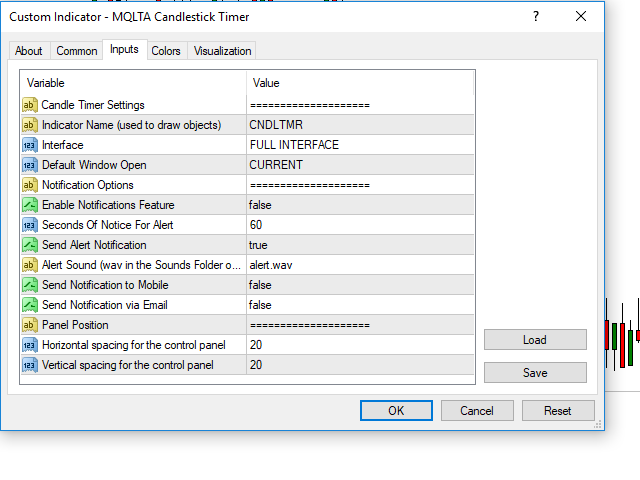

Parameters

All the parameters, that you can see in the picture, are self explanatory.

If you like this tool please take a minute to leave a review.

If you have suggestions to improve it please send me a message and we can discuss it further.

Feel free to visit my profile and "Add to friends" https://www.mql5.com/en/users/mql4autotrading.

评分 2
idkau
29
idkau 2021.03.24 01:26 
 

Works great

推荐产品
Breakout Box
Claus Dietrich
4.33 (24)
BREAKOUT-SESSION-BOX LONDON EU US ASIA Open watch the expectation of a volatile movement above or under the opening range We take the high of the range as Entry for a long trade and SL will be the low of the range and vice versa the low of the range as Entry for a short trade and the high for SL The size of the range is the distance to the TP (Take Profit) The range of the opening hours should not be larger than about 1/3 of the average daily range 4 breakout examples are already predefined: A
FREE
IntraScalpermt4
Mangesh Popat Ubale
IntraScalpermt4 Indicator   is an advanced, dynamic level-providing strategy/ Signals built in proven price action principles. At the start of every trading session, it automatically calculates the decisive   Levels —a key point that DECIDER guides high-probability trade opportunities. Indicators Including:- 1.  Day Trading Levels. 2.  IntraTrend Line for Scalping using M1 TF. 3.  Dynamic IntraScalper providing supply or demand zone on chart. 4.  EA Setting/Documentation in Indicator=> About T
FREE
Description I think, almost all traders dream about non-lagging MA. I have realized that dream in my indicator. It allows forecasting future MA values! The indicator can be used in four different ways: The first one - forecast for the desired amount of bars. Thus, you are able to evaluate future price behavior. The second one - generating non-lagging "averages". That can be implemented by moving MA back by the half of the averaging period and setting the forecast the necessary amount of bars ahe
FREE
Upper and Lower Trendline
David Muriithi
5 (2)
This indicator uses a different approach from the previous version to get it's trendlines. This method is derived from Orchard Forex, and the process of making the indicator is demonstrated in there video   https://www.youtube.com/watch?v=mEaiurw56wY&t=1425s . The basic idea behind this indicator is it draws a   tangent line   on the highest levels and lowest levels of the bars used for calculation, while ensuring that the lines don't intersect with the bars in review (alittle confusing? I know
FREE
此工具提供了两个主要优势:它增强了MT5经济指标的使用便利性,并实现了与MT4的无缝数据共享。例如,您可以有效利用超过10年前的经济指标数据进行训练和回测。此外,它兼容MT4的 PracticeSimulator ,使其成为从历史数据交易练习到MT4实时交易的宝贵工具。 重要提示 此工具需要从MT5获取经济指标数据,因此在MT4版本中无法独立运行。请确保已安装MT5版本。 => MT5版本 MT5经济指标的改进 历史数据访问 : 分析包括超过10年前事件的经济指标数据,支持详细的回测和历史回顾。 可自定义显示 : 经济指标以不显眼的方式显示在您的图表上,并可选择与背景融合显示。 自动时间调整 : 自动调整时区和夏令时,确保历史事件的准确显示。 MT4的兼容性和优势 无缝数据共享 : 直接在MT4图表上使用MT5经济指标数据,包括实时交易和练习场景。 与PracticeSimulator的集成 : 兼容 PracticeSimulator ,使您能够将真实的经济事件纳入训练和策略测试中。 多语言支持 : 经济指标可以以您的母语显示,使工具更加易用。 此工具的独特功能是能够将MT5数据与
FREE
R Var 移动平均线指标是为顽固的趋势追随者设计的趋势跟踪指标。 它是股票交易者和商品交易者中非常流行的外汇交易指标,它的流行源于它能够向用户提供真正的赚钱信号。 该指标由放置在黄褐色线上的绿色和红色点组成。 绿点指向看涨信号,而红点表示看跌信号。 基本交易信号 买入信号:当指标的黄褐色线上的点变为绿色时,做多。 卖出信号:当指标的黄褐色线上的点变为红色时做空。 退出买入交易:如果在看涨趋势持续期间,指标的西耶娜线上出现红点,则关闭所有买入订单。 退出卖出交易:如果在看跌趋势持续期间,R Var 移动平均线指标的西耶纳线上显示绿点,则关闭所有卖出订单。 尖端 在使用 R Var 移动平均线指标时,利用适度的止损来防止错误信号。 将其用于各种交易方式,包括剥头皮交易和日间交易。 特征 平台:MetaTrader 4 货币对:任何 自定义选项:变量(periodAMA、nfast、nslow、G、dK、UseSound、SoundFile)、宽度和样式。 时间范围:1 分钟、5 分钟、15 分钟、30 分钟、1 小时、4 小时、1 天、1 周、1 个月 类型:趋势
FREE
Shadow System Candles - AI Trend Visualization Concept "Stop trading in the dark. Equip your chart with Night Vision." Shadow System Candles is the visual core of the "Shadow Operation" project. It eliminates market noise and visualizes the true direction of the trend using AI-based logic (ADX + MA integration). Note: This tool does not generate buy/sell arrows. It is designed to train your eyes to recognize "Active Trends" and "Dangerous Ranges. Key Features ・AI Logic Coloring[/b]: Automat
FREE
Please contact me at telegram  https://t.me/smartforex7 After purchasing SmartForex Indicator then Use This Indicator...................... SMART EXIT PROFIT LINE Indicator is very Helpful with SmartForex Indicator ........................................ SMART EXIT PROFIT LINE Indicator Attach with SmartForex Indicator after then Red Line Show Exit buy Profit , Green Line show Exit Sell Profit................
FREE
Heikin Ashi Smoothed – MT4指标 Heikin Ashi Smoothed 是一款适用于 MetaTrader 4 (MT4) 的自定义指标,在传统的平均线蜡烛图基础上,通过加入额外的移动平均平滑处理,让趋势显示更加平滑直观。该方法极大减少了图表噪音,使得主趋势和可能的反转信号更加清晰,有助于把握市场方向。 主要特点 在图表上显示经过进一步平滑处理的 Heikin Ashi(平均足)K线,更清晰地反映价格走势 有效过滤小幅波动与虚假信号,趋势一目了然 更容易识别趋势反转,帮助避免因市场噪音导致的多余交易 适用于所有时间周期和任何品种(包括外汇、CFD、指数等) 计算轻巧高效,可在多图表、多周期下流畅运行 原理说明 Heikin Ashi Smoothed 首先计算标准的平均足四价(开盘、高点、低点、收盘),然后在此基础上再应用移动平均(如SMA或EMA)进行二次平滑处理。最终在图表上展现出极其平滑的K线,使细小波动被最大限度压制,主趋势方向更加明显。 通过不同的颜色和形状,趋势方向和强度一目了然,有助于持仓信心和避免因短期回调而频繁操作。 适用对象 采用趋势跟随
FREE
ControlPoints Indicator Purpose: Identifies Control Points (CP) — local extremums (fractals) on the chart. Upper CPs are local highs, lower CPs are local lows. Displayed on the chart as diamond markers. No-Repaint: The indicator does not repaint. A CP at bar i is only confirmed when all bars in the window [i − BarsBefore, i + BarsAfter] are closed. The forming (current) bar is never evaluated. Once confirmed, the value is never recalculated. Detection Logic Upper CP: high[i] is strictly greater
FREE
Pegasus Pro
Armin Heshmat
Pegasus Pro works on based on HFT (high frequency trading) algorithm , but it’s so sensitive, it’s 100% automatic,Pegasus Pro is capable to scalp every different situation ,Please try Backtest with the lowest spread : ( MAX 5 for majur currency ) Because the ECN accounts Types have very low spreads , Maximum Ms for VPS: 5, do not forget to get this Ms your broker's server address must be in the same place with your VPS address Live signal,  https://www.mql5.com/en/signals/2256700?source=Site+S
该智能交易系统不进行任何交易,但它会扫描您的市场观察中的整个交易品种,并在不同的时间范围内逐一扫描每个股票,最后它会向您显示哪个交易品种在哪个时间范围内具有强大的吞没蜡烛。 此外,您可以定义 MA 周期和 RSI 上限和下限,它会显示哪个时间范围内的交易品种将穿越调整后的移动平均线,以及哪个时间范围内的交易品种将穿越移动平均线的上限或下限。 相对强弱指数。 Gāi zhìnéng jiāoyì xìtǒng bù jìnxíng rènhé jiāoyì, dàn tā huì sǎomiáo nín de shìchǎng guānchá zhōng de zhěnggè jiāoyì pǐnzhǒng, bìng zài bùtóng de shíjiān fànwéi nèi zhúyī sǎomiáo měi gè gǔpiào, zuìhòu tā huì xiàng nín xiǎnshì nǎge jiāoyì pǐnzhǒng zài nǎge shíjiān fànwéi nèi jùyǒu qiángdà de tūnmò làzhú. Cǐwài, nín
FREE
Super trend is one of the best trend indicators in metatrader 4 (MT4). Triple SuperTrend indicator is an indicator that consist of three super trend indicator that can be aranged. This indicator is built by mql4 language and doesn't provided by MT4 platform. Highly recommended using EMA SuperTrend Strategy Indicator if you want to get better result in here: https://www.mql5.com/en/market/product/91664 This indicator is easy to use, power full and has many benefits, there are: Using three indic
FREE
AD Trend line
Pavel Shutovskiy
5 (1)
AD Trend line draws trend lines on the basis of A/D indicator (Accumulation/Distribution). When A/D indicator breaks a trend line, the probability of the trend reversal is very high. This is a multitimeframe indicator which can display values from higher timeframes. Parameters Time-frame — Select a timeframe; zero is the current timeframe of the chart; Trend Line — Display lines on the chart; Apply to — Apply lines to close the candle's highest/lowest value; Width line — Width of the line; Style
FREE
Strong Bot 4
Andriy Sydoruk
Strong: A Powerful Forex Bot for Multi-Currency Trading Strong is an automated tool for trading on the Forex market, utilizing modern technologies and algorithms. It is designed for traders who aim to improve the efficiency of their trading and reduce risks in a constantly changing market. Key Features of Strong Multi-Profile Trading: Strong supports a wide range of currency pairs, including both major and exotic assets. This allows traders to diversify their portfolios and adapt strategies to
KFX Symbol Changer
Peter Kariuki Thande
4 (1)
KFX SMA: Symbol Changer + Moving Average (3x) + ATR + RSI + Candle Timer. This indicator allows you to create a Symbol list and change between symbols of the current chart or Timeframe by selecting the appropriate button. On Chart there are three(3) multi timeframe Moving Averages shown (selected by you), ATR Value MTF ( selected by you -  helps with setting SL and TP), RSI Value MTF (selected by you) and a Candle Timer.   Features: - Symbol Changer : Change Symbol and Timeframe of Chart.   (s
FREE
Wa Candle Timer Percentage
Wachinou Lionnel Pyrrhus Sovi Guidi
Wa Candle Timer Percentage MT4 is an indicator which shows the user how much time is remaining until the next candle will form. The percentage of the evolution of the current candle is also displayed. The user can set the percentage that the candle timer will change the color. These are the settings: 1- The percentage that the candle timer will change the color. 2- Color of Candle Timer when it's BELOW the percentage set by the user. 3- Color of Candle Timer when it's ABOVE the percentage set b
FREE
For more info,  questions   and problems join to discord.gg/reitakfx Very informative and detailed tool for your account.  - pairs, number of trades, lot size, profit, lose, nett p/l, net pips - profit growth chart Instalation : - open chart and delete every other indicator on it - put this report on chart Setting : - magic number - filters (comment, symbols, currencies) - date (today, week, month custom) - Start / End date (this is for custom date) - report type (open - only active trades wi
FREE
Oscillator helps determine the direction of the market Shows the direction of the price movement and is painted in the appropriate color. Allows you to conduct trend and counter trend trading It works on all timeframes, on any currency pairs, metals and cryptocurrency Can be used when working with binary options Distinctive features Does not redraw; Simple and clear settings; It works on all timeframes and on all symbols; Suitable for trading currencies, metals, options and cryptocurrency (Bitco
该指标预测价格反转,分析市场的看涨和看跌压力。购买压力是一定天数内所有累积柱的总和乘以交易量。卖压是相同数量条上所有分配的总和乘以交易量。 [ 安装指南 | 更新指南 | 故障排除 | 常见问题 | 所有产品 ] 指标比率使您可以衡量购买压力占总交易量的百分比,该值应在0到100之间波动。它执行两个移动平均值(快和慢),以识别压力趋势的变化并相应地寻找交易。 比率50表示市场均衡 比率超过70表示市场超买 比率低于30意味着市场超卖 红色虚线是当前比率 蓝线是信号线 橙色线是主线 它具有直接的交易含义。 市场超卖时寻找购买机会 市场超买时寻找销售机会 如果信号线高于主线,则压力看涨 如果信号线低于主线,则压力看跌 输入参数 周期:研究计算压力的条数 快速MA:直方图的快速平均周期 慢的MA:直方图的平均周期慢 作者 ArturoLópezPérez,私人投资者和投机者,软件工程师和Point Zero Trading Solutions的创始人。
FREE
MA in color PRT
Irina Cherkashina
The MA in Color_PRT Indicator offers valuable insights into market trends by displaying moving averages in different colors based on their direction. Green indicates an uptrend, red for a downtrend, and yellow for a consolidation phase. Traders can use this indicator to easily identify potential entry and exit points in their forex trades. When the lines change color, it can signal a change in market direction, giving traders an opportunity to adjust their strategy accordingly. Additionally, th
FREE
Skan
Niravkumar Maganbhai Patel
4.75 (4)
SKAN   This indicator helps you to scan all symbols which are in the Market Watch window and filter out a trend with alerts. It works on five most effective indicators which are used by most of traders for trading: Moving Average Super Trend (ST) Bolinger Band (BB) OPRC BFD It calculates two bars for scanning. When box colour changes to coral or royal blue colour, it indicates you for trend change for long and short entry. And also you will get alert on screen. When it changes to royal blue, it
FREE
The Magic SMMA indicator is of great help in determining trend direction. It can be an excellent addition to your existing strategy or the basis of a new one. We humans can make better decisions when we see better visually. So we designed it to show a different color for rising and falling trends. Everyone can customize this in the way that suits them best. By setting the Trend Period, we can optimize it for longer or shorter trends for our strategy. It is great for all time frames. IF YOU NEE
FREE
G Force Trend
Sinan Durkan
What is G Force Trend? G Force Trend is a technical analysis indicator developed for the MetaTrader 4 platform. It analyzes price movements to identify trend direction and generates buy/sell signals. The indicator creates a dynamic channel to track price behavior within the channel and visualizes trend changes. What Does It Do? Trend Detection : Determines whether the price is in a bullish or bearish trend. Buy/Sell Signals : Generates clear buy and sell signals when the price crosses the channe
FREE
1.根据图表周期,确定趋势大小。在一段行情内最高价附近,为上涨趋势。在一段行情内最低价附近,为下跌趋势。 2. 趋势确立后,下一步就是确定短期趋势的超买和超卖。 超卖、多头;  超买,做空。   3.  根据超买和超卖以及利润点进行平仓。  实盘信号: https://www.mql5.com/zh/signals/1538661?source=Site+Signals+My EA 设置: 您需要把EA加载到要交易的货币对上(M15 时间范围) 现好的货币对: EURUSD,GBPUSD,GBPJPY,USDJPY,XAGUSD,GBPAUD 使用此EA,请是使用ECN账号。 可以使用我推荐的货币对,也可以使用其他货币对。 信号上100使用0.01手,建议使用更高的资金降低风险。 推荐杠杆 1:200 或更高 可以使用参数列表里内置的参数,也可以自定义参数。 参数设置: Applicable_Symbol - 表现最好的货币品种  cycle_time - 加载图表周期 Built_in_parameters - 选择内置的货币参数或选择自定义参数 Lot - 开单手数 AutoLo
Super Ichi
Sinan Durkan
What is the Super Ichi Indicator? Super Ichi is an advanced combination of Ichimoku Kinko Hyo and SuperTrend indicators. This powerful technical analysis tool is designed to identify market trends and generate trading signals. What Does It Do? Dual-Level Trend Analysis : Uses customized versions of Tenkan-sen and Kijun-sen lines Automatic Signal Generation : Displays visual markers (arrows) at crossover points Real-Time Alert System : Provides audio and visual alerts when new signals occur Dynam
FREE
Daily Volatility Tracker is a practical and lightweight indicator designed to help traders monitor and analyze market volatility based on historical daily price movements. Whether you're a day trader, swing trader, or scalper, understanding how much a market moves per day is critical for: Choosing the right pairs to trade Setting accurate stop-loss and take-profit levels Adapting to changing market conditions MT5 Version -  https://www.mql5.com/en/market/product/134960/ Join To Learn Market Dept
FREE
Dumangan MT4
Jose Lagayan
5 (4)
Introducing Dumangan MT5 - The Philippine God Of Harvest  ( MT5 Version -  https://www.mql5.com/en/market/product/98640 ) Experience the abundance of successful trades with Dumangan MT5, our new Expert Advisor available on MQL5.com. Named after the revered Philippine God of Harvest, Dumangan, this tool embodies the essence of reaping profits from the fertile ground of the markets, just like Dumangan blessed the fields with bountiful crops. A Focused Strategy with Customizable Settings Dumangan M
FREE
It is a custom non-repaint indicator to identify trade opportunities in swing action as prices move within an upper and lower band. Inspired by the Keltner Channel, the most popular channel Indicator introduced by Chester Keltner. It is different with a Bollinger Bands. It represents volatility using the high and low prices, while Bollinger's studies rely on the standard deviation. The algorithm for this indicator is also available in the EntryMaximator EA. Including the option to use it or not.
FREE
Jerk Indicator
Safwan Rushdi Khalil Arekat
5 (1)
In physics, "Jerk" is the third time-derivative of position, with acceleration being the second derivative and velocity the first derivative. In technical analysis, the first derivative of price is the price momentum, with the second derivative,acceleration, being seldom used and the third derivative virtually unknown. The magnitude frequency response of a digital differentiator is a positive-slope straight line passing through zero frequency. Therefore, every instance of a digital signal differ
FREE
该产品的买家也购买
Gann Made Easy
Oleg Rodin
4.83 (162)
Gann Made Easy 是一个专业且易于使用的外汇交易系统,它基于使用先生理论的最佳交易原则。 W.D.江恩。该指标提供准确的买入和卖出信号,包括止损和获利水平。您甚至可以使用推送通知在旅途中进行交易。 购买后请联系我,即可免费获得交易指导和超棒的额外指标! 您可能已经多次听说过江恩交易方法。通常 Gann 的理论不仅对于新手交易者而且对于那些已经有一定交易经验的人来说都是非常复杂的东西。这是因为江恩的交易方法在理论上并不那么容易应用。我花了几年时间来完善这些知识,并将最好的原则应用到我的外汇指标中。 该指标非常易于应用。您所需要的只是将其附加到您的图表并遵循简单的交易建议。该指标不断进行市场分析工作并寻找交易机会。当它检测到一个好的入口点时,它会为您提供一个箭头信号。该指标还显示止损和获利水平。 换句话说,当您像先生一样进行交易时,该指标会为您提供最佳江恩建议。江恩亲自告诉你此时此刻该做什么。但最好的部分是您不需要了解任何有关江恩交易原则的知识,因为该指标会为您完成整个市场分析工作。
M1 Sniper
Oleg Rodin
5 (22)
M1 SNIPER 是一款易于使用的交易指标系统。它是一个专为 M1 时间框架设计的箭头指标。该指标可以作为独立的系统在 M1 时间框架下进行剥头皮交易,也可以作为您现有交易系统的一部分使用。虽然该交易系统专为 M1 时间框架交易而设计,但它也可以用于其他时间框架。我最初设计此方法是为了交易 XAUUSD 和 BTCUSD。但我发现这种方法在其他市场交易中也同样有用。 指标信号既可以顺势交易,也可以逆势交易。我教授一种特殊的交易技巧,帮助您利用指标信号进行双向交易。该方法基于使用特殊的动态支撑位和阻力位区域。 购买后,您可以立即下载 M1 SNIPER 箭头指标。此外,我还为所有 M1 SNIPER 工具用户免费提供下方屏幕截图所示的 Apollo Dynamic SR 指标!这两个指标的组合可以帮助您更轻松、更准确地利用 M1 时间框架进行交易。 购买后请联系我,免费获取交易提示和奖励指标! 祝您交易成功!
Market Makers
Mohamed Hassan
5 (3)
After purchase, contact me privately to receive 1 month of free testing with EA Forex Proton! This advanced MT4 trading robot automatically executes signals from any MT4 indicator, including Market Makers. The latest version also includes AI integration, allowing each trade signal to be analyzed using Artificial Intelligence. Live Signal with EA Forex Proton: Click here Market Makers is a powerful price action trading system designed to identify high-probability Buy and Sell opportunities based
PRO Renko System
Oleg Rodin
5 (30)
PRO Renko Arrow Based System for trading renko charts.  准确的信号交易任何外汇工具. 另外,我将免费提供系统的附加模块! PRO Renko系统是RENKO图表上高度准确的交易系统。该系统是通用的。 该交易系统可应用于各种交易工具。 该系统有效地中和了所谓的市场噪音,打开了获得准确反转信号的通道。 该指标易于使用,只有一个参数负责产生信号。 您可以很容易地使算法适应您感兴趣的交易工具和renko酒吧的大小。 我很乐意通过提供任何咨询支持来帮助所有客户有效地使用该指标。 祝您交易成功!购买后,立即写信给我! 我将与您分享我的建议和我的renko发电机。 另外,我将免费提供系统的附加模块!
Ultimate Sniper Dashboard
Hispraise Chinedum Abraham
4.82 (22)
折扣价为299美元! 未来可能会涨价! 请阅读下面的描述! 终极狙击手仪表盘的最佳进入系统。终极动态水平。(请查看我的产品) 由于MT4多币种测试的限制,终极狙击手仪表盘只适用于实时市场。 介绍Ultimate-Sniper Dashboard! 我们最好的产品包括HA-狙击手、MA-狙击手和许多特殊模式。终极狙击手仪表盘是一个绝对的野兽! 对于任何新手或专家交易者来说,这是最好的解决方案! 永远不要再错过任何一个动作! 对于那些喜欢简单和点数的交易者,我们有一个特别的产品给你。本质上很简单,该仪表板根据多种自定义算法查看28种货币对,完成所有工作。只需一张图表,你就可以像专家一样阅读市场。试想一下,如果你能在任何外汇对开始移动时准确地确定其方向,你的交易会有多大的改善。   我们的系统是为了寻找高概率信号并实时向用户发送警报。没有滞后或错误的信号。 为了保持图表的清洁,你可以在不需要时隐藏Ultimate-Sniper。只需按下箭头按钮即可隐藏仪表板。 Ultimate-Sniper适用于从1分钟到月度的所有时间框架,因此你可以在你选择的任何时间框架上快速发现趋势。 高概率信号
Trend Screener
STE S.S.COMPANY
4.79 (95)
趋势指标,趋势交易和过滤的突破性独特解决方案,所有重要趋势功能都内置在一个工具中! 它是 100% 非重绘多时间框架和多货币指标,可用于所有符号/工具:外汇、商品、加密货币、指数、股票。 限时优惠:支撑和阻力筛选指标仅售 65美元,终身有效。(原价 250 美元)(优惠延长) 趋势筛选器是有效的指标趋势跟踪指标,它在图表中提供带有点的箭头趋势信号。 趋势分析器指标中可用的功能: 1.趋势扫描仪。 2. 具有最大利润分析的趋势线。 3.趋势货币强度计。 4. 带有警报的趋势反转点。 5. 带有警报的强趋势点。 6. 趋势箭头 每日分析示例,每日信号表现...等与我们的趋势筛选指标,可以在这里找到: 点击这里 限时优惠:Trend Screener Indicator 仅售 150 美元且终身可用。原价 199$) 通过访问我们的 MQL5 博客,您可以找到我们所有的高级指标以及分析示例、每日信号表现...等。 : 点击这里 我们的趋势系统由 2 个指标组成: 1. Trend Screener Indicator:显示趋势仪表盘、图表中的趋势线、入场点...等。 2. Trend
GoldRush Trend Arrow Signal
Kirk Lee Holloway
5 (2)
GoldRush 趨勢箭頭信號 GoldRush 趨勢箭頭信號 指標為 XAU/USD 中的高速、短期短線交易者提供精確、實時的趨勢分析。 專為1分鐘時間框架設計,此工具顯示方向箭頭以明確顯示入場點,使短線交易者能在波動市場中自信操作。 該指標包含主要和次要警示箭頭。主要信號為白色和黑色方向箭頭,用於指示趨勢方向的轉變;次要信號為藍色和紅色箭頭,用於確認主要箭頭指示的方向並提示潛在交易入場點。 注意:當趨勢方向發生變化後僅出現一個主要警報箭頭時,請注意可能會出現多個次要藍/紅箭頭。次要信號將在滿足信號標準的任何蠟燭圖後出現,因此在長期趨勢移動中,螢幕上將顯示大量次要箭頭(如附帶的截圖所示)。您可在設置中開啟或關閉任一箭頭類型。 以下是我使用此指標進行交易的方式: - 對於買入入場,我會耐心等待白箭頭在蠟燭收盤時出現,並在下一根可用蠟燭收盤時出現藍箭頭時進行買入交易。 - 對於賣出入場,我會耐心等待黑箭頭在蠟燭收盤時出現,並在下一根可用蠟燭收盤時出現紅箭頭時進行賣出交易。 - 獲利了結/止損設置由使用者自行負責,但我個人使用最低R:R為1:2,並發現這在倫敦/紐約開盤等
Super Signal – Skyblade Edition 專業級無重繪 / 無延遲趨勢信號系統,擁有卓越勝率 | 適用於 MT4 / MT5 在較低的時間週期上效果最佳,例如 1 分鐘、5 分鐘與 15 分鐘圖表。 核心特色: Super Signal – Skyblade Edition 是一套專為趨勢交易設計的智能信號系統。 其採用多重濾波邏輯,僅篩選出具有明確方向性、動能強勁且波動結構健康的走勢進場點。 本系統 不預測高點或低點 ,只有在同時滿足以下三項條件時才會觸發交易信號: 趨勢方向明確 動能持續增強 波動率結構穩定 此外,系統還結合市場流動性分析,以進一步提升信號的準確性與觸發時機。 信號特性: 所有箭頭信號皆為 100% 無重繪,無延遲 信號一旦出現即固定於圖表,不會閃爍或消失 提供圖表箭頭、資訊面板、彈出通知、聲音提示及推播訊息 支援 EA 呼叫(Buffer 輸出),可整合至自動化交易或信號跟單系統 提供預設參數模板,免調整即可使用,適合新手快速上手 總結: Super Signal – Skyblade Edition 是一款邏輯清晰、穩定高效的專業趨勢型
Dynamic Scalper System
Vitalyi Belyh
5 (1)
“ Dynamic Scalper System ”指标专为在趋势波内进行剥头皮交易而设计。 已在主要货币对和黄金上进行测试,并可与其他交易工具兼容。 提供顺势短线建仓信号,并提供额外的价格变动支持。 指标原理: 大箭头决定趋势方向。 在趋势波内,我们采用一种生成小箭头形式的剥头皮交易信号的算法。 红色箭头代表看涨方向,蓝色箭头代表看跌方向。 敏感的价格变动线会沿着趋势方向绘制,并与小箭头信号协同作用。 信号运作方式如下:当线在适当时刻出现时,将形成入场信号;在出现线时,持仓;线完成后,平仓。 建议的操作时间范围为M1 - H4。 箭头在当前K线上方形成,如果下一根K线已开仓,则不会重新绘制上一根K线上方的箭头。 输入参数 Trend Wave Period - 趋势方向(大箭头)的周期,改变趋势波的时间间隔。值 1 表示趋势方向的最长持续时间,参数值越大,持续时间越短。 Scalper Arrows Period - 信号箭头(小箭头)的计算周期,改变入场信号的生成频率。值 3 表示最频繁的生成频率,参数值越大,箭头频率越低,准确度越高。 这些参数可以根据不同的时间范
Ultimate Dynamic Levels
Hispraise Chinedum Abraham
4.7 (10)
目前正在进行节日折扣,价格为399美元! 未来价格可能会上涨。请阅读下面的描述!   介绍 Ultimate Dynamic Levels - Ultimate Sniper Dashboard的最佳入场指标! 极低风险的及时进场和高RR!! 在这里找到终极狙击手仪表板。 对于初学者和职业交易者来说,最重要的能力是准确判断市场最可能转向的位置和时间,以及如何安全进入并获利退出。 终极动态水平指标很容易告诉你市场转折的最高可能性在哪里,这样你就可以自信地进入一个极低风险的交易,同时保持你的图表干净和简单,同时赚取美元! 终极动态水平指标有一个独特而强大的算法,可以同时在多个时间框架上找到重要的隐藏水平。它实在是太神奇了,而且永远不会像其他典型的SR指标那样重绘或重新绘制水平线!  终极动态水平指标还在图表的右侧有一个水平强度简介,以显示该水平在最近的历史上是否强劲。一个强大的奖励组合!!!。 终极动态水平指标有3个非常重要的功能。 1. 帮助你进入趋势方向的低风险交易。 2. 2.使你保持在趋势中,只要移动仍在进行。 3. 3.作为追踪止损,保护你的收益,避免把钱留在桌上! 强
Scalper Inside PRO
Alexey Minkov
4.74 (69)
Scalper Inside PRO – Since 2020. An exclusive indicator that utilizes an innovative algorithm to swiftly and accurately determine the market trend. The indicator automatically calculates opening, closing, and profit levels, providing detailed trading statistics. With these features, you can choose the most appropriate trading instrument for the current market conditions. Additionally, you can easily integrate your own arrow indicators into Scalper Inside Pro to quickly evaluate their statistics
Advanced Supply Demand
Bernhard Schweigert
4.91 (299)
现在优惠 40%! 任何新手或专业交易者的最佳解决方案! 该指标是一款独特、高质量、且价格合理的交易工具,因为我们已经整合了许多专有功能和新公式。 依据此更新,您将能够显示双重时间帧区域。 您不仅可以显示一个较高的时间帧,还可以同时显示图表时间帧,加上更高的时间帧:显示嵌套时区。 供需双方所有交易者都会喜欢它。 :) 重要信息披露 高级供需的最大潜力,请访问 https://www.mql5.com/zh/blogs/post/720245   想象您的交易如何得以改善,是因为您能够精准定位入场或目标位吗? 构建于新的底层算法,它可以更轻松地识别出买卖双方之间的潜在失衡。 这是因为它以图形方式展示供需最强劲区域,及其过去的表现(显示旧区域)。 这些功能旨在帮助您更轻松地发现最佳入场区域和价位。 现在您可以针对您的交易品种和时间帧来优化和编辑区域强度! 高级供需指标适用于所有产品和时间帧。 它是一个新的公式,非常新的功能是两个区域强度函数可由用户输入进行调整! 这在交易中是一大优势。 当您学习如何使用专有功能,例如带有价格游离最小 X 因子的区域强度时,您能够判断该区域强劲与否。 供需
Route Lines Prices -  是一款用于寻找价格方向的指标。其简洁的界面包含多种价格行为和未来方向计算算法。这些算法包括基于所用时间周期的波动率计算和价格平滑。 该指标只有一个参数,用于更改“ Calculating price values ”。默认值 1 提供均衡的自动计算, 无需手动配置即可使用。 通过手动更改 2 到 500 之间的值,您可以根据自己的交易系统自定义指标。 建议在 M1 到 H4 的时间周期内使用此指标。适用于任何交易品种。 信号箭头在蜡烛图收盘时生成;不会重绘历史数据。 主图表上提供重复箭头。 提供多种类型的警报。内置的线轨迹计数器基于收盘价工作。这意味着,当出现相反信号时,会确定价格轨迹的数值,并在信号结束后的下一根蜡烛图上显示这些数值。 总计数器将获得的值相加,以便在相应的图表上方便地调整参数。
Auto Optimized Parabolic RSI: 高级 3D 动量引擎 大多数零售指标之所以失效,是因为它们依赖于静态输入,一旦市场波动率发生变化,这些输入就会崩溃。Auto Optimized Parabolic RSI 通过不断重新计算自身的数学优势,解决了“指标衰退”的问题,将机构级别的量化自适应能力直接引入您的 MT5 终端。 核心优势:定制的内存 3D 优化   标准的自动优化器通常会导致 MT5 平台卡顿,因为它们通过标准的指标调用使终端超载。该工具完全绕过了这些性能瓶颈。内部引擎采用定制的原生基于 RAM 的计算器构建,每次加载图表或更改时间周期时,它都会执行极速的 3D 网格搜索。它同时扫描 RSI 周期(频率)、SAR 步长(加速度)和 SAR 最大值(速度限制),在绝对的毫秒级时间内测试数以万计的参数组合,且完全不会拖慢您的平台。它不是仅仅寻找一个“不错”的设置,而是映射整个参数空间,以寻找资产当前动量结构的绝对全局最大值。 严格的财务评分与逼真的交易模拟   与基于抽象“指标点数”进行优化评分的业余工具不同,该引擎的 3.10 版本严格与资金数学挂钩。每
Apollo SR Master
Oleg Rodin
5 (2)
Apollo SR Master 是一款支撑/阻力指标,其特殊功能使利用支撑/阻力区域进行交易更加便捷可靠。该指标通过检测局部价格顶部和底部,实时计算支撑/阻力区域,没有任何时间延迟。为了确认新形成的支撑/阻力区域,该指标会显示特殊信号,表明该支撑/阻力区域可以作为实际的卖出或买入信号。在这种情况下,支撑/阻力区域的强度会增强,因此从该区域进行交易的成功率也会更高。这正是该指标的核心理念。 SR区域也使止损和止盈的操作更加便捷。根据信号方向,可以将SR区域上方或下方的空间用作止损位。此外,相对的SR区域也可以用作潜在的止盈区域。 我还免费向所有 Apollo SR Master 指标的用户提供我的“Apollo 价格行为系统”指标。这两个指标结合使用将帮助您找到更好的入场点。 购买后请联系我,即可免费获得我的交易技巧以及我的“阿波罗价格行为系统”指标作为赠品!
Advanced Currency Strength28 Indicator
Bernhard Schweigert
4.91 (657)
目前40%的折扣 任何新手或专家交易者的最佳解决方案! 这个指标是一个独特的、高质量的、可负担得起的交易工具,因为我们纳入了一些专有的功能和一个新的公式。只需一个图表,你就可以读出28个外汇对的货币强度!想象一下,你的交易将如何得到改善,因为你的交易是在你的手中进行的。想象一下,你的交易将如何改善,因为你能够准确地确定新趋势或剥头皮机会的触发点? 用户手册:点击这里  https://www.mql5.com/en/blogs/post/697384 这是第一本,原版的! 不要买一个毫无价值的崇拜者的克隆品。 特别的 子窗口中的箭头显示强劲的货币势头GAP将指导你的交易! 当基础货币或报价货币处于超卖/超买区域(外盘斐波那契水平)时,在个人图表的主窗口中出现警告信号。 当货币力量从外围区间回落时,回撤/反转警报。 十字星模式的特别警报 可选择多个时间框架,以快速查看趋势! 货币强度线在所有的时间框架中都非常平稳,当使用较高的时间框架来识别总体趋势,然后使用较短的时间框架来确定精确的入口时,效果非常好。你可以根据自己的意愿选择任何时间框架。每个时间框架都由其自身进行了优化。
Currency Strength Exotics
Bernhard Schweigert
4.88 (33)
目前8折优惠! 对任何新手或专家交易者来说都是最好的解决方案! 这个指标是专门用来显示任何符号的货币强度,如异国货币对、商品、指数或期货。它是同类产品中的第一个,任何符号都可以添加到第9行,以显示黄金、白银、石油、DAX、US30、MXN、TRY、CNH等的真实货币强度。这是一个独特的、高质量的、负担得起的交易工具,因为我们已经纳入了一些专有的功能和一个新的公式。想象一下,你的交易将如何改善,因为你能够准确地确定新趋势或剥头皮机会的触发点? 用户手册:点击这里   https://www.mql5.com/en/blogs/post/708876 它适用于所有时间框架。你将很快能够看到TREND! 根据新的基础算法设计,它使识别和确认潜在交易变得更加容易。这是因为它以图形方式显示了8种主要货币和一种符号的强弱。 该指标显示了8种主要货币(澳元加元瑞士法郎欧元英镑日元新西兰美元)的强弱线,再加上一个符号! 该指标显示了符号的真实价值。例如:对于XAUUSD(黄金):价格以美元报价。如果黄金在上涨,你怎么能知道是黄金的强势还是美元的弱势?只有当黄金走强时,我们才会进行交易。该指
BTMM State Engine Pro MT4
Garry James Goodchild
BTMM State Engine Pro is a MetaTrader 4 indicator for traders who use the Beat The Market Maker approach: Asian session context, kill zone timing, level progression, peak formation detection, and a multi-pair scanner from a single chart. It combines cycle state logic with a built-in scanner dashboard so you do not need the same tool on many charts at once. What it does Draws the Asian session range; session times can follow broker server offset or be set in inputs. Tracks level progression (L
- Real price is 80$ - 50% Discount (It is 39$ now) - just for 2 purchases. Contact me for instruction, add group and any questions! - Non-repaint - I just sell my products in Elif Kaya profile, any other websites are stolen old versions, So no any new updates or support. - Lifetime update free Related product:   Bitcoin Expert Introduction The breakout and retest strategy is traded support and resistance levels. it involves price breaking through a previous level.  The break and retest strateg
Atomic Analyst
Issam Kassas
5 (5)
首先值得强调的是,该交易指标是非重绘、非延迟的指标,这使其成为手动和机器人交易的理想选择。 用户手册:设置、输入和策略。 Atomic Analyst是一种PA价格行动指标,利用价格的力量和动量来寻找市场上更好的机会。配备了高级过滤器,可帮助去除噪音和假信号,并提高交易潜力。使用多层复杂的指标,Atomic Analyst扫描图表,并将复杂的数学计算转化为任何初学者都能理解并用来做出一致交易决策的简单信号和颜色。 “Atomic Analyst”是专为新手和经验丰富的交易者量身定制的综合交易解决方案。它将高级指标和一流功能融合为一体的交易策略,使其成为所有类型交易者的多功能选择。 日内交易和剥头皮策略:专为快速准确的日内交易和短期交易而设计。 日内和摆动交易策略:可用作追求价格大幅波动的日内和摆动交易者的可靠工具。 多货币和市场:凭借其可靠的精度,在不同的工具和市场上运作。 多个时间框架:可在多个时间框架上使用,性能良好。 稳定性:所有指标均不重绘、不重绘和不滞后,确保可靠的信号。 信号清晰度:提供箭头信号,用于清晰的入场和出场点。 实时警报:通过交易入场、SL和TP警报通知交易者
Dynamic Forex28 Navigator
Bernhard Schweigert
4.43 (7)
Dynamic Forex28 Navigator - 下一代外汇交易工具。 当前 49% 折扣。 Dynamic Forex28 Navigator 是我们长期流行的指标的演变,将三种功能合二为一: 高级货币强度 28 指标 (695 条评论)+ 高级货币 IMPULSE 带警报 (520 条评论)+ CS28 组合信号(奖励)。 有关指标的详细信息 https://www.mql5.com/en/blogs/post/758844 下一代强度指标提供什么? 您喜欢的原始指标的一切,现在通过新功能和更高的精度进行了增强。 主要特点: 专有货币强度公式。  所有时间范围内的平滑和准确的强度线。 非常适合识别趋势和精确进入。 动态市场斐波那契水平(市场斐波那契)。  此指标独有的独特功能。 斐波那契应用于货币强度,而不是价格图表。 适应实时市场活动以获得准确的反转区域。 实时市场动量。  第 9 行显示市场是活跃还是被动。 对于定时交易至关重要。 全面的警报和显示。  每种货币最强的买入和卖出动量。 ​​28 对的双重动量买入和卖出。 超买/超卖警告外部范围和止损。 反转
TPSpro RFI Levels
Roman Podpora
4.86 (28)
俄语说明 /  英文 说明   -  MT5 版本 主要功能: 显示卖家和买家的活跃区域! 该指标显示所有正确的买入和卖出的初始脉冲水平/区域。当这些水平/区域被激活时,即开始寻找入场点的位置,水平线会改变颜色,并填充特定颜色。此外,还会显示箭头,以便更直观地了解情况。 LOGIC AI - 激活模板时显示用于搜索入口点的区域(圆圈) 为了提高视觉清晰度,添加了使用人工智能搜索入口点的显示区域的功能。 显示更高时间范围内的级别/区域(MTF 模式) 新增使用更高时间间隔显示级别/区域的功能。此外,该指标还具有自动趋势检测功能 (   TPSproTREND PRO   )。 独立的专业分步交易算法 该算法专为顺势和逆势的日内交易而设计。每个活动模板均提供详细的说明。 适用于不同的时间范围 TPSpro RFI 水平指标可用于图表上的任何时间间隔,从分钟(M1)到每月(MN)。 图形和声音警报 该指标提供图形和声音提示,让您不会错过交易信号。 此外,还支持手机通知。 简单有效的活性模板扫描器 这是一个非常紧凑的主动模式扫描仪,当在一个方向上的所有时间间隔内激活模式时,它会自动发出警报并
GOLD Impulse with Alert
Bernhard Schweigert
4.67 (12)
这个指标是我们2个产品 Advanced Currency IMPULSE with ALERT  +   Currency Strength Exotics 的一个超级组合。 它适用于所有时间框架,并以图形方式显示8种主要货币和一种符号的强势或弱势冲动! 该指标专门用于显示任何符号的货币强度加速,如黄金、异国货币对、商品、指数或期货。这是它的第一个指标,任何符号都可以被添加到第9行,以显示黄金、白银、石油、DAX、US30、MXN、TRY、CNH等的真实货币强度加速(冲动或速度)。 建立在新的基础算法上,它使识别和确认潜在的交易更加容易。这是因为它以图形方式显示了一种货币的强势或弱势是否正在加速,并测量了这种加速的速度--把它想象成你汽车中的速度表。当你加速时,事情显然会发生得更快,这在外汇市场上也是一样的,即如果你配对的货币正在向相反的方向加速,你就会发现一个潜在的有利可图的交易。 动态市场斐波那契28水平被用作警报触发器,将适应市场活动。如果冲动击中黄色触发线,你将收到警报。然后你就知道作为一个交易员应该做什么。货币对和方向已经给出。只需点击警报按钮,就可以切换到该货
Cycle Sniper
Elmira Memish
4.39 (36)
Please contact us after your purchase and we will send you the complimentary indicators to complete the system Cycle Sniper is not a holy grail but when you use it in a system which is explained in the videos, you will feel the difference. If you are not willing to focus on the charts designed with Cycle Sniper and other free tools we provide, we recommend not buying this indicator. We recommend watching the videos about the indiactor and system before purchasing. Videos, settings  and descri
KT Alpha Hunter Arrows MT4
KEENBASE SOFTWARE SOLUTIONS
大多数箭头指标只给你一个信号,然后把剩下的判断全部留给你自己。KT Alpha Hunter Arrows 给你的,是一套完整的交易计划。 每一个信号箭头出现时,图表上都会同时绘制完整计划:入场线、止损位、四个止盈目标,以及实时 Edge 结论,告诉你当前品种和时间周期是否值得交易。套装中还包含 Trade Manager EA,在你手动入场后负责后续执行,让你在市场波动和情绪干扰下依然保持纪律。非重绘。只在K线收盘后给出信号。适用于 Forex、黄金、指数,以及你交易的其他任何品种。 核心功能 非重绘买入和卖出箭头,只在K线收盘后出现。 每个信号都带有入场线、结构性止损和四个止盈目标。 Edge Dashboard 会分别评估当前图表上的买入和卖出机会。 结论系统:No Edge、Marginal、Tradeable、Good 或 Strong。 一键 Auto Optimize 按钮,可根据当前品种和时间周期自动调整设置。 完整套装包含 Trade Manager EA,并内置五种专为本指标设计的交易管理方案。 Prop Firm Risk Panel 可在图表上实时追踪日内回撤
Easy Reversal
Mohamed Hassan
Easy Reversal is designed to help traders spot turning points in the market with clear buy and sell signals. The indicator is based on the Keltner Channel but improved with a custom calculation that uses ATR and EMA confirmation. This makes it more reliable and less noisy than standard reversal tools.  The signals from Easy Reversal appear directly from peak candlestick behavior, showing you when price action is reaching exhaustion. A buy signal is generated when a candlestick forms a strong r
Volatility Trend System - a trading system that gives signals for entries. The volatility system gives linear and point signals in the direction of the trend, as well as signals to exit it, without redrawing and delays. The trend indicator monitors the direction of the medium-term trend, shows the direction and its change. The signal indicator is based on changes in volatility and shows market entries. The indicator is equipped with several types of alerts. Can be applied to various trading ins
Linear Trend Predictor — 结合切入点和方向支撑线的趋势指标。按照突破高/低价通道的原理运作。该指标算法过滤市场噪音,考虑波动性和市场动态。 指示器功能  使用平滑方法,显示市场趋势和开立买入或卖出订单的切入点。  适合通过分析任何时间范围内的图表来确定短期和长期的市场走势。  输入参数可适应任何市场和时间范围,允许交易者独立定制指标。  设定的指示信号不会消失,也不会重新绘制——它是在蜡烛收盘时确定的。  几种类型的通知以箭头组合。  该指标既可以作为独立的交易系统使用,也可以作为其他交易系统的补充。  可供任何经验水平的交易者使用。 主要参数 Volatility Smoothing Level - 指标的主要参数,允许您配置指标以实现舒适的操作。 它的数字范围是 1 到 100,从而增加了您可以获得更长趋势运动的平滑度。 通过少量的数字,您可以获得短期走势并快速退出交易。 使用指标进行交易的时刻:  红线和箭头表示下降趋势和卖出开盘信号。止损应根据前一个上分形来设置。  黄线和箭头表示上升趋势和买入开盘信号。止损应根据前一个下分形来设置。
Trend indicator AI
Ramil Minniakhmetov
4.53 (83)
趋势人工智能指标是一个伟大的工具,将加强交易者的市场分析结合趋势识别与可操作的进入点和逆转警报。 该指标使用户能够自信和精确地驾驭外汇市场的复杂性 除了主要信号,趋势Ai指标识别在回调或回调期间出现的次要入口点,使交易者能够利用既定趋势内的价格修正。 重要优势: *MT4及MT5工程 *明确买入或卖出信号 ·不重绘 *适用于所有资产 小心我不卖EA或设置电报它骗局. 所有设置免费在这里的博客。  重要! 购买后立即与我联系,以获得指示和奖金! 真实的操作监控以及我的其他产品可以在这里找到: https://www.mql5.com/en/users/mechanic/seller&nbsp ; 设置和输入: 建议为所有资源设置默认设置。 第...
MBFX Timing
Mohamed Hassan
5 (3)
After purchase, contact me in private to get 7 days of FREE testing with EA Forex Proton where the robot automatically takes the trade alerts from MBFX Timing! MBFX Timing is an indicator that was developed and created by Mostafa Belkhayate, one of the best traders in the world. We decided to create a modified version that takes inspiration from the Stochastic Oscillator and the Relative Strength Quality Index indicators to improve your trading.  One of the main reasons we released MBFX Timing
作者的更多信息
MQLTA Supertrend Multi Timeframe
MQL4 Trading Automation
4.85 (13)
Индикатор MQLTA Supertrend Multi Timeframe сочетает в себе значения Supertrend, найденные на нескольких таймфреймах, чтобы подтвердить тренд пары. Для работы утилиты необходим бесплатный индикатор MQLTA Supertrend Line - https://www.mql5.com/en/market/product/25951. Как он работает? Индикатор проверяет состояние Supertrend на всех выбранных таймфреймах и отображает результат в виде легко читаемой таблицы. Как торговать с помощью индикатора Supertrend Multi Timeframe Покупку следует совершать,
FREE
MQLTA Support Resistance Lines
MQL4 Trading Automation
4.33 (12)
MQLTA Support Resistance Lines is an indicator that calculates the historical levels of Support and Resistance and display them as Lines on chart. It will also Alert you if the price is in a Safe or Dangerous zone to trade and show you the distance to the next level. The indicator is ideal to be used in other Expert Advisor through the iCustom function. This indicator can be tested LIVE on AUDNZD with the following DEMO https://www.mql5.com/en/market/product/26572 How does it work? The indicato
FREE
MQLTA Pattern Detector
MQL4 Trading Automation
Pattern Detector can detect the most common 1, 2 and 3 candlestick patterns and send notifications when detected. Demo version working on AUDNZD can be found https://www.mql5.com/en/market/product/29189 How does it work Add the indicator to the chart you want to analyze and select which patterns to detect, the indicator will draw the detected patterns. You can also be notified via alert, app and email when a new pattern is detected. Parameters Indicator Name - Used to draw the graphical object
FREE
MQLTA One Click Trade Pro
MQL4 Trading Automation
4.6 (10)
One Click Trade Pro is a tool that allows you to open orders with just one click, choosing all the parameters, including the Magic Number! Useful if you want to quickly submit trades specifying also their Magic Number. Other than submitting new orders you can also see the list of orders (with their Magic Number) and change their Stop Loss and Take Profit. The PRO version also allows you to: Open opposite pending orders Setup and submit orders using lines, for a better visualization How does it
FREE
MQLTA Currency Strength Matrix
MQL4 Trading Automation
4.38 (8)
Currency Strength Matrix (CSM) is an indicator that will show you the current strength of the major currencies in several timeframes, allowing you to sort the currencies for strength and spot possible trading setups. This indicator is ideal for scalping and in all those events of sudden big moves. How does it work? The CSM compares the value of the current moving average with the same moving average in the previous candle for all the 28 pairs and all 9 timeframes, producing a Matrix of Strength
FREE
MQLTA Supertrend Line
MQL4 Trading Automation
5 (3)
The Supertrend Line indicator shows you the trend using calculation based on the ATR. How does it work? The Supertrend draws a line following the current trend, this line is the result of calculation made with the ATR. A Line under the candle means a likely bullish trend A Line above the candle means a likely bearish trend How to trade with CSL indicator Buy when the Supertrend line is below the price, Sell when the Supertrend line is above the price. It is strongly suggested to use this indic
FREE
MQLTA Auto Close
MQL4 Trading Automation
5 (4)
Auto Close is an expert advisor that can assist you with your money and risk management rules. The EA can monitor your Balance, Equity, Margin, Global Profit and Global Loss and alert you in case any of these reaches a specified threshold. Free version with limited features can be found https://www.mql5.com/en/market/product/29179 How does it work Load the Auto Close EA in the chart and set the parameters you want to keep monitored. If any of the risk management parameters is met you can be not
FREE
MQLTA Price Line Alert
MQL4 Trading Automation
4.67 (3)
The Price Line Alert Indicator will allow you to set price level that will alert you when hit, the price level will be shown in the chart as lines. Useful to get notified at specific prices, support, resistance, round numbers and so forth. If you want to a similar utility that will automatically close your position at a specific price check https://www.mql5.com/en/market/product/23113 How does it work? You can set several Price Lines and configured them to notify you if the price goes above or
FREE
MQLTA Bollinger Bands Breakout Alert
MQL4 Trading Automation
3.75 (4)
Bollinger Bands Breakout Alert is a simple indicator that can notify you when the price breaks out of the Bollinger Bands. You just need to set the parameters of the Bollinger Bands and how you want to be notified. Parameters: Indicator Name - is used for reference to know where the notifications are from Bands Period - is the period to use to calculate the Bollinger Bands Bands Shift - is the shift to use to calculate the Bollinger Bands Bands Deviation - is the deviation to use to calculate t
FREE
MQLTA Currency Strength Lines
MQL4 Trading Automation
4.88 (8)
The Currency Strength Lines (CSL) indicator is a very useful tool for both beginners and experienced traders. It is able to calculate the strength of single currencies and show them on a chart, so that you can see the trend and spot trading opportunities. How does it work? The CSL Indicator will run calculations on all the 28 pairs, resulting in the overall strength across the market of individual currencies at any given moment. You can use this data to spot currencies that are strong, getting
FREE
MQLTA Parabolic SAR Trailing Stop
MQL4 Trading Automation
4.5 (4)
The Parabolic SAR Trailing Stop will trail the Stop Loss price of your selected orders following the PSAR indicator, so you don't have to worry about having to change it manually. How does it work? The Expert Advisor sets and moves the Stop Loss price of the selected orders following the value of the PSAR Indicator. You can filter the Orders by Symbol Comment Magic Number Buy/Sell Parameters PSAR Step - The Step of the PSAR PSAR Max Step - The Max Step of the PSAR PSAR Shift - The Shift of the
FREE
MQLTA Supertrend Trailing Stop
MQL4 Trading Automation
4.8 (5)
The Supertrend Trailing Stop will trail the Stop Loss price of your selected orders following the Supertrend Line, so you don't have to worry about having to change it manually. MQLTA Supertrend Trailing Stop requires you to install the FREE Indicator Supertrend Line https://www.mql5.com/en/market/product/25951 How does it work? The Expert Advisor sets and moves the Stop Loss price of the selected orders following the value of the Supertrend Line. You can filter the Orders by Symbol Comment Mag
FREE
MQLTA Support Resistance Lines is an indicator that calculates the historical levels of Support and Resistance and display them as Lines on chart. It will also Alert you if the price is in a Safe or Dangerous zone to trade and show you the distance to the next level. The indicator is ideal to be used in other Expert Advisor through the iCustom function. This DEMO only works with AUDNZD, the full product can be found at https://www.mql5.com/en/market/product/26328 How does it work? The indicator
FREE
MQLTA Take Screenshot
MQL4 Trading Automation
4.67 (3)
Утилита MQLTA Take Screenshot позволяет снимать скриншоты текущего графика прямо из самого графика. Утилита полезна для быстрого сохранения интересной ситуации и сохранения текущего графика перед открытием или закрытием ордера. Как она работает? Take Screenshot использует встроенную функцию языка MQL4 для сохранения снимка текущего графика. Как использовать утилиту Загрузите индикатор и выберите нужные параметры. Как только откроется панель, нажмите на значок сохранения, чтобы сделать снимок т
FREE
MQLTA Pattern Detector DEMO
MQL4 Trading Automation
Pattern Detector can detect the most common 1, 2 and 3 candlestick patterns and send notifications when detected. The DEMO version only works on AUDNZD pair. Full product can be found https://www.mql5.com/en/market/product/29190 How does it work Add the indicator to the chart you want to analyze and select which patterns to detect, the indicator will draw the detected patterns. You can also be notified via alert, app and email when a new pattern is detected. Parameters Indicator Name - Used to
FREE
MQLTA Show Magic Numbers
MQL4 Trading Automation
4.14 (7)
The panel displays the list of all orders (market and pending) along with their details, including magic numbers and commentaries. The panel can be moved around the chart. For market orders, the profit listed includes the associated commission and swaps. There aren't any important input parameters, but you can control the panel's initial location via them.
FREE
MQLTA Instrument Details
MQL4 Trading Automation
5 (1)
MQLTA Instrument Details shows you in an easy to read in chart table the details about the instrument/Symbol, including: Label Trade Mode Default Contract Size Minimum Size Maximum Size Size Step Digits Used Tick Size Tick Value Stop Level Bid Ask Spread Parameters Indicator name to create the objects Default Window when opening the indicator Horizontal offset Vertical offset If you like this tool please take a minute to leave a review. If you have suggestions to improve it please send me a mes
FREE
MQLTA Draw Grid
MQL4 Trading Automation
5 (3)
Простая утилита MQLTA Draw Grid поможет вам нарисовать сетку на вашем графике. Она полезна при изучении графика и моделирования сетки. Как она работает? Утилита будет создавать горизонтальные линии в зависимости от заданных параметров Как использовать этот инструмент Установите индикатор на график, выбрав параметры по умолчанию. Выберите начальную точку, значения минимума и максимума диапазона и стиль. В появившейся графической панели вы сможете создавать и удалять сетку, а также изменять неко
FREE
MQLTA Currency Strength Matrix DEMO
MQL4 Trading Automation
2 (2)
Currency Strength Matrix (CSM) is an indicator that will show you the current strength of the major currencies in several timeframes allowing you to sort the currencies for strength and spot possible trading setups. This indicator is ideal for scalping and in all those events of sudden big moves. This DEMO only shows 4 currencies and 4 timeframes, for the full version please check https://www.mql5.com/en/market/product/24252 How does it work? The CSM compares the value of the current moving ave
FREE
MQLTA Time Line Auto Close
MQL4 Trading Automation
5 (1)
Советник Time Line Auto Close (TLAC) позволит вам создавать вертикальные линии (Time Lines, линии времени), которые будут автоматически закрывать все или некоторые из ваших открытых ордеров. Вы можете создавать и управлять несколькими линиями, настроить для каждой из них закрываемые ордера и оповещения. Ордера можно фильтровать по валюте, магическому номеру, номеру ордера и типу ордера. Также можно настроить отправку уведомлений перед активацией линий. Как она работает? С помощью TLAC вы сможет
FREE
MQLTA Auto Close Demo
MQL4 Trading Automation
Auto Close is an expert advisor that can assist you with your money and risk management rules. The EA can monitor your Balance, Equity, Margin, Global Profit and Global Loss and alert you in case any of these reaches a specified threshold. This Demo Version has Notification and Close features disabled, full version can be found https://www.mql5.com/en/market/product/29141 How does it work? Load the Auto Close EA in the chart and set the parameters you want to keep monitored. If any of the risk
FREE
筛选:
Russell K
85
Russell K 2021.05.17 21:18 
 

Good work 👌🏼

idkau
29
idkau 2021.03.24 01:26 
 

Works great

回复评论