BOIS Trend Line Indicator
- 指标
- 版本: 1.6
- 更新: 17 五月 2021
- 激活: 8
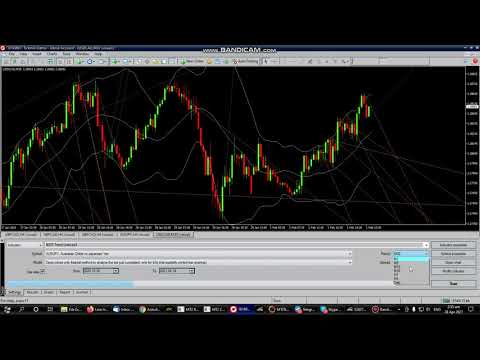
這個獨特的自動趨勢線繪製指示器可在所有時間範圍內運行,可幫助您輕鬆交易短期趨勢反轉以及短期趨勢突破,表明市場上的資產更雄厚。 它獨特地使您可以儘早進入沉重的揮桿動作。 輸入包括:
-Max Candles回顧趨勢線
-線型和顏色
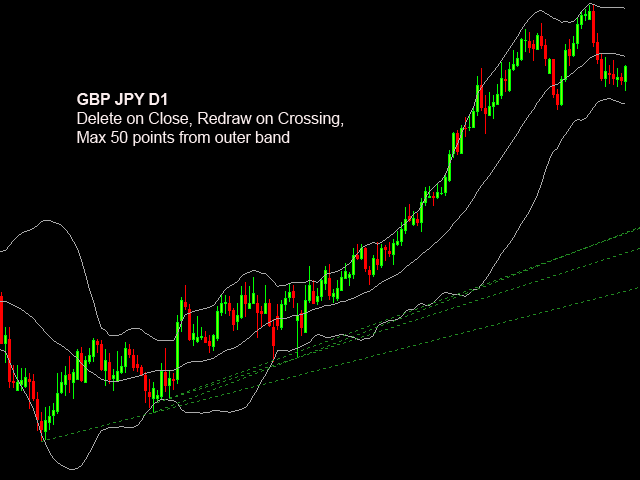
-到外帶和帶週期的最大距離
-當確認蠟燭或價格收盤時,自動重新繪製趨勢線偏離樞軸的選項較低,較低或較高的高位(雙底低位和高支撐位)和最大蠟燭數以進行重新繪製。
-4個換行選項:
1)價格跌破線時刪除
2)不要刪除
3)燭線超出界限時刪除
4)在趨勢關閉時刪除
This unique auto trend line drawing indicator works on all time frames which can help you to easily trade short term trend reversals as well as as well as short term trend breakouts indicating the stronger asset in the market. It uniquely allows you to get in EARLY for heavy swings. Inputs include:
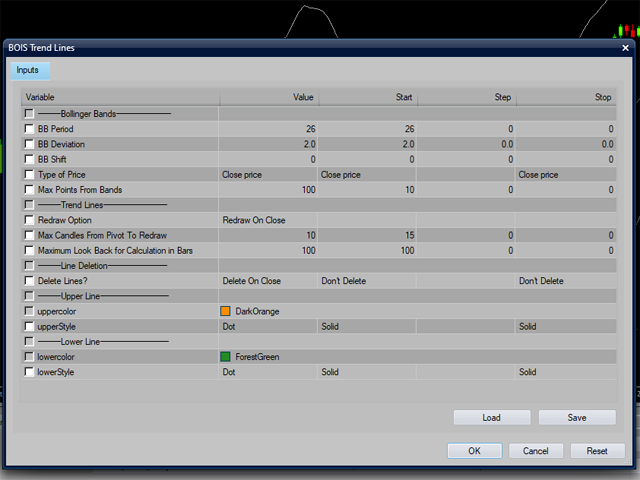
- Max Candles Look Back for Trend Lines
- Line Type and Color
- Max Distance to Outer Band and Band Period
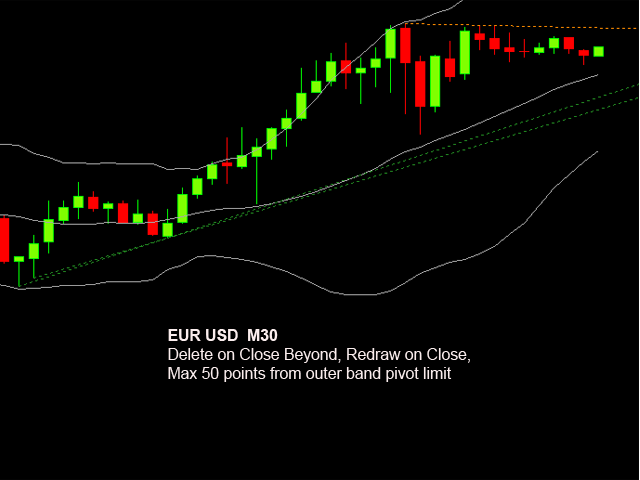
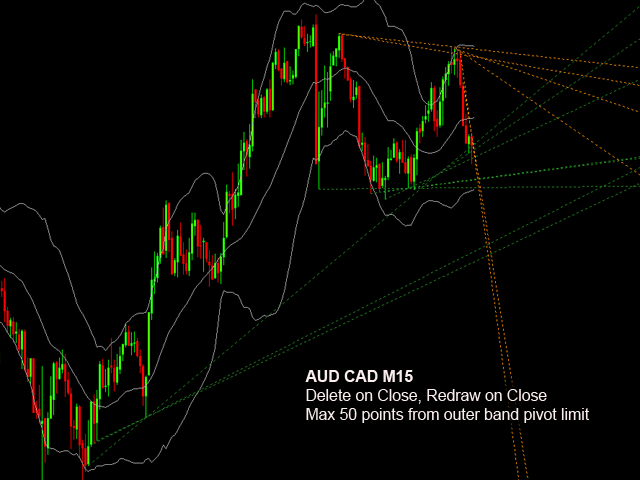
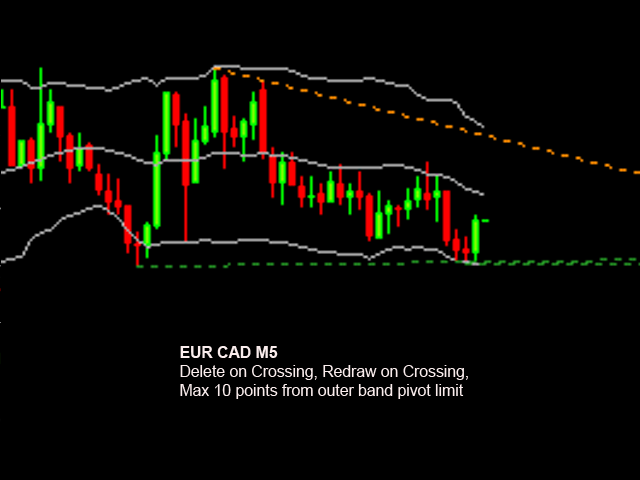
- Options to Auto Re-Draw Trend Line off of the Pivot When a Confirmation Candle or Price Closes Lower low or Higher High (double bottom low and high support) and # of candles max for re-draw.
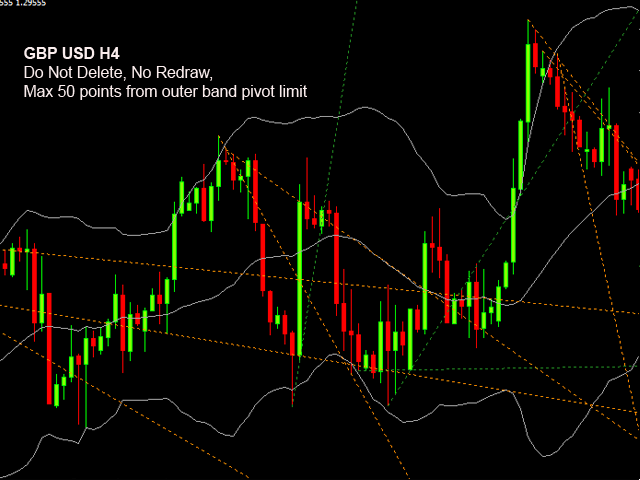
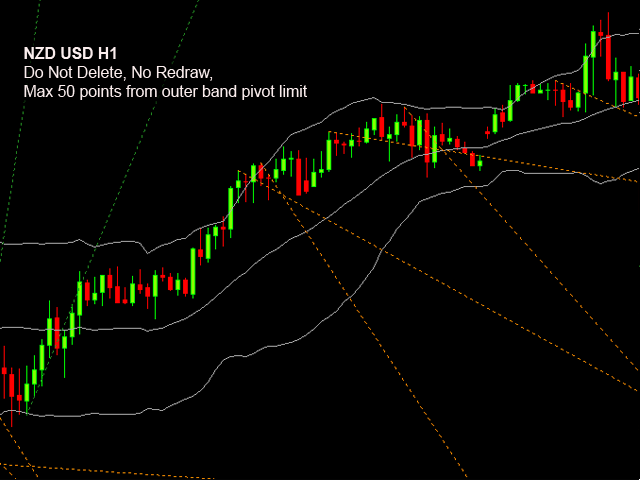
- 4 Options for Line Breaks:
1) Delete When Price Breaks Line
2) Do Not Delete
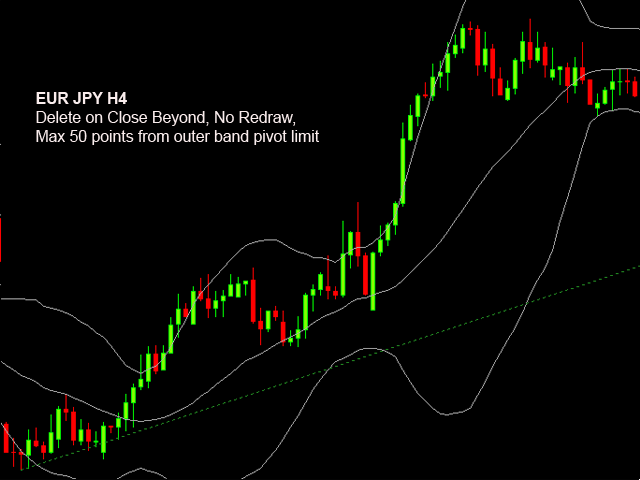
3) Delete When Candle Closes Beyond Line
4) Delete on Close Against Trend
-Max Candles回顧趨勢線
-線型和顏色
-到外帶和帶週期的最大距離
-當確認蠟燭或價格收盤時,自動重新繪製趨勢線偏離樞軸的選項較低,較低或較高的高位(雙底低位和高支撐位)和最大蠟燭數以進行重新繪製。
-4個換行選項:
1)價格跌破線時刪除
2)不要刪除
3)燭線超出界限時刪除
4)在趨勢關閉時刪除
This unique auto trend line drawing indicator works on all time frames which can help you to easily trade short term trend reversals as well as as well as short term trend breakouts indicating the stronger asset in the market. It uniquely allows you to get in EARLY for heavy swings. Inputs include:
- Max Candles Look Back for Trend Lines
- Line Type and Color
- Max Distance to Outer Band and Band Period
- Options to Auto Re-Draw Trend Line off of the Pivot When a Confirmation Candle or Price Closes Lower low or Higher High (double bottom low and high support) and # of candles max for re-draw.
- 4 Options for Line Breaks:
1) Delete When Price Breaks Line
2) Do Not Delete
3) Delete When Candle Closes Beyond Line
4) Delete on Close Against Trend