Boost binary option profesional

⚡ Binarias & Forex (+90% Ratio-Win Next Candle)
  • Espere que el precio llegue a una buena zona (fuerte) sea soporte, resistencia, zona de oferta o demanda, fibonacci level key, cifra redonda.
  • Haciendo lo anterior definitivamente habrá una reversión en el precio y obtendrá su ITM en primera vela dando una efectividad del 100% siguiendo la tendencia.
  • Es muy importante estar atento a las noticias fundamentales en el mercado y estas no afecten tu trading.
  • Sesiones comerciales: cualquiera (24 horas).
  • Pares de divisas: cualquiera.
  • Plazo de trabajo: M1 / ​​M5 2 / M15 / M30 / H1 / H4.
  • Tiempo de caducidad: 1-2-3-5-15 minutos (Binarias).
  • Tiempo de caducidad: 5-15-1H-4H  (Forex).

👍Ventajas

  • Fácil de configurar e instalar.
  • Apto para principiantes y profesionales.
  • Puede funcionar con cualquier instrumento financiero (Forex, Crypto, CFD, Futures, Metals).
  • Se puede testear en el probador de estrategias.
  • Puede operar en cualquier período de tiempo.
  • Tiene múltiples modos de negociación: con la tendencia y contra la tendencia.
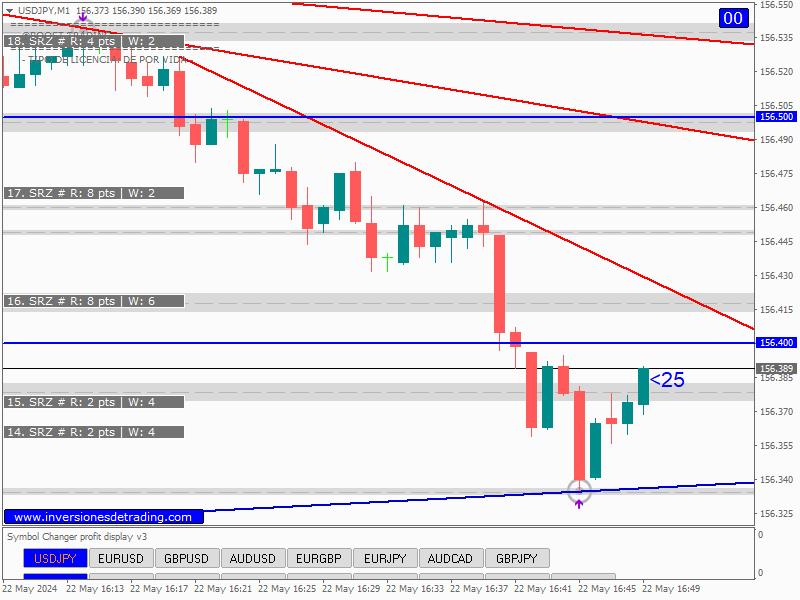
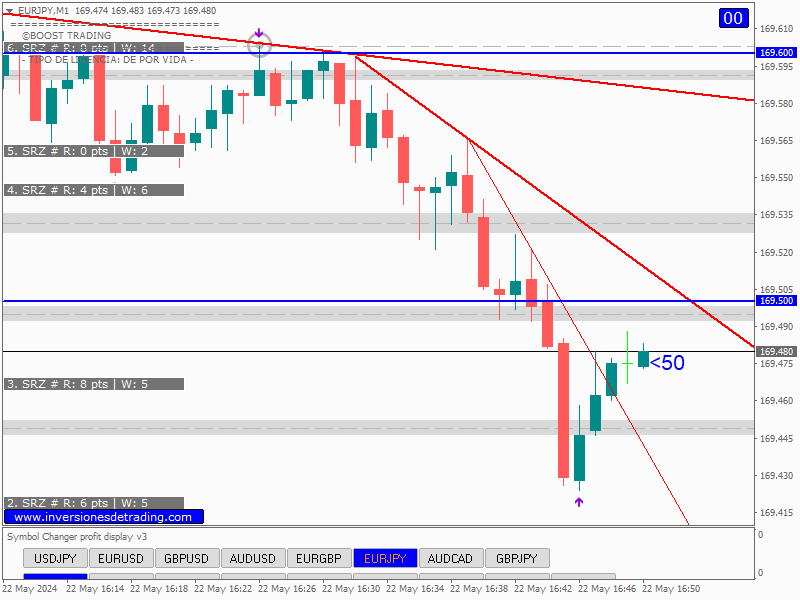
  • Identifica soportes y resistencias e ingresa después de la señal
  • Posee alerta en ventana para entrar en la siguiente vela.
  • Puedes notificar directamente a tu teléfono celular.

    Alguna pregunta? TELEGRAM PERSONAL
    Valor incluye todos los indicadores que se ven en las fotos más el template para forex y binarias


    推荐产品
    PTW NON REPAINT TRADING SYSTEM + HISTOGRAM Non-Repainting ,   Non-Redrawing   and   Non-Lagging  Trading System. Does the following: - Gives Accurate Entry and Exit Points - Scalping, Day and Swing Trading  - 95% Accuracy  - Targets, where to take profits. - Shows Trends, Support and resistance levels - Works on All Brokers - Works on All Currencies, CFDs and Stocks - It does not place trades for you, it only shows you what trades to place. - It works on All Timeframes - It is for Trend or ran
    Super Ichi
    Sinan Durkan
    What is the Super Ichi Indicator? Super Ichi is an advanced combination of Ichimoku Kinko Hyo and SuperTrend indicators. This powerful technical analysis tool is designed to identify market trends and generate trading signals. What Does It Do? Dual-Level Trend Analysis : Uses customized versions of Tenkan-sen and Kijun-sen lines Automatic Signal Generation : Displays visual markers (arrows) at crossover points Real-Time Alert System : Provides audio and visual alerts when new signals occur Dynam
    FREE
    Quantum Frequency Indicator (QFI) The World’s First Universal Market Frequency Analyzer for MT4 Trade Forex, Crypto, and Stocks With Up To 98% Accuracy Discover the Indicator That Decodes the Hidden Frequency of the Market After 14 years of research into market vibration and frequency science, a revolutionary breakthrough has arrived. The Quantum Frequency Indicator (QFI) reads the internal frequency of any financial market and generates ultra-precise Buy & Sell signals—before major moves
    Work Stations
    Maryna Shulzhenko
    Forex Workstation   is a powerful and efficient Forex trading bot designed to use patterns, price hold levels, volatility analysis and market scaling. This bot offers unique capabilities for automated trading and optimization of strategies on various currency pairs. Let's look at the main functions and settings of Forex Workstation: Main functions: • Multicurrency: Forex Workstation supports a wide range of currency pairs, which allows you to diversify your portfolio and distribute risks. • Usin
    Pyro Trend
    Oleksii Ferbei
    Pyro Trend is a new product that allows you to identify the current market phase (uptrend, downtrend or flat). The indicator is applicable for any data and periods. The middle of the trend wave, as well as the edges, are places of special heat and market behavior; when writing the indicator, an attempt was made to implement precisely finding the middle. Pyro Trend is a trend indicator that uses an original calculation algorithm. This indicator paints arrows in different colors depending on the
    为您介绍MQL4的Donchian通道指标,这是一个强大的技术分析工具,旨在提升您的交易成功率。该指标由四条线组成,代表了在指定时期内价格运动的上限和下限。 通过Donchian通道指标,您可以轻松识别市场潜在的突破和反转。上线显示指定时期内的最高点,而下线代表最低点。这两条线之间的空间形成一个通道,为您提供了有关资产交易价格范围的有价值见解。 但这还不是全部 - 我们进一步改进了这个令人难以置信的指标。我们的修改允许您按照一定百分比(表示为'shadowTop'和'shadowBottom')减小通道宽度。通过缩小通道,您可以更敏锐地感知价格波动,并准确定位入场和出场点。 无论您是经验丰富的交易者还是初学者,带有减小通道宽度的Donchian通道指标都是您交易工具箱中必备的工具。它能够让您基于市场波动和价格行为做出明智的决策。 不要错过将您的交易推向新高度的机会。体验带有减小通道宽度的Donchian通道指标的强大功能,释放您的交易潜力吧。
    At the core of the VidyaPearsonFlow Robot lies the synthesis of two key principles : a daptive filtration of market noise and statistical analysis of correlations between major Forex pairs such as EURUSD, GBPUSD, and XAUUSD. This is not merely an algorithm—it is a system that embodies the harmony of mathematical rigor and the flexibility required to operate in the ever-changing market environment. The Essence of the Method: Adaptive Filtration: The system dynamically adjusts to changing market
    BinaryMartini
    Abdulkarim Karazon
    индикатор для бинарной торговли, основанный на пересечении 3MA с macd, он дает сигналы на покупку и продажу при открытии бара и не перерисовывается и не перерисовывается Индикатор не ориентирован на высокий процент выигрышей, поскольку он создан для торговли по мартингейлу, индикатор ориентирован на наименьшее количество проигрышных сигналов подряд. Стратегия: Минимальный депозит 1000 юнит, торговлю начинаем с 1 юнит (размер сделки 1 юнит на каждые 1000 капитала) мы удваиваем размер сделки по сл
    Valiant Strong Trend
    Muhammed Emin Ugur
    " Valiant Strong Trend " - Your Ultimate MT4 Signal Indicator Are you ready to elevate your trading game to new heights? Look no further than the "Valiant Strong Trend" MT4 signal indicator, your indispensable tool for navigating the complex world of financial markets. Key Features: Precise Trend Identification : "Valiant Strong Trend" employs advanced algorithms to accurately identify market trends, whether they are bullish or bearish. Say goodbye to guesswork and hello to informed trading deci
    ATC AlgoZone Indicator
    Ameur Boudenne
    5 (2)
    Algo Trading Indicaor  With this indicator , you’ll have zones and trends that hight probability the price will reverse from it. so will gives you all the help that you need  Why should you join us !?  1-This indicator is logical since it’s working in previous days movement , to predict the future movements. 2-Algo trading indicator will help you to draw trends which is special and are too strong than the basics trend , trends will change with the frame time that you work on . 3-We can use
    這個獨特的自動趨勢線繪製指示器可在所有時間範圍內運行,可幫助您輕鬆交易短期趨勢反轉以及短期趨勢突破,表明市場上的資產更雄厚。 它獨特地使您可以儘早進入沉重的揮桿動作。 輸入包括: -Max Candles回顧趨勢線 -線型和顏色 -到外帶和帶週期的最大距離 -當確認蠟燭或價格收盤時,自動重新繪製趨勢線偏離樞軸的選項較低,較低或較高的高位(雙底低位和高支撐位)和最大蠟燭數以進行重新繪製。 -4個換行選項: 1)價格跌破線時刪除 2)不要刪除 3)燭線超出界限時刪除 4)在趨勢關閉時刪除 This unique auto trend line drawing indicator works on all time frames which can help you to easily trade short term trend reversals as well as  as well as short term trend breakouts indicating the stronger asset in the market. It uniquely allows you to
    The indicator scans for TD Combo signals in multiple timeframes for the all markets filtered and shows the results on Dashboard. Key Features Dashboard can be used for all markets It can scan for signals on MN1, W1, D1, H4, H1, M30, M15 ,M5, M1 timeframes Parameters UseMarketWatch: Set true to copy all symbols available in market watch MarketWatchCount : Set the number of symbols that you want to copy from the market watch list. CustomSymbols: Enter the custom symbols that you want to be availa
    Evoque Global
    Muhammad Mubashir Mirza
    Evoque Global – Reliable Automated Hedging The price will keep increasing by $100 with every  single purchase, so don't be late. Evoque Global   offers a hands-free, adaptive trading solution designed to deliver consistent profits with controlled risk. Using a smart hedging approach, it balances trades to reduce drawdowns and maximize smooth equity growth. This expert advisor works seamlessly in all market conditions—trending or ranging—automatically managing entries, exits, and trade sizes wit
    Please contact me at telegram  https://t.me/smartforex7 After purchasing SmartForex Indicator then Use This Indicator...................... SMART EXIT PROFIT LINE Indicator is very Helpful with SmartForex Indicator ........................................ SMART EXIT PROFIT LINE Indicator Attach with SmartForex Indicator after then Red Line Show Exit buy Profit , Green Line show Exit Sell Profit................
    FREE
    Aureus Quantum Surge
    Ren Cheng Yao
    5 (1)
    释放Aureus Quantum Surge-H1的黄金自动交易潜力 Limited Time Offer: Special Offer: Current Price $799 (Limited Time)! Next price: $899 真实账户信号地址: https://www.mql5.com/en/signals/2297864?source=Site+Profile+Seller  Aureus Quantum Surge-H1是一款尖端的专家顾问(EA),专为在H1时间框架内交易XAUUSD(黄金)而设计。它结合了多种技术指标和稳健的风险管理策略,在动荡的黄金市场中提供持续的表现。 关于EA: Aureus Quantum Surge-H1在2003年至2018年期间经过严格的开发和优化,采用了4-6个阶段的渐进式正向优化方法。该方法确保了出色的稳健性,避免了过度优化,使其在真实交易环境中高度可靠。此外,自2020年之前,EA已在实时环境中运行,您可以信赖其性能,而无需担心“线性”回测结果或数据造假。 主要特点 高级多指标策略 利用Ichimoku云图、MAC
    1.根据图表周期,确定趋势大小。在一段行情内最高价附近,为上涨趋势。在一段行情内最低价附近,为下跌趋势。 2. 趋势确立后,下一步就是确定短期趋势的超买和超卖。 超卖、多头;  超买,做空。   3.  根据超买和超卖以及利润点进行平仓。  实盘信号: https://www.mql5.com/zh/signals/1538661?source=Site+Signals+My EA 设置: 您需要把EA加载到要交易的货币对上(M15 时间范围) 现好的货币对: EURUSD,GBPUSD,GBPJPY,USDJPY,XAGUSD,GBPAUD 使用此EA,请是使用ECN账号。 可以使用我推荐的货币对,也可以使用其他货币对。 信号上100使用0.01手,建议使用更高的资金降低风险。 推荐杠杆 1:200 或更高 可以使用参数列表里内置的参数,也可以自定义参数。 参数设置: Applicable_Symbol - 表现最好的货币品种  cycle_time - 加载图表周期 Built_in_parameters - 选择内置的货币参数或选择自定义参数 Lot - 开单手数 AutoLo
    KT Psar Arrows
    KEENBASE SOFTWARE SOLUTIONS
    KT Psar Arrows使用标准的抛物线转向指标(Parabolic SAR)在图表上绘制箭头。当蜡烛的最高点触及SAR时绘制看涨箭头;当蜡烛的最低点触及SAR时绘制看跌箭头。信号在实时生成,无需等待K线收盘。  特点 对于想要基于抛物线SAR指标开发交易策略的交易者来说,这是一个非常有用的工具。  可以用于寻找市场中的转折点。 支持自定义PSAR参数输入。 提供所有MT4的提醒功能。 注意事项:抛物线SAR是一个滞后且严格机械化的指标。每一笔潜在交易都应该通过明确定义的规则进行筛选。     输入参数 PSAR步长:输入步长值。 PSAR最大值:输入最大值。 显示PSAR点:显示/隐藏PSAR点。即使不显示PSAR点,箭头功能也能正常工作。 其余输入项均为直观设置,无需特别说明。
    ROC acceleration-deceleration is the manual system for medium-term scalping. Indicator based on custom ROC system which defines bullish/bearish market and especially  acceleration-deceleration of tendention in the market's main direction. Buy arrow is plotted during bearish market when current trend decelerates and sell  arrow is plotted during bullish market when current trend decelerates. Main Indicator's Features Signals are not repaint,non-late or disappear(exept cases when system recalculat
    This is the  FXTraderariel Hedgefond Indicator - the best indicator we ever created.  It shows different levels which are also used by institutional traders. The indicators shows potential Take Profit Targets. Depending on the settings and trading style, it can be used for  scalping  or  long-term trading . The indicator can be used on every  time frame , but we advise to use it on  , H4 and D1 . Especially if you are a novice trader.  Pro Traders  can also you use it for scalping in smaller tim
    CCI Phases Indicator
    Ihab Mohamed Kamal Fouda
    Introduction  The Commodity Channel Index, commonly known as the CCI, is a versatile indicator used by traders and investors to identify cyclical trends in commodities, stocks, and other securities. It was developed by Donald Lambert in 1980, primarily for commodity trading, but has since found widespread application in various financial markets. The CCI is particularly favored for its ability to gauge overbought and oversold levels in price movements. Historical Background  Donald Lambert, the
    Dear Trader It is my pleasure to introduce to you my tool called the " Forex Sniper Indicator" . The major aim of this tool is to help serious traders and investors in all type of Financial Markets to catch price next movement right at the moment the price direction is about to change. This tool can be used to snipe the price direction in both down trend, uptrend and ranging markets. This tool can be used as the stand alone tool though it may be combined with other tools as well. My goal is to h
    EMA Dashboard
    Chantal Sala
    1 (1)
    Ema Dashboard is an innovative dashboard that allows you to monitor Moving Average on multiples symbols and different timeframes. This dashboard allows you to analyze information on 28 pairs on an unique chart. Its functionality includes analysis of All Time Frames. This configuration allows you to identify the Long Term Trend with extreme ease. This panel allows you to take very important directional movements. A click on button opens a new chart (symbol and timeframe). Graphic Object Symbol l
    TDI Signals
    Navdeep Singh
    TDI Signals generates buy and sell arrows based on a TDI(Traders Dynamic Index) algorithm. It looks for price breakouts, continuations and reversals. By default it runs in the trend mode but user is provided with the option to change that to reversal mode. Trader can use the mode which compliments his/her trading style.  Usage:-   TDI Signals can be used as a stand alone indicator with context or even be added to strategies to make confirmations more strong. Volatility based stop loss, take pro
    EZT Trend
    Tibor Rituper
    4.67 (3)
    EZT 趋势指标将向您显示趋势、回调和入场机会。 提供可选的过滤和所有类型的警报。 添加电子邮件和推送通知警报。 我们还在开发基于该指标的 EA,即将推出。 它是一个多功能指标,由两个颜色直方图和一条线组成。 它是趋势方向和强度的直观表示,您也可以在线上或直方图上多次发现背离。 该指标与自动参数设置配合良好。 这些是针对给定时间范围预先确定的,我们建议使用具有该设置的指标。 在手动模式下,您可以设置自己的参数。 这是一个多时间框架 (mtf) 指标。 该指标与我们的其他指标(例如 MTF rsi 或 MTF cci 或 MACD pro)组合起来效果很好。 交易工具的波动性越大,您寻找最佳入场机会的时间范围就越小。 始终考虑更高的时间范围方向! 为此,您应该使用更多指标实例。 输入 参数模式:可选择“手动参数”或预设的“自动参数”。 自动参数处于多时间范围模式。 示例:当您设置自动 H1 参数时:您可以看到从 H1 时间范围一直到 1 分钟的相同显示。 在此设置中,指标不会在更高的时间范围(例如 H4 或更大)上显示。 手动时间范围:当在第一个菜单中选择手动参数时,您
    Linear Trend Predictor — 结合切入点和方向支撑线的趋势指标。按照突破高/低价通道的原理运作。该指标算法过滤市场噪音,考虑波动性和市场动态。 指示器功能  使用平滑方法,显示市场趋势和开立买入或卖出订单的切入点。  适合通过分析任何时间范围内的图表来确定短期和长期的市场走势。  输入参数可适应任何市场和时间范围,允许交易者独立定制指标。  设定的指示信号不会消失,也不会重新绘制——它是在蜡烛收盘时确定的。  几种类型的通知以箭头组合。  该指标既可以作为独立的交易系统使用,也可以作为其他交易系统的补充。  可供任何经验水平的交易者使用。 主要参数 Volatility Smoothing Level - 指标的主要参数,允许您配置指标以实现舒适的操作。 它的数字范围是 1 到 100,从而增加了您可以获得更长趋势运动的平滑度。 通过少量的数字,您可以获得短期走势并快速退出交易。 使用指标进行交易的时刻:  红线和箭头表示下降趋势和卖出开盘信号。止损应根据前一个上分形来设置。  黄线和箭头表示上升趋势和买入开盘信号。止损应根据前一个下分形来设置。
    I will support only my client. สำหรับลูกค้า Parameters General Trade Settings Money Management  Lot : Fixed (can change) Strategies  - H4 Strategies it is fixed with MA, Bollinger band, Candlestick Levels Close Functions  - H4 Strategies MagicNumber  - individual magic number. The EA will only manage position of the chart symbol with this magic number. NextOpenTradeAfterMinutes  - 15 minutes is default, can change it MaxSpread  - upto currency pairs, MaxSlippage  - upto currency pairs, Push No
    Trend Pulse One
    Adolfina Denysenko
    Trend Pulse One is a new generation indicator based on an improved version of Parabolic SAR, supplemented with arrow signals. Its purpose is to simplify the process of trend analysis and provide the trader with clear, visually understandable entry and exit points. The main difference from the standard SAR is that Trend Pulse supplements the SAR lines with arrows that signal a change in trend direction. This makes the indicator convenient for visual analysis and application in real trading.
    Description I think, almost all traders dream about non-lagging MA. I have realized that dream in my indicator. It allows forecasting future MA values! The indicator can be used in four different ways: The first one - forecast for the desired amount of bars. Thus, you are able to evaluate future price behavior. The second one - generating non-lagging "averages". That can be implemented by moving MA back by the half of the averaging period and setting the forecast the necessary amount of bars ahe
    FREE
    Fibonacci CSM
    Emir Revolledo
    Fibonacci Currency Strength Meter (FCSM) Early Access Sale!! This new product is still in the process of adding new features and settings. For early bird buyers. The Price will be 50% Sale. In a few weeks, the product will be done. Go Grab your copy while it's still cheap. More details will be added soon. Things to be added. Alert Levels Mobile and Email Alert From it's name, Fibonacci Currency Strength Meter is a combination of Fibonacci levels and Currency Strength Meter. The plot of Fibona
    该产品的买家也购买
    Rtc ML Ai Predictor MT4
    Muhammad Faisal Sagala
    Product Description Rtc ML Ai Predictor — Futuristic Intelligence for Real-Time Market Decisions Bring robotic precision to your trading.   Rtc ML Ai Predictor   fuses   Machine Learning   with   SMA-shift dynamics   to forecast short-term momentum and trend inflection points with clarity. The model evaluates multi-factor market structure, assigns a   confidence score   to each signal, and lets you act only when conditions align with your rules. Why traders choose Rtc ML Ai Predictor AI-guided e
    BinaryUniversal
    Andrey Spiridonov
    BinaryUniversal is a signal indicator for binary options and Forex. In its work, the indicator uses a complex algorithm for generating signals. Before forming a signal, the indicator analyzes volatility, candlestick patterns, important support and resistance levels. The indicator has the ability to adjust the accuracy of the signals, which makes it possible to apply this indicator for both aggressive and conservative trading. The indicator is set in the usual way, it works on any time period and
    FFx Engulfing Setup Alerter gives trade suggestions with Entry, Target 1, Target 2 and StopLoss. Below are the different options available: Entry suggestion - pips to be added over the break for the entry 3 different options to calculate the SL - by pips, by ATR multiplier or at the pattern High/Low 3 different options to calculate the 2 TPs - by pips, by ATR multiplier or at Risk/Reward Offset the dashboard - any place on the chart Remove the suggestion once the price reached the SL line Lines
    FFx InsideBar Setup Alerter gives trade suggestions with Entry, Target 1, Target 2 and StopLoss. Below are the different options available: Entry suggestion - pips to be added over the break for the entry Minimum candle size - to avoid too close buy/sell entry suggestions 3 different options to calculate the SL - by pips, by ATR multiplier or at the pattern High/Low 3 different options to calculate the 2 TPs - by pips, by ATR multiplier or at Risk/Reward Offset the dashboard - any place on the c
    FFx OutsideBar Setup Alerter gives trade suggestions with Entry, Target 1, Target 2 and StopLoss. Below are the different options available: Entry suggestion - pips to be added over the break for the entry. 3 different options to calculate the SL - by pips, by ATR multiplier or at the pattern High/Low. 3 different options to calculate the 2 TPs - by pips, by ATR multiplier or at Risk/Reward. Offset the dashboard - any place on the chart. Remove the suggestion once the price reached the SL line.
    FFx PinBar Setup Alerter gives trade suggestions with Entry, Target 1, Target 2 and StopLoss. Below are the different options available: Entry suggestion - pips to be added over the break for the entry Minimum candle size - to avoid too small candles 3 different options to calculate the SL - by pips, by ATR multiplier or at the pattern High/Low 3 different options to calculate the 2 TPs - by pips, by ATR multiplier or at Risk/Reward Offset the dashboard - any place on the chart Remove the sugges
    FFx MACD Divergences
    Eric Venturi-Bloxs
    The purpose of this new version of the MT4 standard indicator provided in your platform is to display in a sub-window multiple timeframes of the same indicator with its divergences. See the example shown in the picture below. But the display isn't like a simple MTF indicator. This is the real display of the indicator on its timeframe. Here's the options available in the FFx divergences indicator: Select the timeframes to be displayed (M1 to Monthly) Define the width (number of bars) for each tim
    The purpose of this new version of the MT4 standard indicator provided in your platform is to display in a sub-window multiple timeframes of the same indicator with its divergences. See the example shown in the picture below. But the display isn't like a simple MTF indicator. This is the real display of the indicator on its timeframe. Here's the options available in the FFx divergences indicator: Select the timeframes to be displayed (M1 to Monthly) Define the width (number of bars) for each tim
    FFx RSI Divergences
    Eric Venturi-Bloxs
    The purpose of this new version of the MT4 standard indicator provided in your platform is to display in a sub-window multiple timeframes of the same indicator with its divergences. See the example shown in the picture below. But the display isn't like a simple MTF indicator. This is the real display of the indicator on its timeframe. Here's the options available in the FFx divergences indicator: Select the timeframes to be displayed (M1 to Monthly) Define the width (number of bars) for each tim
    FFx CCI Divergences
    Eric Venturi-Bloxs
    The purpose of this new version of the MT4 standard indicator provided in your platform is to display in a sub-window multiple timeframes of the same indicator with its divergences. See the example shown in the picture below. But the display isn't like a simple MTF indicator. This is the real display of the indicator on its timeframe. Here's the options available in the FFx divergences indicator: Select the timeframes to be displayed (M1 to Monthly). Define the width (number of bars) for each ti
    The purpose of this new version of the MT4 standard indicator provided in your platform is to display in a sub-window multiple timeframes of the same indicator with its divergences. See the example shown in the picture below. But the display isn't like a simple MTF indicator. This is the real display of the indicator on its timeframe. Here's the options available in the FFx divergences indicator: Select the timeframes to be displayed (M1 to Monthly). Define the width (number of bars) for each ti
    The FFx Dashboard MTF alerter will show you on a single chart all the timeframes (M1 to Monthly) with their own status for the indicator. 2 Alert Options: Single timeframe: each selected timeframe alert separately when a signal occurs Multi timeframes: all selected timeframes must agree for an alert to be triggered Both options have an input to select the timeframes to be used for the alert(s). How to Understand the Status: Green/Red square: histogram above/below 0 line Green square + Red bord
    The FFx Dashboard MTF alerter will show you on a single chart all the timeframes (M1 to Monthly) with their own status for the indicator. 2 Alert Options: Single timeframe: each selected timeframe alert separately when a signal occurs Multi timeframes: all selected timeframes must agree for an alert to be triggered Both options have an input to select the timeframes to be used for the alert(s). How to understand the status: Green/Red square: RSI above/below 50 line Green square + Red border: R
    The FFx Dashboard MTF alerter will show you on a single chart all the timeframes (M1 to Monthly) with their own status for the indicator. 2 Alert Options: Single timeframe: each selected timeframe alert separately when a signal occurs Multi timeframes: all selected timeframes must agree for an alert to be triggered Both options have an input to select the timeframes to be used for the alert(s). How to understand the status: Green/Red square: Stoch above/below 50 line Green square + Red border:
    The FFx Dashboard MTF alerter will show you on a single chart all the timeframes (M1 to Monthly) with their own status for the indicator. 2 Alert Options: Single timeframe: each selected timeframe alert separately when a signal occurs Multi timeframes: all selected timeframes must agree for an alert to be triggered Both options have an input to select the timeframes to be used for the alert(s). How to understand the status: Green/Red square: Price above/below Cloud (Kumo) Green square + Red bo
    The FFx Dashboard MTF alerter will show you on a single chart all the timeframes (M1 to Monthly) with their own status for the indicator. 2 Alert Options: Single timeframe: each selected timeframe alert separately when a signal occurs Multi timeframes: all selected timeframes must agree for an alert to be triggered Both options have an input to select the timeframes to be used for the alert(s). How to understand the status: Green/Red square: MA pointing Up/Down Green square + Red border: MA po
    The FFx Dashboard MTF alerter will show you on a single chart all the timeframes (M1 to Monthly) with their own status for the indicator. 2 Alert Options: Single timeframe: each selected timeframe alert separately when a signal occurs. Multi timeframes: all selected timeframes must agree for an alert to be triggered. Both options have an input to select the timeframes to be used for the alert(s). How to understand the status: Green square: Price above PSAR Red square: Price below PSAR Options
    The FFx Dashboard MTF alerter will show you on a single chart all the timeframes (M1 to Monthly) with their own status for the indicator. 2 Alert Options: Single timeframe: each selected timeframe alert separately when a signal occurs Multi timeframes: all selected timeframes must agree for an alert to be triggered Both options have an input to select the timeframes to be used for the alert(s). How to understand the status: Green/Red square: CCI above/below levels (ie. 100/-100) Grey square: C
    The FFx Dashboard MTF alerter will show you on a single chart all the timeframes (M1 to Monthly) with their own status for the indicator. 2 Alert Options: Single timeframe: each selected timeframe alert separately when a signal occurs Multi timeframes: all selected timeframes must agree for an alert to be triggered Both options have an input to select the timeframes to be used for the alert(s). How to understand the status: Green/Red square: ADX above level Grey square: ADX below level Red bor
    The FFx Dashboard MTF alerter will show you on a single chart all the timeframes (M1 to Monthly) with their own status. 2 Alert Options: Single timeframe: each selected timeframe alert separately when a signal occurs Multi timeframes: all selected timeframes must agree for an alert to be triggered Both options have an input to select the timeframes to be used for the alert(s). How to understand the status: Green/Red square: bullish/bearish candle Options available in the FFx Dashboard Alerter
    THE GRAFF III
    Antonin Skaryd
    The [GRAFF] III manual trading system is based on multiple MetaTrader (MT4) indicators. Together, the entire PACK of GRAFF III indicators makes an advanced trading tool. The system consists of over 20 different custom-built indicators which have been carefully selected and tested in the long term to produce strong and efficient trading signals. The particular indicators are based on different mathematical formulas, so the entire system is calibrated to remove false signals from its own indicator
    FFx Universal Strength Meter PRO is more than a basic strength meter. Instead of limiting the calculation to price, it can be based on any of the 19 integrated strength modes + 9 timeframes. With the FFx USM, you are able to define any period for any combination of timeframes. For example, you can set the dashboard for the last 10 candles for M15-H1-H4… Full flexibility! Very easy to interpret... It gives a great idea about which currency is weak and which is strong, so you can find the best pai
    Pan PrizMA CD Phase is an analogue of the МetaТrader 5 indicator , and is an option based on the Pan PrizMA indicator. Details . Averaging by a quadric-quartic polynomial increases the smoothness of lines, adds momentum and rhythm. Extrapolation by the sinusoid function near a constant allows adjusting the delay or lead of signals. The value of the phase - wave status parameter (which is close in meaning to the trigonometric phase or the angle of the radius-vector rotation in the trigonometric p
    Ticks Size
    Viktor Kolmakov
    This indicator displays in a separate window the difference between the number of points which increased the price, and the number of points that decreased the price during the time interval specified in the settings. The time interval for calculation is expressed as the number of bars of the chart the indicator is attached to. This approach allows you to evaluate the movement direction (growth or fall) of the instrument's price, the strength of the movement and the size of the movement in point
    FFx Basket Scanner
    Eric Venturi-Bloxs
    MetaTrader 5 version available here : https://www.mql5.com/en/market/product/24882 FFx Basket Scanner is a global tool scanning all pairs and all timeframes over up to five indicators among the 16 available. You will clearly see which currencies to avoid trading and which ones to focus on. Once a currency goes into an extreme zone (e.g. 20/80%), you can trade the whole basket with great confidence. Another way to use it is to look at two currencies (weak vs strong) to find the best single pairs
    NostradamusMT4
    Andrey Spiridonov
    1 (1)
    NostradamusMT4 is a powerful indicator from the set of professional trader. The indicator is based on Andrei Spiridonov's original price calculation method (ESTIMATED PRICE) for the current candle price. Advantages The indicator does not redraw. It works on any timeframes. Works with any trading instruments. Perfectly suitable for scalping and trading binary options. Parameters Color - color of the ESTIMATED PRICE FUTURE line. How to work with the indicator The indicator forms the ESTIMATED P
    FFx Pivot SR Suite PRO
    Eric Venturi-Bloxs
    MetaTrader 5 version available here: https://www.mql5.com/en/market/product/25794 FFx Pivot SR Suite PRO is a complete suite for support and resistance levels. Support and Resistance are the most used levels in all kinds of trading. Can be used to find reversal trend, to set targets and stop, etc. The indicator is fully flexible directly from the chart 4 periods to choose for the calculation: 4Hours, Daily, Weekly and Monthly 4 formulas to choose for the calculation: Classic, Camarilla, Fibonac
    BinaryIndicator
    Andrey Spiridonov
    BinaryIndicator is a highly accurate indicator for trading binary options. It shows excellent results in scalping. This indicator is based in multifactor analysis of trend indicators, as well as confirmation oscillators, which in the end gives an increased accuracy of signals. Advantages of the indicator Increased accuracy of signals. Excellent results when trading binary options with a short expiration time from M30 to M1 . It works on any timeframes. Works with any trade symbols. Parameters
    BinaryScalping
    Andrey Spiridonov
    BinaryScalping is a professional indicator for trading binary options and scalping. The algorithm of the indicator is based on the calculation of pivot points for each time period separately, the location of the price of the trading instrument relative to the pivot points is analyzed and the probability of a trading operation is calculated. The indicator has a built-in filter of trading signals based on the global trend. The indicator is installed in the usual way and works with any trading inst
    REX complete 3in1
    Christophe Godart
    This is the complete REX package. It consists of the lite, pro and ULTRA version.  Perfect for beginners and intermediates. REX complete is 100% non repaint. The strategy is based on a mix of different strategies, statistics, including pivot points, oscillators and patterns.  As the trading idea consists of a variety of some classic indicators like Momentum, Williams Percent Range, CCI, Force Index, WPR, DeMarker, CCI, RSI and Stochastic, it is clear that the fundamental indicators have being u
    作者的更多信息
    Boost trading system premium
    Sebastian Alejandro Merino Sepulveda
    No redrawing, No delay, No repainting arrows, indicator for binary options and forex IF YOU HAVE ANY QUESTIONS, CONSULTATIONS OR ACTIVATIONS OF THE INDICATORS PLEASE CONTACT ME IMMEDIATELY AT MY PERSONAL TELEGRAM When you buy this indicator you get two free indicators with binary and forex template for metatrader 4 One is a   bot   check there, it sends you signals automatically, you only execute after the signal, in favor or in reversal for FREE . The other   indicator  
    筛选:
    无评论
    回复评论