Veltrion Smart Fibonacci is a clean automatic Fibonacci structure overlay for MetaTrader 5. It automatically detects recent swing highs and swing lows, then draws key Fibonacci retracement levels directly on the chart. The indicator is designed to help traders visualize market structure, retracement zones, and the golden zone without manually drawing Fibonacci tools. Key Features Automatic swing high and swing low detection Clean Fibonacci retracement overlay Horizontal Fibonacci levels for a
DYNAMIC SR TREND CHANNEL
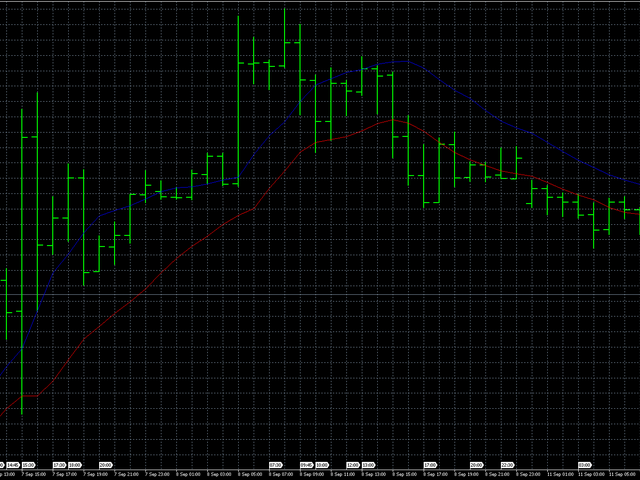
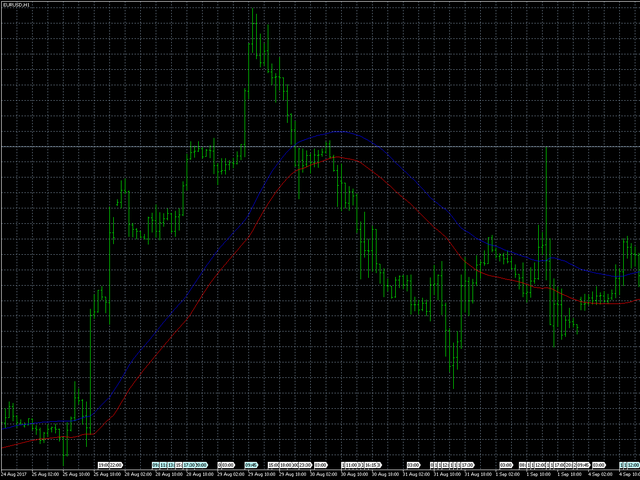
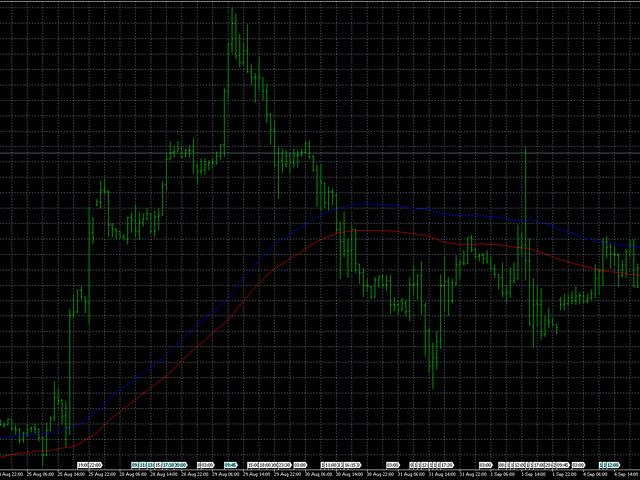
Dynamic SR Trend Channel is a simple indicator for trend detection as well as resistance/support levels on the current timeframe. It shows you areas where to expect possible change in trend direction and trend continuation. It works with any trading system (both price action and other trading system that use indicators) and is also very good for renko charting system as well. In an uptrend, the red line (main line) serves as the support and the blue line serves as the r
VP RSI Reversal Signal Arrows — Product Description
Short Description VP RSI Reversal Signal Arrows is a clean MetaTrader 5 indicator that displays buy and sell reversal arrows when RSI exits oversold or overbought zones, with an optional moving average trend filter.
Main Description VP RSI Reversal Signal Arrows is a visual technical analysis indicator for MetaTrader 5. It is designed for manual traders who want a simple RSI-based reversal assistant directly on the price chart. The indicator
Vertex Structure Dashboard delivers a complete multi-timeframe market structure analysis in a single, compact panel. It monitors up to 9 timeframes simultaneously and displays trend bias, structural breaks, momentum, and value zones in real time — no tab-switching, no manual tracking.
The panel is fully draggable and collapsible. Its position persists across timeframe changes through GlobalVariables, so your layout stays exactly where you placed it.
How It Works
Each enabled tim
Trade like a pro and never miss Break or Bounce of a Support or Resistence Line
Get alert and suggested Trading points (entry, TP1, TP2 and SL) whenever there is a break of - Break or Bounce from Pivot Point Support or Resistence - Break or Bounce from a Trendline (upper and lower Trendline) - High and Low of a previous period Any suggestion on other types of Support / Resistence to add are more than welcome
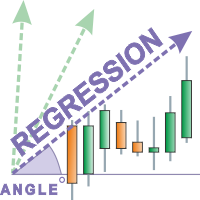
The Regression indicator shows the direction of the trend. The graph shows up to 3 regression lines with different time periods. The straight line is built as the average inside the wave channel of the price movement (shown on one ScreenShot).
In this case, you can disable any of the lines. Also, the indicator allows you to change the color for each line. It is interesting to calculate the relative angle in degrees. The angle display can also be turned off.
Thanks to this indicator, you can s
CDV Candle Engine Pro is a MetaTrader 5 indicator designed to visualize Cumulative Delta Volume (CDV) directly on the price chart. It helps traders read market pressure more clearly by showing the balance between buying and selling activity in a clean, customizable layout. If you trade on MetaTrader 4, the MT4 edition is available here: CDV Candle Engine Pro MT4 Public channel: CLICK HERE
Main Features CDV candle visualization on the main chart for easy reading in real time. Optional subwind
A ZigZag indicator for MetaTrader 5 that finds swing highs and lows, spots W-bottom and M-top patterns, and gives a BUY or SELL signal when the second leg of a pattern forms at an H1 swing point and price breaks the trendline. 1. Key advantages See the structure at a glance. Clear red ZigZag lines join the major swings, with a down arrow on every swing high and an up arrow on every swing low. Trade with the higher timeframe. On M1, M5 or M15, a signal only appears when the second leg sits on an
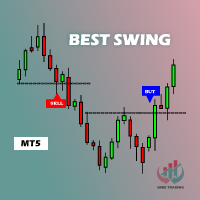
-- BEST SWING --
L'indicateur BEST SWING est un indicateur technique personnalisé, un excellent outil pour négocier les cassures en fonction des niveaux de support et de résistance horizontaux. L'indicateur BEST SWING utilise une formule complexe en analysant des données de prix autrement incongrues sur les cours de clôture de chaque période, ainsi que les hauts et les bas du prix, afin de donner un aperçu de la force ou de la faiblesse de la tendance du marché et de sa probabilité
N/B: All our product purchase comes with our free ‘’DAILY SCALPER EA’’ - bit.ly/4qlFLNh Whatsapp Developer for yours after successful purchase
BOS / CHoCH Signals Scanner Indicator (MT5) See What Smart Money Is Doing — Before the Move Happens Most traders lose because they enter too late, trade against structure, or miss institutional confirmations.
The BOS / CHoCH Signals Scanner Indicator was built to solve exactly that. This professional MT5 indicator automatically reads market struc
Anchored VWAP is a lightweight, interactive volume-weighted average price indicator designed for traders who need precision without clutter.
Unlike standard VWAP that resets every session, this tool lets you drop up to five custom anchors directly on any candle. Each anchor calculates VWAP from that exact point forward, complete with standard deviation bands to highlight where price may find support or resistance relative to volume.
Key Features: • Up to 5 simultaneous anchors — compare multi
**What it does**
Trend Pulse Pro colors a 50 EMA according to the market state: green in an uptrend, red in a downtrend, and gray in a range. To decide which is which, it combines two things: trend strength (ADX) and the moving average's slope divided by the ATR. Dividing by the ATR ensures the same threshold works on gold, a forex pair, or an index, without readjusting it every time volatility changes.
Along this line, the indicator prints buy and sell arrows based on a 9/21 EMA crossover. M
Omega Matrix Pro Advanced Multi-Indicator Confirmation System for MetaTrader 5 Omega Matrix Pro is a professional MT5 indicator designed to help traders identify high-probability BUY and SELL opportunities by combining confirmations from multiple technical indicators into a single intelligent decision. Instead of relying on one indicator, Omega Matrix Pro analyzes market conditions using a complete confirmation matrix, providing a clear visual dashboard, entry arrows, confidence score, and insta
Develop this indicator for periods of 30 minutes or more, focus on getting market trends right and making sure they are met. MFOP v8.1 gets straight to the point: it scans the market and tells you exactly when there is enough strength to enter a trade.
This indicator doesn't do magic, it uses mathematical algorithms to filter out market noise, not enter into false breakouts and show you clear BUY (blue arrow) and SELL (red arrow) opportunities. It is designed and optimized specifically to take
Price Action Structure Yoshi for MetaTrader 5 Introduction Price Action Structure Yoshi is a professional Price Action and Market Structure Indicator designed for MetaTrader 5. This MT5 Indicator helps traders visualize market structure, liquidity areas, order blocks, liquidity sweeps, and trendline relationships directly on the chart in a clear and organized manner. Inspired by widely recognized Price Action Analysis and Market Structure concepts, the indicator focuses on helping traders unders
Opulence Levels is a precision-engineered, non-repainting indicator that automatically identifies the most critical price levels on any chart — the exact zones where smart money reacts, liquidity is hunted, and the next big move is born. Powered by swing-based structure analysis and multi-timeframe intelligence, Opulence Levels cuts through chart noise to deliver clean, high-probability BUY LEVELS and SELL LEVELS with surgical accuracy. No guesswork. No repainting. Just levels that matter. What
Indicator Description This indicator displays the highest and lowest prices for the previous day, week, and month. Additionally, it shows pivot levels calculated using different methods: Standard, Fibonacci, Woodie, Camarilla, and Floor pivots. Features: Previous Day High/Low: Indicates the highest and lowest prices of the previous trading day. Previous Week High/Low: Indicates the highest and lowest prices of the previous trading week. Previous Month High/Low: Indicates the highest and lowest p
The OBV MTF is an Enterprise-grade On-Balance Volume indicator that transforms standard OBV into a complete trading system. It combines gradient-aware momentum analysis, divergence detection, multi-timeframe alignment, and dynamic customisable midpoint-filtering in a single intuitive professional volume analysis tool. Core Features 1. 5-State Momentum Engine Aqua (Strong Bullish) : OBV slope rising with positive acceleration SteelBlue (Weak Bullish) : OBV rising but losing momentum Gray (Neutr
Neuro Poseidon is a new indicator by Daria Rezueva. It combines precise trading signals with adaptive TP/SL levels - creating best possible trades as a result!
Message me and get Neuro Poseidon Assistant as a gift to automize your trading process!
What makes it stand out?
1. Proven profitability on all assets and timeframes
2. Only confirmed BUY and SELL signals present on the chart
3. Adaptive TP & SL levels generated by the software for each trade
4. Easy to understand - suitable for al
Welcome to ENTRY IN THE ZONE AND SMC MULTI TIMEFRAME SPECIAL BENEFIT / FOR OUR MQL5 CUSTOMERS FREE ACCESS TO THE NEW TOOL — COMING SOON — Learn more on our official website : https://www.fableedge.net YouTube Channel : 24/7 LIVE SIGNALS : https://www.youtube.com/@FableEdgeView
Entry In The Zone and SMC Multi Timeframe is a real-time market analysis tool based on Smart Money Concepts (SMC) , designed to analyze market structure, price direction, and key trading zones. It supports both Sing
FiboSniper Pro – Multi-Filter Fibonacci System with Auto SL/TP and Control Panel FiboSniper Pro 是一款技术指标,将动态 Fibonacci Envelopes 与多个确认过滤器相结合,以生成经过筛选的 Buy 和 Sell 信号。Fibonacci 水平基于 Moving Average 和 ATR 计算,然后通过 ADX、EMA、RSI、ATR、Volume、Time 和 Candle 结构进行过滤。该指标直接在图表上显示基于 ATR 自动计算的 Stop Loss 和 Take Profit 水平,并提供交互式控制面板,以便快速调整参数。 购买后,请联系我以获取推荐的设置文件和详细使用说明。 使用 Auto Trader X 自动执行 FiboSniper Pro 信号: [Auto Trader X] 用户指南和设置文件: [Click here] 完整文档请参阅产品博客: [Click here] 加入官方频道获取最新更新: [Click here] 专为偏好结构化入场和清晰风险管理
Volatility Master for MetaTrader is a real-time dashboard tool that scans up to 50 symbols to identify high-volatility , trending markets instantly. With bullish/bearish signals, customizable alerts, and a user-friendly interface, it helps you avoid range-bound conditions and focus on high-probability trades. Clarity leads to confidence. Trade confidently and protect your capital effectively with this powerful dashboard. We don't offer free or bonus indicators in exchange of reviews from you.
The script analyzes the history of quotes and gives recommendations on the minimum deposit. The calculations take into account the variability of prices and the standard deviation. Margin requirements for the instrument are also taken into account. The result of the script is the minimum recommended deposit for trading the given currency pair.
The script analyzes the history of quotes and gives recommendations on the minimum deposit. The calculations take into account the variability of prices and the standard deviation. Margin requirements for the instrument are also taken into account. The result of the script is the minimum recommended deposit for trading the given currency pair.
The script allows selecting the required 'Filter level' value of the AIS-MTF MT5 indicator. Run the script on the required chart and selected timeframe. Once its operation is complete, the HPS.csv file will be created in the Files folder. Open the file. You will see three columns. The 'Filter lvl' column represents the value of the 'Filter level' for the AIS-MTF indicator. Am. dev. - degree and direction of the indicator's deviation from the price level (sorted in ascending order). Negative valu
This script allows selecting the TakeProfit and StopLoss levels. It analyzes the history data, and then calculates the probability of reaching a given price level.
How the script works Suppose you have a trading strategy and you want to select the TakeProfit and StopLoss levels. Run the script and set the parameter: Number of Bars - the average position holding time in bars. Once the script operation is complete, the AIS-PPL.csv file will be created in the Files folder in the terminal data cata
The script allows selecting the required 'Filter level' value of the AIS-MTF indicator. Run the script on the required chart and selected timeframe. Once its operation is complete, the HPS.csv file will be created in the Files folder. Open the file. You will see three columns. The 'Filter lvl' column represents the value of the 'Filter level' for the AIS-MTF indicator. Am. dev. - degree and direction of the indicator's deviation from the price level (sorted in ascending order). Negative values i
This script allows selecting the TakeProfit and StopLoss levels. It analyzes the history data, and then calculates the probability of reaching a given price level.
How the script works Suppose you have a trading strategy and you want to select the TakeProfit and StopLoss levels. Run the script and set the parameter: Number of Bars - the average position holding time in bars. Once the script operation is complete, the AIS-PPL.csv file will be created in the Files folder in the terminal data cata
The indicator is designed to measure the price volatility. This allows determining the moments for opening or closing trade positions more accurately. High intensity of the market indicates the instability of its movement, but allows for better results. And, conversely, low intensity of the market indicates the stability of its movement.
Parameters Bars to process - the number of bars to measure the price movements. A low value of this parameter allows determining the moments of rapid price mov
This indicator uses the Fibonacci p-numbers to smooth a price series. This allows combining the advantages of the simple and exponential moving averages. The smoothing coefficients depend on the level of the p-number, which is set in the indicator parameters. The higher the level, the greater the influence of the simple moving average and the less significant the exponential moving average.
Parameters Fibonacci Numbers Order - order of the Fibonacci p-number, specified by trader. Valid values a
The indicator is based on the analysis of interaction of two filters. The first filter is the popular Moving Average. It helps to identify linear price movements and to smooth minor price fluctuations. The second filter is the Sliding Median. It is a non-linear filter. It allows to filter out noise and single spikes in the price movement. A predictive filter implemented in this indicator is based on the difference between these filters. The indicator is trained during operation and is therefore
This indicator studies the price action as a combination of micro-trends. All micro-trends are analyzed and averaged. Price movement is filtered based on this averaging. IP_High and IP_Low (blue and red dashed lines) show the instantaneous price movement. They display the forecast only for the current price values, taking into account only the number of bars defined by the 'Filter level' parameter. SP_High and SP_Low (blue and red solid lines) smooth the price movements with respect to history.
This indicator implements the process of simple linear smoothing. One of the disadvantages of exponential smoothing is the rapid attenuation of the signal. This does not allow for a full-fledged monitoring of long-term tendency of a price series. Linear smoothing allows fine-tuning the signal filtering. The indicator is configured by selecting the parameters: LP - period of smoothing. The higher the value, the more long-term tendencies are displayed by the indicator. Valid values are from 0 to 2
该指标是两个改进的Lanczos滤波器的组合。 第一个过滤器用于推断价格。根据过去的价值,他预测当前柱内可能的价格变动。也就是说,它表明如果过去的趋势保持不变,价格会是多少。 第二个过滤器,用于平滑和平均窗口内的价格,由过滤器的级别决定。由于选择了权重,此过滤器最积极地响应价格变动中存在的周期性组件。 可以使用EF和IF参数调整指标。通过选择 EF 和 IF 的值,您可以获得有关趋势价格变动开始的信号。 EF - 指数滤波器的窗口大小。有效值为 EF = 0 ... 255 。并且在计算期间处理的条数是 2 * EF + 1 。该参数越大,价格序列的过去价值的影响越大。结果以实线绘制。 IF - 调整平均窗口的大小。 IF = 0 ... 255 的值。要计算的条数是 2 * IF + 1 。 IF 值越大,使用此过滤器检测到价格变动的较长时段。结果以虚线显示在图表上。