已发布的产品

该脚本旨在评估各种窗口函数中的权重。基于这些窗口函数构建的指标可以在 https://www.mql5.com/ru/market/product/72159 下载 输入参数: iPeriod – 指标周期。 iPeriod >= 2 iCenter 是窗口函数中心所在的参考索引。默认情况下,此参数为 0 - 窗口中心与指标中心重合。当 1 <= iCenter <= iPeriod 时,窗口函数的中心将移动,因此指标的某些特征将发生变化。在图 1 中,您可以看到中心的选择如何影响窗口功能和指标的显示。此参数可以以 0.5 为增量进行更改。 Histogram width - 直方图的宽度。 Histogram color - 直方图的颜色。 Show duration - 显示持续时间。 Screenshot - 启用此选项时,图片将保存在 Files 文件夹中。 一些窗口函数使用附加参数 - ParameterA 和 ParameterB。它们会影响窗口权重。正因为如此,指标的特性发生了变化。该表显示了窗口函数和更改参数的限制(如果使用它们)。 Windo
FREE

该脚本基于使用随机数生成器模拟贸易交易。即使使用相同的输入参数,这也可以使您获得完全不同的结果。运行脚本时,将打开一个对话框,您可以在其中设置外部变量的所需值。 在块中,TradingOptions定义了模拟交易所需的基本参数。 StartBalance - 设置交易余额的初始大小。 NumberTrade - 设置脚本运行时将建模的交易事务数。为了获得或多或少的显着结果,该参数必须大于30。 ProbabilityWinning - 获胜交易的概率。表示为百分比,有效值为1到99。 Min.StopLoss - 表示以点为单位的最小StopLoss值,将在建模交易操作时使用。 Max.StopLoss - 以磅为单位设置StopLoss的最大值。 PositiveWin。 - 该变量建立修正,借助于该修正在模拟交易中获得积极的期望。 脚本的工作是执行以下操作。首先,计算获胜交易的预期概率 - PW。之后,随机设置StopLoss的值,该值将在此事务中使用。考虑到预期收益应为正数,计算TakeProfit规模。考虑到点值,TakeProfit和StopLoss水平将转换为
FREE

该脚本的设计使交易者可以确定交易交易的平均持续时间,在此期间可能的利润和损失的比率将是最佳的。 首先,让我们看一下确定贸易交易最佳持续时间的一般方法。我们介绍以下变量: R - 交易的结果; T - 交易开放的时间; W - 上一笔交易结束与下一交易开盘之间的时间。 每个交易者都努力在最短的时间内获得最大的利润。这种愿望可以通过以下简单表达来描述: R/(T+W)→max 。 很明显,变量 T 和 W 取决于交易的总持续时间和交易数量。设 ATD 是交易的平均持续时间, N 是交易总数。然后,交易的平均持续时间应与其总数的平方根成比例增长,即: ATD~√N 。 但是,有一些有根据的问题出现 - 任何交易持续时间等同于其他交易持续时间,交易持续时间如何影响交易操作的结果?为了得到所提问题的答案,我们将对历史数据的价格行为进行一项小型研究。 我们继续如下。我们将历史数据划分为由一定数量的柱组成的系列,对应于交易的平均持续时间。在每个这样的系列中,我们计算最大价格变动,我们将引用更大的偏差 StopLoss ,并且更小 - 到 TakeProfit 。 之后,我们将计
FREE

This script allows selecting the TakeProfit and StopLoss levels. It analyzes the history data, and then calculates the probability of reaching a given price level.
How the script works Suppose you have a trading strategy and you want to select the TakeProfit and StopLoss levels. Run the script and set the parameter: Number of Bars - the average position holding time in bars. Once the script operation is complete, the AIS-PPL.csv file will be created in the Files folder in the terminal data cata
FREE

该脚本基于使用随机数生成器模拟贸易交易。即使使用相同的输入参数,这也可以使您获得完全不同的结果。运行脚本时,将打开一个对话框,您可以在其中设置外部变量的所需值。 在块中,TradingOptions定义了模拟交易所需的基本参数。 StartBalance - 设置交易余额的初始大小。 NumberTrade - 设置脚本运行时将建模的交易事务数。为了获得或多或少的显着结果,该参数必须大于30。 ProbabilityWinning - 获胜交易的概率。表示为百分比,有效值为1到99。 Min.StopLoss - 表示以点为单位的最小StopLoss值,将在建模交易操作时使用。 Max.StopLoss - 以磅为单位设置StopLoss的最大值。 PositiveWin。 - 该变量建立修正,借助于该修正在模拟交易中获得积极的期望。 脚本的工作是执行以下操作。首先,计算获胜交易的预期概率 - PW。之后,随机设置StopLoss的值,该值将在此事务中使用。考虑到预期收益应为正数,计算TakeProfit规模。考虑到点值,TakeProfit和StopLoss水平将转换为
FREE

The script analyzes the history of quotes and gives recommendations on the minimum deposit. The calculations take into account the variability of prices and the standard deviation. Margin requirements for the instrument are also taken into account. The result of the script is the minimum recommended deposit for trading the given currency pair.
FREE

该脚本旨在评估各种窗口函数中的权重。基于这些窗口函数构建的指标可以在 https://www.mql5.com/ru/market/product/72160 下载 输入参数: iPeriod – 指标周期。 iPeriod >= 2 iCenter 是窗口函数中心所在的参考索引。默认情况下,此参数为 0 - 窗口中心与指标中心重合。当 1 <= iCenter <= iPeriod 时,窗口函数的中心将移动,因此指标的某些特征将发生变化。在图 1 中,您可以看到中心的选择如何影响窗口功能和指标的显示。此参数可以以 0.5 为增量进行更改。 Histogram width - 直方图的宽度。 Histogram color - 直方图的颜色。 Show duration - 显示持续时间。 Screenshot - 启用此选项时,图片将保存在 Files 文件夹中。 一些窗口函数使用附加参数 - ParameterA 和 ParameterB。它们会影响窗口权重。正因为如此,指标的特性发生了变化。该表显示了窗口函数和更改参数的限制(如果使用它们)。 Window
Parameter
FREE

选择StopLoss和TakeProfit的水平会对交易的整体表现产生非常强烈的影响。除了交易交易的明显参数 - 可能获胜或可能亏损的大小 - 止损和止盈的水平也会影响交易的预期持续时间以及一般交易的盈利能力。 如果您已使用“ AIS-ODT ”脚本确定了最佳事务持续时间,则可以开始确定与StopLoss和TakeProfit级别关联的参数。 为此,我们按以下步骤操作。首先,我们将确定在一个方向或另一个方向上的所有可能的价格偏差,并计算在一定时间内实现它们的概率。之后,您可以根据其大小,概率和预期利润值计算StopLoss和TakeProfit的最佳水平。 为此,请在感兴趣的货币对的图表和所需的时间范围内运行脚本。使用属性窗口中的ILB参数,设置交易仓位的期望持续时间,以柱数表示。在实用程序的工作期间,分析整个历史记录的数据,并选择最佳值。在脚本结束时,形成了两个文件 - “Buy.csv”和“Sell.csv”,其中包含获得结果的表 - 图1。 在表格的第一列中,指示了可能的TakeProfit大小,在第二列中,指示了最佳的StopLoss大小。第三列显示以百分比表示获胜这些参数的概
FREE

The script analyzes the history of quotes and gives recommendations on the minimum deposit. The calculations take into account the variability of prices and the standard deviation. Margin requirements for the instrument are also taken into account. The result of the script is the minimum recommended deposit for trading the given currency pair.
FREE

The script allows selecting the required 'Filter level' value of the AIS-MTF indicator. Run the script on the required chart and selected timeframe. Once its operation is complete, the HPS.csv file will be created in the Files folder. Open the file. You will see three columns. The 'Filter lvl' column represents the value of the 'Filter level' for the AIS-MTF indicator. Am. dev. - degree and direction of the indicator's deviation from the price level (sorted in ascending order). Negative values i
FREE

The script allows selecting the required 'Filter level' value of the AIS-MTF MT5 indicator. Run the script on the required chart and selected timeframe. Once its operation is complete, the HPS.csv file will be created in the Files folder. Open the file. You will see three columns. The 'Filter lvl' column represents the value of the 'Filter level' for the AIS-MTF indicator. Am. dev. - degree and direction of the indicator's deviation from the price level (sorted in ascending order). Negative valu
FREE

This script allows selecting the TakeProfit and StopLoss levels. It analyzes the history data, and then calculates the probability of reaching a given price level.
How the script works Suppose you have a trading strategy and you want to select the TakeProfit and StopLoss levels. Run the script and set the parameter: Number of Bars - the average position holding time in bars. Once the script operation is complete, the AIS-PPL.csv file will be created in the Files folder in the terminal data cata
FREE

该指标更具信息量。他的工作基于这样的假设,即市场中的价格变动可以表示为特定颜色的噪声,这取决于价格值分布的参数。由此,可以从不同角度分析价格变化,并将价格变动视为特定颜色的噪声,可以获得有关市场当前状态的信息并对价格行为进行预测。 在分析指标读数时,会考虑指标线的位置 - 它们位于当前柱的开盘价的上方或下方以及距离它的距离。 白噪声(白噪声) - 这种方法的特点是价格(当前和史前)被认为功率相等,这与简单的移动平均值相结合。白噪声信号更有可能证实这一特征 - 它越偏离当前价格,市场中的趋势运动就越强烈。相反,如果白噪声线接近开盘价,那么这就是趋势结束或横向价格变动的证据。 闪烁噪声(闪烁噪声)概述了趋势的上边界或下边界(取决于线是否高于或低于价格)。此外,这种噪音线与货币对价格的交叉点可以作为新趋势开始的证据,甚至是短期趋势的开始。 布朗噪声在很多方面的行为类似于指数平滑。因此,噪声线跟随价格,只有市场突然和突然的变化才有可能出现大的偏差。 蓝噪声显示趋势对当前趋势的强烈程度。由于蓝色噪声线与当前价格存在较大偏差,我们可以说趋势已经耗尽其力量并接近完成。 紫色噪音表明周期性或周期性价

尽管“ AIS Color Noise Filter ”指示器存在一些缺点,但使用它来平滑价格序列和预测价格的想法看起来非常有吸引力。 这是由于以下几个原因: 首先,考虑到几个噪声成分,可以建立相互独立的因素预测,从而提高预测质量; 其次,价格序列的噪声特征在整个历史中表现得相当稳定,从而可以获得稳定的结果; 最后,噪声变化使我们希望预测系统非常敏感,并且它对价格变化的反应将非常快。 因此,我们得到一个指标,尽管有所有简化,但能够准确预测价格将会移动的渠道。该指标的主要优点是速度快,易于学习。主要缺点是指标无法选择最重要的预测因素。 LH 是一个参数,用于设置进行预测的历史数据的长度。其允许值为0 - 255,而指标处理的柱数超过此参数指定的单位数。

很多时候,在金融系列的研究中应用他们的平滑。使用平滑,您可以删除高频成分 - 据信它们是由随机因素引起的,因此无关紧要。平滑总是包括一些平均数据的方法,其中时间序列中的随机变化相互吸收。大多数情况下,为此目的,使用简单或加权移动平均方法,以及指数平滑。 这些方法中的每一种都有其优点和缺点。因此,简单的移动平均值简单直观,但其应用需要时间序列的周期和趋势分量的相对稳定性。另外,信号延迟是移动平均值的特征。指数平滑方法没有滞后效应。但即使在这里也存在缺陷 - 只有在将系列与随机异常值对齐时,指数平滑才有效。 简单和指数平均值之间的合理折衷是使用加权移动平均线。但是,存在选择特定重量值的问题。让我们一起尝试解决这个问题。 因此,首先要定义我们希望从平滑过程中实现的目标: •首先,我们需要从价格序列中删除随机变化和噪音; •其次,我们希望识别异常排放和异常价格行为,这些行为也可用于贸易; •最后,平均程序应确定市场中存在的可持续趋势。 当然,我们希望平滑程序适应当前的市场情况。 为了获得理想的结果,我们将根据此价格水平与研究期间的最高和最低价格之间的差异来计算权重。通过这种方法,我们得到一个

为了隔离长期和非随机组件,不仅要知道价格变化了多少,还要知道这些变化是如何发生的。换句话说 - 我们不仅对价格水平的价值感兴趣,而且对这些水平相互替代的顺序感兴趣。通过这种方法,人们可以找到影响(或可能影响)特定时间点价格变化的长期和稳定因素。了解这些因素可以让您做出或多或少准确的预测。 让我们确定我们希望从财务系列的分析中得到什么具体结果: •首先,我们需要强调这一趋势,如果它存在于市场中; •其次,我们需要确定周期性成分; •第三,结果应足够稳定,可用于预测; •最后,我们的分析方法应该适应当前的市场形势。 为了满足指定的条件,我们使用相对价格变化的回归分析,并基于该模型做出指标。该指标的算法基于对历史数据的学习,其工作在交易者的完全控制之下。 LH 是一个参数,用于确定用于平滑金融系列的柱数。其允许值介于0到255之间。 UTS 是影响学习速度和深度的参数。它的值也在0到255之间。如果UTS的值为零,则在整个历史记录中进行学习。在所有其他情况下,训练集会不时更新。更新越频繁,UTS值越小。 该指标的主要缺点是,当平滑金融系列被认为是静止时,这可能会导致一些延迟。

AIS 正确平均线指标允许您设置市场趋势运动的开始。该指标的另一个重要品质是趋势结束的明确信号。指标不会重新绘制或重新计算。
显示值 h_AE - AE 通道的上限
l_AE - AE通道的下限
h_EC - 当前柱的高预测值
l_EC - 当前柱的低预测值
使用指标时的信号 主要信号是通道AE和EC的交点。
当 l_EC 线高于 h_AE 线时,可能会开始上升趋势。
在 h_EC 线低于 l_AE 线之后,可以预期下降趋势的开始。
在这种情况下,应注意 h_AE 和 l_AE 线之间的通道宽度。它们之间的差异越大,趋势就越强。您还应该注意 AE 通道实现的局部高点/低点。这时,价格变化的趋势变得最强。
可定制的指标参数 设置指标包括根据时间范围选择 LRH 参数。此参数的有效值范围为 1 到 350。
此参数越小,指标越敏感,错误信号的增加可能。另一方面,此参数不应设置得太高,因为指标会变得不那么敏感并会跳过信号。

该指标是两个改进的Lanczos滤波器的组合。 第一个过滤器用于推断价格。根据过去的价值,他预测当前柱内可能的价格变动。也就是说,它表明如果过去的趋势保持不变,价格会是多少。 第二个过滤器,用于平滑和平均窗口内的价格,由过滤器的级别决定。由于选择了权重,此过滤器最积极地响应价格变动中存在的周期性组件。 可以使用 EF 和 IF 参数调整指标。通过选择 EF 和 IF 的值,您可以获得有关趋势价格变动开始的信号。 EF - 指数滤波器的窗口大小。有效值为 EF = 0 ... 255 。并且在计算期间处理的条数是 2 * EF + 1 。该参数越大,价格序列的过去价值的影响越大。结果以实线绘制。 IF - 调整平均窗口的大小。 IF = 0 ... 255 的值。要计算的条数是 2 * IF + 1 。 IF 值越大,使用此过滤器检测到价格变动的较长时段。结果以虚线显示在图表上。
其中一种强大的分析方法是使用Levy流程对财务系列进行建模。这些过程的主要优点是它们可用于模拟大量现象 - 从最简单到最复杂。我只想说市场中分形价格变动的想法只是Levy过程的一个特例。另一方面,通过适当选择参数,任何Levy过程都可以表示为简单的移动平均值。图1显示了一个Levy过程的示例,其中片段放大了几次。 让我们考虑使用Levy流程来平滑价格图表的可能性。首先,您需要选择Levy过程的参数,以便它可以用于模拟线性过程。然后我们得到一个权重系统,其中包括不同符号的系数。有了这个,我们不仅可以平滑金融范围,还可以跟踪其中存在的反趋势和周期性成分。 通过选择参数 LF 来配置指示器的操作。它决定了故事的深度,并将对其进行分析。此参数的允许值位于0 - 255之间。用于计算的条形数将比此数字多两个。 蓝线表示高价平滑的结果,绿线表示收盘价,红线表示低价。 该指标的主要缺点是根据严格定义的算法执行抗锯齿,该算法没有考虑市场中的急剧和强烈变化。此外,与所有平滑指标一样,存在可以达到简单移动平均值的滞后。

该指标是基于中值和移动平均特性的组合的顺序混合滤波器。
使用中值允许滤除价格序列值中的异常异常值和随机脉冲。同时,中值滤波器不会对价格变动的趋势起作用,而是保持不变。 由于中值滤波器是非线性的,因此使用简单移动平均值进行平均来平滑其值。这种方法使我们不仅可以更准确地识别趋势,还可以更准确地识别价格变动中的周期性成分。此外,它还增加了指标对价格变化的敏感度,并减少了价格序列与指标读数之间的延迟。因此,指标可以相当准确地警告新趋势的开始,以及旧趋势的结束。
您可以使用 FL 参数调整滤波器的深度及其灵敏度。其允许值为0到63.同时, 2 * FL + 1 条用于计算指标值。因此,FL值越大,指标显示价格图表的趋势越强。


This indicator studies the price action as a combination of micro-trends. All micro-trends are analyzed and averaged. Price movement is filtered based on this averaging. IP_High and IP_Low (blue and red dashed lines) show the instantaneous price movement. They display the forecast only for the current price values, taking into account only the number of bars defined by the 'Filter level' parameter. SP_High and SP_Low (blue and red solid lines) smooth the price movements with respect to history.

The indicator is based on the analysis of interaction of two filters. The first filter is the popular Moving Average. It helps to identify linear price movements and to smooth minor price fluctuations. The second filter is the Sliding Median. It is a non-linear filter. It allows to filter out noise and single spikes in the price movement. A predictive filter implemented in this indicator is based on the difference between these filters. The indicator is trained during operation and is therefore

This indicator uses the Fibonacci p-numbers to smooth a price series. This allows combining the advantages of the simple and exponential moving averages. The smoothing coefficients depend on the level of the p-number, which is set in the indicator parameters. The higher the level, the greater the influence of the simple moving average and the less significant the exponential moving average.
Parameters Fibonacci Numbers Order - order of the Fibonacci p-number, specified by trader. Valid values a

让我们看一下外汇市场价格变化的本质,而不是关注这些变化发生的原因。这种方法将使我们能够确定影响价格变动的主要因素。 例如,让我们看一下欧元兑美元货币对和H1时间框架的开盘价。对于这些价格,我们构建了Lameray图(图1)。 在该图中,可以看出价格变动基本上根据线性方程发生。要确定此等式的参数,可以使用最小二乘法。在这个特定的例子中,改变开盘价的等式采用以下形式: Open [i] = 0.99989 * Open [i + 1] +0.00013。 让我们来看看这个等式如何充分描述价格变动。为此,我们删除线性分量并分析残差(图2)。 从图中可以清楚地看出,这些残留物相当混乱,如果我们将它们视为噪声,我们可以得到一个相当简单的系统来预测下一个柱的开盘价,这是以该指标的形式实现的。

通常,交易者面临着确定价格在不久的将来可能发生变化的程度的任务。为此,您可以使用Johnson分发类型SB。这种分布的主要优点是即使只有少量的累积数据也可以使用它。用于确定此分布参数的经验方法允许您准确地确定价格通道的最大和最小水平。 这些值可用于不同的情况。例如,它们可用于设置市场订单的止损和止盈水平,或挂单的入场点。此外,使用追踪止损时可以定向这些水平。此外,在历史足够大的情况下,指标可能预示着上升趋势或下降趋势的开始。嗯,或者说它的结束,如果这样的趋势是。 该指标的主要缺点是对价格排放的敏感度极高,以及对市场形势变化的反应较迟。 蓝色和红色线分别显示价格通道的最大值和最小值。绿线表示在给定市场情况下价格的均衡值。 使用 LB 参数配置指标。此参数确定将在计算中使用的柱数,其允许值在2-64之间。

在做出交易决策时,不仅要依赖历史数据,而且还要依赖当前的市场状况,这很有用。为了使监视市场趋势的当前趋势更加方便,可以使用AIS Current Price Filter指示器。 该指标仅考虑一个方向或另一个方向上最重要的价格变化。因此,可以预测近期内的短期趋势-无论当前市场形势如何发展,当前价格迟早都会越过该指标的界限。从交易者的角度来看,最有趣的是价格已经尽可能远离指标水平的情况。这些时刻对于打开新的交易头寸可能是最理想的。 指标的操作不取决于所选的时间范围,而是使用两个参数进行配置。 FS -可以用来设置灵敏度阈值的参数。它越大,价格移动就应该越强,以便在指标中将其考虑在内。其可接受的值在0-255的范围内。如果选择零值,则灵敏度阈值将等于电流范围。 LB -设置在指标计算中使用的背景深度。此参数的有效值也在0到255的范围内。如果它等于零,则将考虑所有具有自学习控制的历史数据。并且,如果此参数等于1,则指标将仅标记FS参数指定的价格偏差。 其余参数使您可以配置图表上指标的显示。 Width -设置单个指示器线的粗细。 Color -指标线的颜色。 Style -指标显示样式。

可持续的分配可用于平滑财务系列。由于可以使用相当深的历史来计算分布参数,因此在某些情况下,与其他方法相比,这种平滑甚至更有效。
该图显示了H1时间框架内EUR-USD货币对的开盘价分布十年的示例(图1)。看起来很迷人,不是吗?
该指标的主要思想是通过价格分散来确定可持续分配的参数,然后使用这些数据来平滑财务序列。由于这种方法,在给定的市场情况下,平滑后的值将趋于最可能的价格值。
使用参数LB组态指示器的操作。它的值确定平滑序列的长度,以巴表示。允许值在1-255的范围内。
蓝线表示平滑的高价,红线表示低价,绿线表示收盘价。
该指标的主要缺点是无法设置平滑窗口的宽度,因此指标在历史记录的所有部分中均保持稳定。因此,交易者必须根据其特定要求选择参数。

其中一个数字序列称为“森林火灾序列”。它被公认为最美丽的新序列之一。它的主要特点是该序列避免了线性趋势,即使是最短的趋势。正是这一属性构成了该指标的基础。 在分析金融时间序列时,该指标试图拒绝所有可能的趋势选项。只有当他失败时,他才会认识到趋势的存在并给出适当的信号。这种方法可以让人们正确地确定新趋势开始的时刻。然而,误报也是可能的。为了减少它们的数量,该指标添加了一个额外的过滤器。当新柱打开时会生成信号。在任何情况下都不会发生重绘。 指标参数: Applied Price - 应用价格常数; Period Main - 指标的主要周期,其有效值在 5 - 60 之间; Period Additional - 附加周期,此参数的有效值为 5 - 40; Signal Filter - 附加信号滤波器,有效值 0 - 99; Alerts - 启用后,指示器会在出现新信号时提醒您; Send Mail - 允许指标向电子邮件发送消息; Push - 允许您发送 Push 消息。

该指标基于椭圆形。这种形状用于空气动力学和空间技术。甚至子弹也有某种椭圆形。 在技术指标中使用这种形式可以在指标的灵敏度和稳定性之间实现折衷。这为其应用提供了额外的可能性。 指标参数: iType - ogive 表单的类型。 iPeriod - 指标周期。 iFactor 是用于抛物线和指数形式的附加参数。有效值为 0 - 255。如果 iFactor = 0,则指标退化为简单移动平均线。 iChannel - 一个允许您建立价格变动的上下通道的参数。有效值为-128到127。如果值为正,则绘制上通道,如果值为负,则绘制下通道。 通过组合这些参数,可以获得不同的结果。该指标可用于跟踪市场中的趋势价格变动。通过建立渠道,您可以获得价格可以移动的最近目标。通道边界值可以作为止盈止损。使用 iFactor,您可以实现金融时间序列所需的平滑程度。

该指标使用所谓的“邪恶”数字作为权重系数。它们的对立面是“可憎”的数字,也出现在该指标中。将数字划分为这两类与汉明权重有关,汉明权重由特定数字的二进制表示法中的单位数确定。 使用这些数字作为加权因子会产生趋势跟踪指标。此外,可恶的数字给出了更敏感的指标,而邪恶的数字给出了保守的指标。它们之间的差异不是很大,只有在市场价格剧烈波动时才能注意到。使用该指标可以帮助确定新趋势的开始。这使得可以更准确地确定开仓时刻。 指标参数: Type numbers - 选择数字类型,Evil 或 Odious; iPeriod - 指标周期。指标的灵敏度取决于此参数。它越小,对价格变化和市场趋势变化的敏感度越高。 图中显示了指标操作的示例。
该交易专家的主要目的是利用追踪止损来支持未平仓头寸。专家可以跟踪手动和其他顾问开设的头寸。 止损和止盈水平的计算是基于市场价格变化的统计关系。借助这一点,顾问可以选择利润和风险之间的最佳比率。一有机会,专家就会将仓位移至盈亏平衡点,然后开始跟踪价格。头寸的盈亏平衡点是根据累计掉期和佣金来计算的。 此外,还增加了使用您自己的算法开仓的功能。因此,对顾问进行了重大更改,包括输入参数。
追踪止损参数: Trailing Stop timeframe-顾问用来计算止损和获利水平的时间范围; UseTakeProfit-跟踪仓位时使用您自己的获利。
交易策略主要参数: Lot – 如果使用其内部策略,专家将开设的头寸数量; Slippage – 价格滑点(最小值 1); Best price-专家开仓时使用的过滤器; MinRisk-控制风险。启用此过滤器可以降低风险,但也会降低盈利能力。
策略参数: Symbol Name——顾问应该监控的符号。如果未指定参数,则使用安装顾问的符号; Strategy-选择您自己的交易策略。 None- 未发生该符号的交易; Strategy para
该指标使用价格序列的局部高点和低点。突出极值后,对它们的值进行平滑处理。因此,建立了两个通道 - 外部和内部。如果价格走势严格遵循线性趋势,则内部通道显示限制。外部通道以对数趋势显示价格变动的边界。 在计算通道后,该指标分析实际价格走势并提供开仓和平仓建议。蓝点 - 建立买入头寸,红色点 - 建立卖出头寸。相应的交叉盘建议关闭某些头寸,如果有的话。应该记住,并非所有信号都具有相同的强度和准确性。在某些情况下,正确方向的价格变动会很快结束,因此不可能获得大笔利润。在某些情况下,信号会导致损失(最后一张图片显示了此类信号的示例)。鉴于这些特点,我们可以推荐以下方法 - 使用浮动止盈,其值可以根据当前市场情况进行更改。还需要选择一个止损值,以便在出现关闭它们的信号之前关闭无利可图的头寸。 指标设置使用以下参数进行: iChannel - 调整通道的宽度。狭窄的通道会提供更多的信号,但也会增加误报的风险。 iSignal - 允许您配置信号的显示。默认情况下,仅显示最佳进入和退出信号。 iPeriod - 指标周期。该参数越大,通道宽度越大。因此,它也会影响信号的数量。 iFac
超几何级数用于计算该滤波器的权重系数。这种方法使您可以对时间序列进行相当有趣的平滑处理。 超几何滤波器权重的衰减速度不如指数和线性加权移动平均,但比平滑移动平均快。因此,此过滤器的行为在许多方面类似于移动平均线的行为。但是,它有几个优点。它的滞后远小于移动平均线。但与此同时,它比指数移动平均线保留了更多的信息。因此,超几何过滤器可以更好地突出金融时间序列的趋势和周期性成分。因此,该指标可用于那些使用不同类型移动平均线的交易策略。 指标的操作取决于一个参数: iPeriod - 此参数的有效值为 2 - 149。 该参数的值越小,指标对最新价格变化的反应越强。此参数的较大值可让您突出显示长期趋势。图中显示了具有不同 iPeriod 值的指标操作示例。
该指标显示最佳止盈和止损水平。这些水平是根据历史数据计算的。在第一次开始时,指标是根据历史训练的。之后,他评估价格在未来克服这个或那个水平的可能性,并选择最优化的选项来放置止损单。例如,选择止盈值以使利润最大并且价格达到其水平的概率尽可能高。止损水平应该是最小的,但达到它的可能性应该是最小的。这导致了具有最高可能获胜数学期望的级别。 此外,该指标可以以支撑位和阻力位的形式使用。为此,您可以组合不同的预测长度和偏移量。 指标参数: 长度 - 预测长度。此参数表示未来柱线交易的预期持续时间。 Shift - 在小节中移动。由于此参数,您可以查看过去的指标读数。 宽度 - 线宽。 ClrBuy - 买入头寸的线条颜色。 ClrSell - 卖出头寸的线条颜色。 StyleTP - 获利线样式。 StyleSL - 止损线样式。 信息 - 启用此选项时,止损和止盈值将显示在终端的“专家”选项卡中。

该滤波器基于贝塞尔多项式。它的主要优点是时间延迟小。这个过滤器的另一个特点是它对金融时间序列的最新值的高度敏感。正因为如此,该指标突出了活跃的价格走势,同时消除了噪音偏差。 除了经典变体之外,贝塞尔系数的对数已作为加权函数添加到指标中。在这种情况下,指标变得更平滑,但同时当价格活跃时它可能会滞后。 在计算贝塞尔多项式时,会使用阶乘。因此,指标的周期从下方和上方受到限制。使用普通贝塞尔滤波器时,最好注意指标的小周期。由于随着周期的增加,指标的行为变得越来越稳定,差异变得越来越不明显。 这些图显示了两种过滤器类型的行为。 指标参数: TypeFilter - 正常/对数滤波器类型选择 iPeriod - 指标周期,有效值 3 - 85。

此指标可让您确定价格达到一个或另一个级别的可能性。它的算法非常简单,并且基于对特定货币对的价格水平的统计数据的使用。由于收集的历史数据,可以确定价格在当前柱形期间的变化程度。 尽管简单,但该指标可以为交易提供宝贵的帮助。因此,在其帮助下,可以确定交易头寸的TakeProfit和StopLoss水平。它可以帮助确定挂单的价格和确定TrailingStop的价格水平。 此外,该指标可以纳入现有战略。例如,您使用某种日内策略。然后,通过在D1时间框架上设置此指标,您可以在克服已经不希望开启新交易头寸之后获得水平。 该指标的主要缺点是它完全依赖于历史数据,并且不会以任何方式对某些当前的市场变化作出反应。 通过选择输入参数-L1 ... L4来执行该指标的设置 - 每个输入参数确定从每个柱的开盘价达到价格价格的概率。每个参数的值必须在99 ... 0之内,并且以下每个参数必须严格小于前一个参数。 尼古拉·尼古拉耶维奇(Nikolai Nikolaevich)是创造这个指标的意识形态灵感,如果你喜欢这个指标,那就写下几句话,我会告诉他。

该指标基于离散哈特利变换。使用此转换允许您在处理金融时间序列时应用不同的方法。该指标的一个显着特点是它的读数不是指图表上的一个点,而是指指标周期的所有点。 处理时间序列时,指标允许您选择时间序列的各种元素。过滤的第一种可能性是建立在这种方法上的——所有不必要的高频分量都被简单地丢弃。第一个图展示了这种方法的可能性,选择CutOff参数,可以选择原始时间序列的细节(红线-只剩下主要信息CutOff = 0,黄色-主要和最低频率周期CutOff = 1 , 蓝色 - 所有最高频的噪声都被丢弃 CutOff = 4 )。然而,这不是唯一的可能性——噪声分量可以通过额外的过滤来抑制。 这两个选项都在该指标中实施。它的参数是: iPeriod - 指标周期 Shift - 指标相对于当前柱的偏移。通过更改此参数,您可以评估指标过去的表现。 NoiseReduction 是一种降低噪音的方法。可能的值:none - 不抑制噪声(在这种情况下只有 CutOff 参数起作用),constant - 噪声通过常数衰减,linear - 线性噪声抑制,对数 - 对数衰减,square - 根据平方根进行

Kolmogorov-Zhurbenko 滤波器可以被认为是一种特殊的窗函数,旨在消除频谱泄漏。此过滤器最适合平滑随机(包括金融)时间序列。 基于此过滤器的指标包含以下参数: iLength - 用于构建过滤器的原始矩形窗口的周期。有效值为 2 - 255。 iDegree - 过滤顺序。如果 iDegree=0,那么将获得一个简单的移动平均线。如果 iDegree=1,那么你得到一个三角形移动平均线。更高阶允许更好的平滑和噪声抑制。允许值为 2 - 255。此外,此参数影响指标的最终周期 = iLength + iDegree * (iLength - 1)。 iMultiplier - 一个乘数,显示从过滤器值计算的标准偏差数。
指示器的外观如图所示。

可以使用各种窗口函数来平滑时间序列。窗函数的特性可能彼此完全不同——平滑程度、噪声抑制等。该指标允许您实现主窗口函数并评估它们在金融时间序列上的表现。 指标参数: iPeriod – 指标周期。 iPeriod >= 2 iCenter 是窗口函数中心所在的参考索引。默认情况下,此参数为 0 - 窗口中心与指标中心重合。当 1 <= iCenter <= iPeriod 时,窗口函数的中心将移动,因此指标的某些特征将发生变化。在图 1 中,您可以看到中心的选择如何影响窗口功能和指标的显示。此参数可以以 0.5 为增量进行更改。 一些窗口函数使用附加参数 - ParameterA 和 ParameterB。它们会影响窗口权重。正因为如此,指标的特性发生了变化。该表显示了窗口函数和更改参数的限制(如果使用它们)。可以使用脚本 https://www.mql5.com/ru/market/product/72156 估计给定参数的窗口函数权重分布 Window
Parameter A
Parameter B
Bartlett - Hann window
Blac
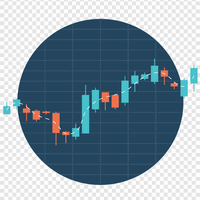
一些交易者在交易时以交易时段为指导。图 1 显示了一周内的平均价格波动。可以看出,不同日期的交易时段在持续时间和活动上有所不同。 该指标旨在估计每周周期内特定时间间隔的平均价格变动。它分别考虑了价格的上下波动,并可以确定市场可能出现高波动的时刻。 在图表上,向上运动显示在中线上方,向下运动显示在中线下方。绿色直方图显示了根据历史数据计算的平均移动。红色直方图显示实际价格变动。以点为单位的价格变动之间的累积差异会额外显示在右上角。计数器在每周开始时重置为零。 该指标可以在 M1 - D1 的所有时间范围内工作。所有指示灯设置与其外观相关,不影响其操作。 实时工作时,指标使用交易品种图表中的可用数据。并且在策略测试器中使用指标时,需要使其能够累积历史统计数据。

算术平均值或中位数可用于确定时间序列的中心趋势的度量。这两种方法都有一些缺点。算术平均值由简单移动平均线指标计算。它对排放和噪音很敏感。中位数表现更稳定,但在区间边界处会丢失信息。 为了减少这些缺点,可以使用伪中值信号滤波。为此,取一个小长度的中位数,并将其递归地应用于所研究的金融时间序列周期的所有值。由于这种方法,该指标使您能够更准确地识别周期性和趋势性价格变动。 指标的外部参数: 启动指标时,在“参数”选项卡中,选择将用于计算的价格常数(默认为关闭); iPeriod - 指标周期。此参数的值越高,指标对最新价格变化的敏感性就越低。此参数的最小值为 3; MaxBars - 限制计算的历史深度。如果指标需要很长时间才能启动,这会很有用。如果 MaxBars = 0,则没有限制,指标将应用于整个图表。

趋势使您可以预测价格变动并确定交易结束的主要方向。可以使用适合交易者交易风格的各种方法来构建趋势线。 该指标根据 von Mises 分布计算趋势运动的参数。使用这种分布可以得到趋势方程的稳定值。除了计算趋势之外,还会计算可能的上下偏差水平。 该指标根据当前价格值更新其值。他的行为显示在视频中:
指标参数: iPeriod - 用于计算趋势和水平的柱数 Shift - 继续线向前的柱数 WidthTrend - 趋势线的宽度 WidthLvl1 和 WidthLvl2 - 水平线的宽度 StyleTrend - 趋势线样式 StyleLvl1 和 StyleLvl2 - 水平线样式 ClrTrend - 趋势线颜色 ClrUp - 水平线的颜色 ClrDown - 水平线的颜色

柯西分布是胖尾分布的经典示例。粗尾表明随机变量偏离中心趋势的可能性非常高。因此,对于正态分布,随机变量与其数学期望之间的偏差为3个或更多标准偏差是非常少见的(3 sigma规则),对于柯西分布,与中心的偏差可以任意大。此属性可用于模拟市场中的价格变化。因此,柯西分布可以过滤出由意外和/或不可预测的因素引起的大而急剧的价格变动。 该指标使您可以选择要使用的价格。使用以下参数配置其指示器操作: iPeriod-计算的柱线数 Lvl 1-3-百分比水平偏差,允许值大于0且小于100(默认为50%,20%和10%) Shift级继续向右 该指标在交易中的使用是基于这样的假设,即价格在超过最高或最低水平后很可能会返回平均值。也就是说,如果价格超过10%的较低水平,则应该开仓买入交易;如果价格超过10%的较高水平,则应该开仓卖出交易(图1)。 同样,使用此指标,您可以判断趋势的阶段。为此,您需要评估指标的过去读数所处的水平(图2)。 特别是,可以确定趋势变化的时刻(图3-4)。
当然,可以以一种方式或另一种方式来调节电平,以提高信号的质量,而另一种则可以提高信号的质量。

在分析金融时间序列时,研究人员通常会初步假设价格是根据正常(高斯)定律分配的。这种方法是由于以下事实:可以使用正态分布来模拟大量实际过程。而且,该分布的参数的计算没有很大困难。 但是,当应用于金融市场时,正态分布并不总是起作用。金融工具的收益通常具有不同于正常形式的形式。太频繁和/或大的排放导致使用所谓的“重尾巴”分布。 在构建此指标时,我们将假设价格水平受拉普拉斯分布的影响。这种分布之间的主要区别在于,它允许更大范围的值。因此,拉普拉斯分布使模拟价格走势成为可能。此外,拉普拉斯分布是复合的,因此可以在不同条件下出现低值和高值的情况下使用。分布本身外观上与正常情况有很大差异。图的形状和位置取决于两个参数-b和m。
等级设定 拉普拉斯分布的主要优点是参数值范围大。因此,当使用正态分布时,大多数值都介于-3到+3之间。使用Laplace分布时,范围会扩展到–5 ... + 5。因此,可以更准确地对价格变化进行分类并做出更平衡的交易决策。表中显示了价格将在指定限制内的大概概率。 Range Probability,% Subrange Probability,% – 1…+1
6

The indicator is designed to measure the price volatility. This allows determining the moments for opening or closing trade positions more accurately. High intensity of the market indicates the instability of its movement, but allows for better results. And, conversely, low intensity of the market indicates the stability of its movement.
Parameters Bars to process - the number of bars to measure the price movements. A low value of this parameter allows determining the moments of rapid price mov

Lehmer均值可以看作是一个窗函数,其权重系数取决于计算中使用的变量的值。该平均值是非线性的,因为在其计算中使用了取幂。 指标的特征取决于两个参数: iPeriod - 指标周期,有效值大于等于2; iPower - 指数,在计算指标值时使用。有效范围是 -32768 到 32767
在 iPower = 0 时,我们得到调和平均值, iPower = 1 - 算术平均值, 对于 iPower = 2,反谐波平均值。 Lehmer 均值具有较大的指数,突出了时间序列的最大边界。对于负指数,强调最小值。由于此属性,Lehmer 均值可用于平滑时间序列和构建通道。
第一张图片显示了使用收盘价计算的通道,指数为 +500 和 -500。 第二张图片显示了同一通道,iPower = +1000 和 -1000。 在第三和第四个数字中,Lehmer 的平均值适用于 +/- 1000 和 +/- 5000 的最高价和最低价。

AIS Advanced Grade Feasibility 指标旨在预测未来价格可能达到的水平。他的工作是分析最后三个柱形图并在此基础上进行预测。该指标可用于任何时间范围和任何货币对。在设置的帮助下,您可以达到预期的预测质量。
预测深度 - 以条形图设置所需的预测深度。建议在 18-31 内选择此参数。 你可以超越这些限制。但在这种情况下,预测水平的“固定”是可能的(对于小于 18 的值),或者水平宽度过大(对于大于 31 的值)。
置信水平 1、置信水平 2 和置信水平 3 - 预测置信水平。可在 1-99 范围内设置。置信度 1 应该大于置信度 2,置信度 3 应该是最小的。 这些水平中的每一个都显示价格将达到此值的概率百分比,该值由预测深度参数确定的柱线数量决定。
Color lvl high 和 Color lvl low - 允许您选择线条的颜色 Style lvl - 允许您选择与级别对应的线条样式 宽度 lvl - 设置与级别对应的线的宽度
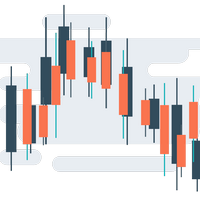
该指标主要用于手动交易。它会分析近期价格走势,并使用其自有算法进行处理。 基于此分析,该指标计算出最重要的价格水平。这些水平将价格值划分为三个区域:买入、卖出和中性。只有当价格位于相应区域时才应开仓。如果价格位于中性区域,则应考虑平仓或将其调整至盈亏平衡点。该指标还提供自身的开仓建议。这些点在图表上以点表示。
指标设置: Indicator period – 指标周期; Type – 此参数允许您选择加权系数的类型; Sensitivity – 指标敏感度(有效值为 0-8); Color of levels 和 Line style – 允许您选择指标水平的颜色和样式; Signal settings – 指标信号设置。
使用指标。选择时间范围(我推荐 M5-D1)。设置所需的指标周期。该指标首次启动可能需要一些时间。这是因为该指标需要统计数据,这些数据是根据历史数据收集的。该指标还包含警报选项和发送消息的功能。然而,在某些情况下,该指标可能会非常频繁地发出信号——大约每分钟一次。

AIS 正确平均线指标允许您设置市场趋势运动的开始。该指标的另一个重要品质是趋势结束的明确信号。指标不会重新绘制或重新计算。
显示值 h_AE - AE 通道的上限
l_AE - AE通道的下限
h_EC - 当前柱的高预测值
l_EC - 当前柱的低预测值
使用指标时的信号 主要信号是通道AE和EC的交点。
当 l_EC 线高于 h_AE 线时,可能会开始上升趋势。
在 h_EC 线低于 l_AE 线之后,可以预期下降趋势的开始。
在这种情况下,应注意 h_AE 和 l_AE 线之间的通道宽度。它们之间的差异越大,趋势就越强。您还应该注意 AE 通道实现的局部高点/低点。这时,价格变化的趋势变得最强。
可定制的指标参数 设置指标包括根据时间范围选择 LRH 参数。此参数的有效值范围为 1 到 350。
此参数越小,指标越敏感,错误信号的增加可能。另一方面,此参数不应设置得太高,因为指标会变得不那么敏感并会跳过信号。

通常,交易者面临着确定价格在不久的将来可能发生变化的程度的任务。为此,您可以使用Johnson分发类型SB。这种分布的主要优点是即使只有少量的累积数据也可以使用它。用于确定此分布参数的经验方法允许您准确地确定价格通道的最大和最小水平。 这些值可用于不同的情况。例如,它们可用于设置市场订单的止损和止盈水平,或挂单的入场点。此外,使用追踪止损时可以定向这些水平。此外,在历史足够大的情况下,指标可能预示着上升趋势或下降趋势的开始。嗯,或者说它的结束,如果这样的趋势是。 该指标的主要缺点是对价格排放的敏感度极高,以及对市场形势变化的反应较迟。 蓝色和红色线分别显示价格通道的最大值和最小值。绿线表示在给定市场情况下价格的均衡值。 使用 LB 参数配置指标。此参数确定将在计算中使用的柱数,其允许值在2-64之间。
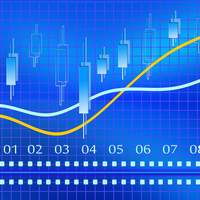
其中一种强大的分析方法是使用Levy流程对财务系列进行建模。这些过程的主要优点是它们可用于模拟大量现象 - 从最简单到最复杂。我只想说市场中分形价格变动的想法只是Levy过程的一个特例。另一方面,通过适当选择参数,任何Levy过程都可以表示为简单的移动平均值。图1显示了一个Levy过程的示例,其中片段放大了几次。 让我们考虑使用Levy流程来平滑价格图表的可能性。首先,您需要选择Levy过程的参数,以便它可以用于模拟线性过程。然后我们得到一个权重系统,其中包括不同符号的系数。有了这个,我们不仅可以平滑金融范围,还可以跟踪其中存在的反趋势和周期性成分。 通过选择参数 LF 来配置指示器的操作。它决定了故事的深度,并将对其进行分析。此参数的允许值位于0 - 255之间。用于计算的条形数将比此数字多两个。 蓝线表示高价平滑的结果,绿线表示收盘价,红线表示低价。 该指标的主要缺点是根据严格定义的算法执行抗锯齿,该算法没有考虑市场中的急剧和强烈变化。此外,与所有平滑指标一样,存在可以达到简单移动平均值的滞后。

为了隔离长期和非随机组件,不仅要知道价格变化了多少,还要知道这些变化是如何发生的。换句话说 - 我们不仅对价格水平的价值感兴趣,而且对这些水平相互替代的顺序感兴趣。通过这种方法,人们可以找到影响(或可能影响)特定时间点价格变化的长期和稳定因素。了解这些因素可以让您做出或多或少准确的预测。 让我们确定我们希望从财务系列的分析中得到什么具体结果: •首先,我们需要强调这一趋势,如果它存在于市场中; •其次,我们需要确定周期性成分; •第三,结果应足够稳定,可用于预测; •最后,我们的分析方法应该适应当前的市场形势。 为了满足指定的条件,我们使用相对价格变化的回归分析,并基于该模型做出指标。该指标的算法基于对历史数据的学习,其工作在交易者的完全控制之下。 LH 是一个参数,用于确定用于平滑金融系列的柱数。其允许值介于0到255之间。 UTS 是影响学习速度和深度的参数。它的值也在0到255之间。如果UTS的值为零,则在整个历史记录中进行学习。在所有其他情况下,训练集会不时更新。更新越频繁,UTS值越小。 该指标的主要缺点是,当平滑金融系列被认为是静止时,这可能会导致一些延迟。

很多时候,在金融系列的研究中应用他们的平滑。使用平滑,您可以删除高频成分 - 据信它们是由随机因素引起的,因此无关紧要。平滑总是包括一些平均数据的方法,其中时间序列中的随机变化相互吸收。大多数情况下,为此目的,使用简单或加权移动平均方法,以及指数平滑。 这些方法中的每一种都有其优点和缺点。因此,简单的移动平均值简单直观,但其应用需要时间序列的周期和趋势分量的相对稳定性。另外,信号延迟是移动平均值的特征。指数平滑方法没有滞后效应。但即使在这里也存在缺陷 - 只有在将系列与随机异常值对齐时,指数平滑才有效。 简单和指数平均值之间的合理折衷是使用加权移动平均线。但是,存在选择特定重量值的问题。让我们一起尝试解决这个问题。 因此,首先要定义我们希望从平滑过程中实现的目标: •首先,我们需要从价格序列中删除随机变化和噪音; •其次,我们希望识别异常排放和异常价格行为,这些行为也可用于贸易; •最后,平均程序应确定市场中存在的可持续趋势。 当然,我们希望平滑程序适应当前的市场情况。 为了获得理想的结果,我们将根据此价格水平与研究期间的最高和最低价格之间的差异来计算权重。通过这种方法,我们得到一个

尽管“ AIS Color Noise Filter ”指示器存在一些缺点,但使用它来平滑价格序列和预测价格的想法看起来非常有吸引力。 这是由于以下几个原因: 首先,考虑到几个噪声成分,可以建立相互独立的因素预测,从而提高预测质量; 其次,价格序列的噪声特征在整个历史中表现得相当稳定,从而可以获得稳定的结果; 最后,噪声变化使我们希望预测系统非常敏感,并且它对价格变化的反应将非常快。 因此,我们得到一个指标,尽管有所有简化,但能够准确预测价格将会移动的渠道。该指标的主要优点是速度快,易于学习。主要缺点是指标无法选择最重要的预测因素。 LH 是一个参数,用于设置进行预测的历史数据的长度。其允许值为0 - 255,而指标处理的柱数超过此参数指定的单位数。

该指标更具信息量。他的工作基于这样的假设,即市场中的价格变动可以表示为特定颜色的噪声,这取决于价格值分布的参数。由此,可以从不同角度分析价格变化,并将价格变动视为特定颜色的噪声,可以获得有关市场当前状态的信息并对价格行为进行预测。 在分析指标读数时,会考虑指标线的位置 - 它们位于当前柱的开盘价的上方或下方以及距离它的距离。 白噪声(白噪声) - 这种方法的特点是价格(当前和史前)被认为功率相等,这与简单的移动平均值相结合。白噪声信号更有可能证实这一特征 - 它越偏离当前价格,市场中的趋势运动就越强烈。相反,如果白噪声线接近开盘价,那么这就是趋势结束或横向价格变动的证据。 闪烁噪声(闪烁噪声)概述了趋势的上边界或下边界(取决于线是否高于或低于价格)。此外,这种噪音线与货币对价格的交叉点可以作为新趋势开始的证据,甚至是短期趋势的开始。 布朗噪声在很多方面的行为类似于指数平滑。因此,噪声线跟随价格,只有市场突然和突然的变化才有可能出现大的偏差。 蓝噪声显示趋势对当前趋势的强烈程度。由于蓝色噪声线与当前价格存在较大偏差,我们可以说趋势已经耗尽其力量并接近完成。 紫色噪音表明周期性或周期性价

选择StopLoss和TakeProfit的水平会对交易的整体表现产生非常强烈的影响。除了交易交易的明显参数 - 可能获胜或可能亏损的大小 - 止损和止盈的水平也会影响交易的预期持续时间以及一般交易的盈利能力。 如果您已使用“ AIS-ODT ”脚本确定了最佳事务持续时间,则可以开始确定与StopLoss和TakeProfit级别关联的参数。 为此,我们按以下步骤操作。首先,我们将确定在一个方向或另一个方向上的所有可能的价格偏差,并计算在一定时间内实现它们的概率。之后,您可以根据其大小,概率和预期利润值计算StopLoss和TakeProfit的最佳水平。 为此,请在感兴趣的货币对的图表和所需的时间范围内运行脚本。使用属性窗口中的ILB参数,设置交易仓位的期望持续时间,以柱数表示。在实用程序的工作期间,分析整个历史记录的数据,并选择最佳值。在脚本结束时,形成了两个文件 - “Buy.csv”和“Sell.csv”,其中包含获得结果的表 - 图1。 在表格的第一列中,指示了可能的TakeProfit大小,在第二列中,指示了最佳的StopLoss大小。第三列显示以百分比表示获胜这些参数的概
FREE

让我们看一下外汇市场价格变化的本质,而不是关注这些变化发生的原因。这种方法将使我们能够确定影响价格变动的主要因素。 例如,让我们看一下欧元兑美元货币对和H1时间框架的开盘价。对于这些价格,我们构建了Lameray图(图1)。 在该图中,可以看出价格变动基本上根据线性方程发生。要确定此等式的参数,可以使用最小二乘法。在这个特定的例子中,改变开盘价的等式采用以下形式: Open [i] = 0.99989 * Open [i + 1] +0.00013。 让我们来看看这个等式如何充分描述价格变动。为此,我们删除线性分量并分析残差(图2)。 从图中可以清楚地看出,这些残留物相当混乱,如果我们将它们视为噪声,我们可以得到一个相当简单的系统来预测下一个柱的开盘价,这是以该指标的形式实现的。

此指标可让您确定价格达到一个或另一个级别的可能性。它的算法非常简单,并且基于对特定货币对的价格水平的统计数据的使用。由于收集的历史数据,可以确定价格在当前柱形期间的变化程度。 尽管简单,但该指标可以为交易提供宝贵的帮助。因此,在其帮助下,可以确定交易头寸的TakeProfit和StopLoss水平。它可以帮助确定挂单的价格和确定TrailingStop的价格水平。 此外,该指标可以纳入现有战略。例如,您使用某种日内策略。然后,通过在D1时间框架上设置此指标,您可以在克服已经不希望开启新交易头寸之后获得水平。 该指标的主要缺点是它完全依赖于历史数据,并且不会以任何方式对某些当前的市场变化作出反应。 通过选择输入参数-L1 ... L4来执行该指标的设置 - 每个输入参数确定从每个柱的开盘价达到价格价格的概率。每个参数的值必须在99 ... 0之内,并且以下每个参数必须严格小于前一个参数。 尼古拉·尼古拉耶维奇(Nikolai Nikolaevich)是创造这个指标的意识形态灵感,如果你喜欢这个指标,那就写下几句话,我会告诉他。

该脚本的设计使交易者可以确定交易交易的平均持续时间,在此期间可能的利润和损失的比率将是最佳的。 首先,让我们看一下确定贸易交易最佳持续时间的一般方法。我们介绍以下变量: R - 交易的结果; T - 交易开放的时间; W - 上一笔交易结束与下一交易开盘之间的时间。 每个交易者都努力在最短的时间内获得最大的利润。这种愿望可以通过以下简单表达来描述: R/(T+W)→max 。 很明显,变量 T 和 W 取决于交易的总持续时间和交易数量。设 ATD 是交易的平均持续时间, N 是交易总数。然后,交易的平均持续时间应与其总数的平方根成比例增长,即: ATD~√N 。 但是,有一些有根据的问题出现 - 任何交易持续时间等同于其他交易持续时间,交易持续时间如何影响交易操作的结果?为了得到所提问题的答案,我们将对历史数据的价格行为进行一项小型研究。 我们继续如下。我们将历史数据划分为由一定数量的柱组成的系列,对应于交易的平均持续时间。在每个这样的系列中,我们计算最大价格变动,我们将引用更大的偏差 StopLoss ,并且更小 - 到 TakeProfit 。 之后,我们将计算整个历史中价格范围的
FREE

该指标是基于中值和移动平均特性的组合的顺序混合滤波器。
使用中值允许滤除价格序列值中的异常异常值和随机脉冲。同时,中值滤波器不会对价格变动的趋势起作用,而是保持不变。 由于中值滤波器是非线性的,因此使用简单移动平均值进行平均来平滑其值。这种方法使我们不仅可以更准确地识别趋势,还可以更准确地识别价格变动中的周期性成分。此外,它还增加了指标对价格变化的敏感度,并减少了价格序列与指标读数之间的延迟。因此,指标可以相当准确地警告新趋势的开始,以及旧趋势的结束。
您可以使用 FL 参数调整滤波器的深度及其灵敏度。其允许值为0到63.同时, 2 * FL + 1 条用于计算指标值。因此,FL值越大,指标显示价格图表的趋势越强。

This indicator implements the process of simple linear smoothing. One of the disadvantages of exponential smoothing is the rapid attenuation of the signal. This does not allow for a full-fledged monitoring of long-term tendency of a price series. Linear smoothing allows fine-tuning the signal filtering. The indicator is configured by selecting the parameters: LP - period of smoothing. The higher the value, the more long-term tendencies are displayed by the indicator. Valid values are from 0 to 2

This indicator studies the price action as a combination of micro-trends. All micro-trends are analyzed and averaged. Price movement is filtered based on this averaging. IP_High and IP_Low (blue and red dashed lines) show the instantaneous price movement. They display the forecast only for the current price values, taking into account only the number of bars defined by the 'Filter level' parameter. SP_High and SP_Low (blue and red solid lines) smooth the price movements with respect to history.

The indicator is based on the analysis of interaction of two filters. The first filter is the popular Moving Average. It helps to identify linear price movements and to smooth minor price fluctuations. The second filter is the Sliding Median. It is a non-linear filter. It allows to filter out noise and single spikes in the price movement. A predictive filter implemented in this indicator is based on the difference between these filters. The indicator is trained during operation and is therefore

This indicator uses the Fibonacci p-numbers to smooth a price series. This allows combining the advantages of the simple and exponential moving averages. The smoothing coefficients depend on the level of the p-number, which is set in the indicator parameters. The higher the level, the greater the influence of the simple moving average and the less significant the exponential moving average.
Parameters Fibonacci Numbers Order - order of the Fibonacci p-number, specified by trader. Valid values a

The indicator is designed to measure the price volatility. This allows determining the moments for opening or closing trade positions more accurately. High intensity of the market indicates the instability of its movement, but allows for better results. And, conversely, low intensity of the market indicates the stability of its movement.
Parameters Bars to process - the number of bars to measure the price movements. A low value of this parameter allows determining the moments of rapid price mov

AIS Advanced Grade Feasibility 指标旨在预测未来价格可能达到的水平。他的工作是分析最后三个柱形图并在此基础上进行预测。该指标可用于任何时间范围和任何货币对。在设置的帮助下,您可以达到预期的预测质量。
预测深度 - 以条形图设置所需的预测深度。建议在 18-31 内选择此参数。 你可以超越这些限制。但在这种情况下,预测水平的“固定”是可能的(对于小于 18 的值),或者水平宽度过大(对于大于 31 的值)。
置信水平 1、置信水平 2 和置信水平 3 - 预测置信水平。可在 1-99 范围内设置。置信度 1 应该大于置信度 2,置信度 3 应该是最小的。 这些水平中的每一个都显示价格将达到此值的概率百分比,该值由预测深度参数确定的柱线数量决定。
Color lvl high 和 Color lvl low - 允许您选择线条的颜色 Style lvl - 允许您选择与级别对应的线条样式 宽度 lvl - 设置与级别对应的线的宽度

AIS Weighted_Moving_Average 指标计算加权移动平均线,并允许您确定趋势市场运动的开始。
权重系数的计算考虑了每个柱的具体特征。这使您可以过滤掉随机的市场走势。
确认趋势开始的主要信号是指标线方向的变化和穿过指标线的价格。
WH(蓝线)是高价的加权平均值。 WL(红线)是最低价的加权平均值。 WS(绿线)是所有价格点的加权平均值。
选项 LH - 计算值的柱数。 要快速选择 LH,您首先需要检查是较高时间范围的倍数的值。
例如,指标设置为 M15。
然后我们检查以下LH的值
周期 M30/M15 = 2 期间 H1/M15 = 4 期间 H4/M15 = 16 周期 D1/M15 = 96 周期 W1/M15 = 480 它们之间的值也可能是有趣的。

该指标是两个改进的Lanczos滤波器的组合。 第一个过滤器用于推断价格。根据过去的价值,他预测当前柱内可能的价格变动。也就是说,它表明如果过去的趋势保持不变,价格会是多少。 第二个过滤器,用于平滑和平均窗口内的价格,由过滤器的级别决定。由于选择了权重,此过滤器最积极地响应价格变动中存在的周期性组件。 可以使用EF和IF参数调整指标。通过选择 EF 和 IF 的值,您可以获得有关趋势价格变动开始的信号。 EF - 指数滤波器的窗口大小。有效值为 EF = 0 ... 255 。并且在计算期间处理的条数是 2 * EF + 1 。该参数越大,价格序列的过去价值的影响越大。结果以实线绘制。 IF - 调整平均窗口的大小。 IF = 0 ... 255 的值。要计算的条数是 2 * IF + 1 。 IF 值越大,使用此过滤器检测到价格变动的较长时段。结果以虚线显示在图表上。

AIS Weighted_Moving_Average 指标计算加权移动平均线,并允许您确定趋势市场运动的开始。
权重系数的计算考虑了每个柱的具体特征。这使您可以过滤掉随机的市场走势。
确认趋势开始的主要信号是指标线方向的变化和穿过指标线的价格。
WH(蓝线)是高价的加权平均值。 WL(红线)是最低价的加权平均值。 WS(绿线)是所有价格点的加权平均值。
选项 LH - 计算值的柱数。 要快速选择 LH,您首先需要检查是较高时间范围的倍数的值。
例如,指标设置为 M15。
然后我们检查以下LH的值
周期 M30/M15 = 2 期间 H1/M15 = 4 期间 H4/M15 = 16 周期 D1/M15 = 96 周期 W1/M15 = 480 它们之间的值也可能是有趣的。

可持续的分配可用于平滑财务系列。由于可以使用相当深的历史来计算分布参数,因此在某些情况下,与其他方法相比,这种平滑甚至更有效。
该图显示了H1时间框架内EUR-USD货币对的开盘价分布十年的示例(图1)。看起来很迷人,不是吗?
该指标的主要思想是通过价格分散来确定可持续分配的参数,然后使用这些数据来平滑财务序列。由于这种方法,在给定的市场情况下,平滑后的值将趋于最可能的价格值。
使用参数LB组态指示器的操作。它的值确定平滑序列的长度,以巴表示。允许值在1-255的范围内。
蓝线表示平滑的高价,红线表示低价,绿线表示收盘价。
该指标的主要缺点是无法设置平滑窗口的宽度,因此指标在历史记录的所有部分中均保持稳定。因此,交易者必须根据其特定要求选择参数。

在分析金融时间序列时,研究人员通常会初步假设价格是根据正常(高斯)定律分配的。这种方法是由于以下事实:可以使用正态分布来模拟大量实际过程。而且,该分布的参数的计算没有很大困难。 但是,当应用于金融市场时,正态分布并不总是起作用。金融工具的收益通常具有不同于正常形式的形式。太频繁和/或大的排放导致使用所谓的“重尾巴”分布。 在构建此指标时,我们将假设价格水平受拉普拉斯分布的影响。这种分布之间的主要区别在于,它允许更大范围的值。因此,拉普拉斯分布使模拟价格走势成为可能。此外,拉普拉斯分布是复合的,因此可以在不同条件下出现低值和高值的情况下使用。分布本身外观上与正常情况有很大差异。图的形状和位置取决于两个参数-b和m。
等级设定 拉普拉斯分布的主要优点是参数值范围大。因此,当使用正态分布时,大多数值都介于-3到+3之间。使用Laplace分布时,范围会扩展到–5 ... + 5。因此,可以更准确地对价格变化进行分类并做出更平衡的交易决策。表中显示了价格将在指定限制内的大概概率。 Range Probability,% Subrange Probability,% – 1…+1

该指标旨在确定一天内最大交易活动的时间。 计算完成后,指标建立最重要的交易水平。 将这些水平与实际价格行为进行比较可以提供有关市场趋势强度和方向的信息。
指标的特点 时间范围必须低于 D1。 推荐时间范围:M15、M30 和 H1。 H1 以上的时间框架可以给出非常粗略的画面。 使用低于 M15 的时间框架可能会导致短暂的交易爆发。 该指标对历史数据敏感。 因此,我建议在图表窗口中至少设置 50,000 个柱。
指标参数 Base - 设置计算交易活动的基准期。 day - 计算交易活动时考虑了一天中的时间。 week – 交易活动的计算考虑了一天中的时间和一周中的某一天。
Width - 线宽。 ClrMean、ClrUp 和 ClrDn 是中、上、下交易水平的颜色。 Style1 - Style5 – 显示交易水平的样式。
AlertsOn - 打开交易时段开始的通知。 MailOn - 启用将消息发送到电子邮件的权限。 NotificationOn - 允许向移动终端发送消息。

该指标旨在确定一天内最大交易活动的时间。 计算完成后,指标建立最重要的交易水平。 将这些水平与实际价格行为进行比较可以提供有关市场趋势强度和方向的信息。
指标的特点 时间范围必须低于 D1。 推荐时间范围:M15、M30 和 H1。 H1 以上的时间框架可以给出非常粗略的画面。 使用低于 M15 的时间框架可能会导致短暂的交易爆发。 该指标对历史数据敏感。 因此,我建议在图表窗口中至少设置 50,000 个柱。
指标参数 Base - 设置计算交易活动的基准期。 day - 计算交易活动时考虑了一天中的时间。 week – 交易活动的计算考虑了一天中的时间和一周中的某一天。
Width - 线宽。 ClrMean、ClrUp 和 ClrDn 是中、上、下交易水平的颜色。 Style1 - Style5 – 显示交易水平的样式。
AlertsOn - 打开交易时段开始的通知。 MailOn - 启用将消息发送到电子邮件的权限。 NotificationOn - 允许向移动终端发送消息。

其中一个数字序列称为“森林火灾序列”。它被公认为最美丽的新序列之一。它的主要特点是该序列避免了线性趋势,即使是最短的趋势。正是这一属性构成了该指标的基础。 在分析金融时间序列时,该指标试图拒绝所有可能的趋势选项。只有当他失败时,他才会认识到趋势的存在并给出适当的信号。这种方法可以让人们正确地确定新趋势开始的时刻。然而,误报也是可能的。为了减少它们的数量,该指标添加了一个额外的过滤器。当新柱打开时会生成信号。在任何情况下都不会发生重绘。 指标参数: Applied Price - 应用价格常数; Period Main - 指标的主要周期,其有效值在 5 - 60 之间; Period Additional - 附加周期,此参数的有效值为 5 - 40; Signal Filter - 附加信号滤波器,有效值 0 - 99; Alerts - 启用后,指示器会在出现新信号时提醒您; Send Mail - 允许指标向电子邮件发送消息; Push - 允许您发送 Push 消息。

该指标基于椭圆形。这种形状用于空气动力学和空间技术。甚至子弹也有某种椭圆形。 在技术指标中使用这种形式可以在指标的灵敏度和稳定性之间实现折衷。这为其应用提供了额外的可能性。 指标参数: iType - ogive 表单的类型。 iPeriod - 指标周期。 iFactor 是用于抛物线和指数形式的附加参数。有效值为 0 - 255。如果 iFactor = 0,则指标退化为简单移动平均线。 iChannel - 一个允许您建立价格变动的上下通道的参数。有效值为-128到127。如果值为正,则绘制上通道,如果值为负,则绘制下通道。 通过组合这些参数,可以获得不同的结果。该指标可用于跟踪市场中的趋势价格变动。通过建立渠道,您可以获得价格可以移动的最近目标。通道边界值可以作为止盈止损。使用 iFactor,您可以实现金融时间序列所需的平滑程度。

该指标使用所谓的“邪恶”数字作为权重系数。它们的对立面是“可憎”的数字,也出现在该指标中。将数字划分为这两类与汉明权重有关,汉明权重由特定数字的二进制表示法中的单位数确定。 使用这些数字作为加权因子会产生趋势跟踪指标。此外,可恶的数字给出了更敏感的指标,而邪恶的数字给出了保守的指标。它们之间的差异不是很大,只有在市场价格剧烈波动时才能注意到。使用该指标可以帮助确定新趋势的开始。这使得可以更准确地确定开仓时刻。 指标参数: Type numbers - 选择数字类型,Evil 或 Odious; iPeriod - 指标周期。指标的灵敏度取决于此参数。它越小,对价格变化和市场趋势变化的敏感度越高。 图中显示了指标操作的示例。
该交易专家的主要目的是利用追踪止损来支持未平仓头寸。专家可以跟踪手动和其他顾问开设的头寸。 止损和止盈水平的计算是基于市场价格变化的统计关系。借助这一点,顾问可以选择利润和风险之间的最佳比率。一有机会,专家就会将仓位移至盈亏平衡点,然后开始跟踪价格。头寸的盈亏平衡点是根据累计掉期和佣金来计算的。 此外,还增加了使用您自己的算法开仓的功能。因此,对顾问进行了重大更改,包括输入参数。
追踪止损参数: Trailing Stop timeframe-顾问用来计算止损和获利水平的时间范围; UseTakeProfit-跟踪仓位时使用您自己的获利。
交易策略主要参数: Lot – 如果使用其内部策略,专家将开设的头寸数量; Slippage – 价格滑点(最小值 1); Best price-专家开仓时使用的过滤器; MinRisk-控制风险。启用此过滤器可以降低风险,但也会降低盈利能力。
策略参数: Symbol Name——顾问应该监控的符号。如果未指定参数,则使用安装顾问的符号; Strategy-选择您自己的交易策略。 None- 未发生该符号的交易; Strategy para
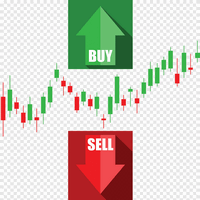
该指标使用价格序列的局部高点和低点。突出极值后,对它们的值进行平滑处理。因此,建立了两个通道 - 外部和内部。如果价格走势严格遵循线性趋势,则内部通道显示限制。外部通道以对数趋势显示价格变动的边界。 在计算通道后,该指标分析实际价格走势并提供开仓和平仓建议。蓝点 - 建立买入头寸,红色点 - 建立卖出头寸。相应的交叉盘建议关闭某些头寸,如果有的话。应该记住,并非所有信号都具有相同的强度和准确性。在某些情况下,正确方向的价格变动会很快结束,因此不可能获得大笔利润。在某些情况下,信号会导致损失(最后一张图片显示了此类信号的示例)。鉴于这些特点,我们可以推荐以下方法 - 使用浮动止盈,其值可以根据当前市场情况进行更改。还需要选择一个止损值,以便在出现关闭它们的信号之前关闭无利可图的头寸。 指标设置使用以下参数进行: iChannel - 调整通道的宽度。狭窄的通道会提供更多的信号,但也会增加误报的风险。 iSignal - 允许您配置信号的显示。默认情况下,仅显示最佳进入和退出信号。 iPeriod - 指标周期。该参数越大,通道宽度越大。因此,它也会影响信号的数量。 iFactor -
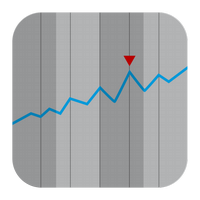
超几何级数用于计算该滤波器的权重系数。这种方法使您可以对时间序列进行相当有趣的平滑处理。 超几何滤波器权重的衰减速度不如指数和线性加权移动平均,但比平滑移动平均快。因此,此过滤器的行为在许多方面类似于移动平均线的行为。但是,它有几个优点。它的滞后远小于移动平均线。但与此同时,它比指数移动平均线保留了更多的信息。因此,超几何过滤器可以更好地突出金融时间序列的趋势和周期性成分。因此,该指标可用于那些使用不同类型移动平均线的交易策略。 指标的操作取决于一个参数: iPeriod - 此参数的有效值为 2 - 149。 该参数的值越小,指标对最新价格变化的反应越强。此参数的较大值可让您突出显示长期趋势。图中显示了具有不同 iPeriod 值的指标操作示例。

在做出交易决策时,不仅要依赖历史数据,而且还要依赖当前的市场状况,这很有用。为了使监视市场趋势的当前趋势更加方便,可以使用AIS Current Price Filter指示器。 该指标仅考虑一个方向或另一个方向上最重要的价格变化。因此,可以预测近期内的短期趋势-无论当前市场形势如何发展,当前价格迟早都会越过该指标的界限。从交易者的角度来看,最有趣的是价格已经尽可能远离指标水平的情况。这些时刻对于打开新的交易头寸可能是最理想的。 指标的操作不取决于所选的时间范围,而是使用两个参数进行配置。 FS -可以用来设置灵敏度阈值的参数。它越大,价格移动就应该越强,以便在指标中将其考虑在内。其可接受的值在0-255的范围内。如果选择零值,则灵敏度阈值将等于电流范围。 LB -设置在指标计算中使用的背景深度。此参数的有效值也在0到255的范围内。如果它等于零,则将考虑所有具有自学习控制的历史数据。并且,如果此参数等于1,则指标将仅标记FS参数指定的价格偏差。 其余参数使您可以配置图表上指标的显示。 Width -设置单个指示器线的粗细。 Color -指标线的颜色。 Style -指标显示样式。
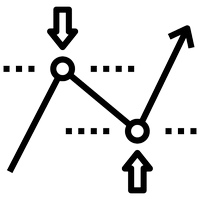
该指标显示最佳止盈和止损水平。这些水平是根据历史数据计算的。在第一次开始时,指标是根据历史训练的。之后,他评估价格在未来克服这个或那个水平的可能性,并选择最优化的选项来放置止损单。例如,选择止盈值以使利润最大并且价格达到其水平的概率尽可能高。止损水平应该是最小的,但达到它的可能性应该是最小的。这导致了具有最高可能获胜数学期望的级别。 此外,该指标可以以支撑位和阻力位的形式使用。为此,您可以组合不同的预测长度和偏移量。 指标参数: 长度 - 预测长度。此参数表示未来柱线交易的预期持续时间。 Shift - 在小节中移动。由于此参数,您可以查看过去的指标读数。 宽度 - 线宽。 ClrBuy - 买入头寸的线条颜色。 ClrSell - 卖出头寸的线条颜色。 StyleTP - 获利线样式。 StyleSL - 止损线样式。 信息 - 启用此选项时,止损和止盈值将显示在终端的“专家”选项卡中。

该指标基于离散哈特利变换。使用此转换允许您在处理金融时间序列时应用不同的方法。该指标的一个显着特点是它的读数不是指图表上的一个点,而是指指标周期的所有点。 处理时间序列时,指标允许您选择时间序列的各种元素。过滤的第一种可能性是建立在这种方法上的——所有不必要的高频分量都被简单地丢弃。第一个图展示了这种方法的可能性,选择CutOff参数,可以选择原始时间序列的细节(红线-只剩下主要信息CutOff = 0,黄色-主要和最低频率周期CutOff = 1 , 蓝色 - 所有最高频的噪声都被丢弃 CutOff = 4 )。然而,这不是唯一的可能性——噪声分量可以通过额外的过滤来抑制。 这两个选项都在该指标中实施。它的参数是: iPeriod - 指标周期 Shift - 指标相对于当前柱的偏移。通过更改此参数,您可以评估指标过去的表现。 NoiseReduction 是一种降低噪音的方法。可能的值:none - 不抑制噪声(在这种情况下只有 CutOff 参数起作用),constant - 噪声通过常数衰减,linear - 线性噪声抑制,对数 - 对数衰减,square - 根据平方根进行

Lehmer均值可以看作是一个窗函数,其权重系数取决于计算中使用的变量的值。该平均值是非线性的,因为在其计算中使用了取幂。 指标的特征取决于两个参数: iPeriod - 指标周期,有效值大于等于2; iPower - 指数,在计算指标值时使用。有效范围是 -32768 到 32767
在 iPower = 0 时,我们得到调和平均值, iPower = 1 - 算术平均值, 对于 iPower = 2,反谐波平均值。 Lehmer 均值具有较大的指数,突出了时间序列的最大边界。对于负指数,强调最小值。由于此属性,Lehmer 均值可用于平滑时间序列和构建通道。
第一张图片显示了使用收盘价计算的通道,指数为 +500 和 -500。 第二张图片显示了同一通道,iPower = +1000 和 -1000。 在第三和第四个数字中,Lehmer 的平均值适用于 +/- 1000 和 +/- 5000 的最高价和最低价。

Kolmogorov-Zhurbenko 滤波器可以被认为是一种特殊的窗函数,旨在消除频谱泄漏。此过滤器最适合平滑随机(包括金融)时间序列。 基于此过滤器的指标包含以下参数: iLength - 用于构建过滤器的原始矩形窗口的周期。有效值为 2 - 255。 iDegree - 过滤顺序。如果 iDegree=0,那么将获得一个简单的移动平均线。如果 iDegree=1,那么你得到一个三角形移动平均线。更高阶允许更好的平滑和噪声抑制。允许值为 2 - 255。此外,此参数影响指标的最终周期 = iLength + iDegree * (iLength - 1)。 iMultiplier - 一个乘数,显示从过滤器值计算的标准偏差数。
指示器的外观如图所示。

可以使用各种窗口函数来平滑时间序列。窗函数的特性可能彼此完全不同——平滑程度、噪声抑制等。该指标允许您实现主窗口函数并评估它们在金融时间序列上的表现。 指标参数: iPeriod – 指标周期。 iPeriod >= 2 iCenter 是窗口函数中心所在的参考索引。默认情况下,此参数为 0 - 窗口中心与指标中心重合。当 1 <= iCenter <= iPeriod 时,窗口函数的中心将移动,因此指标的某些特征将发生变化。在图 1 中,您可以看到中心的选择如何影响窗口功能和指标的显示。此参数可以以 0.5 为增量进行更改。 一些窗口函数使用附加参数 - ParameterA 和 ParameterB。它们会影响窗口权重。正因为如此,指标的特性发生了变化。该表显示了窗口函数和更改参数的限制(如果使用它们)。可以使用脚本 https://www.mql5.com/ru/market/product/72156 估计给定参数的窗口函数权重分布 Window
Parameter A
Parameter B
Bartlett - Hann window
Blac
一些交易者在交易时以交易时段为指导。图 1 显示了一周内的平均价格波动。可以看出,不同日期的交易时段在持续时间和活动上有所不同。 该指标旨在估计每周周期内特定时间间隔的平均价格变动。它分别考虑了价格的上下波动,并可以确定市场可能出现高波动的时刻。 在图表上,向上运动显示在中线上方,向下运动显示在中线下方。绿色直方图显示了根据历史数据计算的平均移动。红色直方图显示实际价格变动。以点为单位的价格变动之间的累积差异会额外显示在右上角。计数器在每周开始时重置为零。 该指标可以在 M1 - D1 的所有时间范围内工作。所有指示灯设置与其外观相关,不影响其操作。 实时工作时,指标使用交易品种图表中的可用数据。并且在策略测试器中使用指标时,需要使其能够累积历史统计数据。

算术平均值或中位数可用于确定时间序列的中心趋势的度量。这两种方法都有一些缺点。算术平均值由简单移动平均线指标计算。它对排放和噪音很敏感。中位数表现更稳定,但在区间边界处会丢失信息。 为了减少这些缺点,可以使用伪中值信号滤波。为此,取一个小长度的中位数,并将其递归地应用于所研究的金融时间序列周期的所有值。由于这种方法,该指标使您能够更准确地识别周期性和趋势性价格变动。 指标的外部参数: iPrice - 计算中使用的价格常数; iPeriod - 指标周期。此参数的值越高,指标对最新价格变化的敏感性就越低。此参数的最小值为 3; MaxBars - 限制计算的历史深度。如果指标需要很长时间才能启动,这会很有用。如果 MaxBars = 0,则没有限制,指标将应用于整个图表。

趋势使您可以预测价格变动并确定交易结束的主要方向。可以使用适合交易者交易风格的各种方法来构建趋势线。 该指标根据 von Mises 分布计算趋势运动的参数。使用这种分布可以得到趋势方程的稳定值。除了计算趋势之外,还会计算可能的上下偏差水平。 该指标根据当前价格值更新其值。他的行为显示在视频中:
指标参数: iPeriod - 用于计算趋势和水平的柱数 Shift - 继续线向前的柱数 WidthTrend - 趋势线的宽度 WidthLvl1 和 WidthLvl2 - 水平线的宽度 StyleTrend - 趋势线样式 StyleLvl1 和 StyleLvl2 - 水平线样式 ClrTrend - 趋势线颜色 ClrUp - 水平线的颜色 ClrDown - 水平线的颜色

柯西分布是胖尾分布的经典示例。粗尾表明随机变量偏离中心趋势的可能性非常高。因此,对于正态分布,随机变量与其数学期望之间的偏差为3个或更多标准偏差是非常少见的(3 sigma规则),对于柯西分布,与中心的偏差可以任意大。此属性可用于模拟市场中的价格变化。因此,柯西分布可以过滤出由意外和/或不可预测的因素引起的大而急剧的价格变动。 该指标使您可以选择要使用的价格。使用以下参数配置其指示器操作: iPeriod-计算的柱线数 Lvl 1-3-百分比水平偏差,允许值大于0且小于100(默认为50%,20%和10%) Shift级继续向右 该指标在交易中的使用是基于这样的假设,即价格在超过最高或最低水平后很可能会返回平均值。也就是说,如果价格超过10%的较低水平,则应该开仓买入交易;如果价格超过10%的较高水平,则应该开仓卖出交易(图1)。 同样,使用此指标,您可以判断趋势的阶段。为此,您需要评估指标的过去读数所处的水平(图2)。 特别是,可以确定趋势变化的时刻(图3-4)。
当然,可以以一种方式或另一种方式来调节电平,以提高信号的质量,而另一种则可以提高信号的质量。

该滤波器基于贝塞尔多项式。它的主要优点是时间延迟小。这个过滤器的另一个特点是它对金融时间序列的最新值的高度敏感。正因为如此,该指标突出了活跃的价格走势,同时消除了噪音偏差。 除了经典变体之外,贝塞尔系数的对数已作为加权函数添加到指标中。在这种情况下,指标变得更平滑,但同时当价格活跃时它可能会滞后。 在计算贝塞尔多项式时,会使用阶乘。因此,指标的周期从下方和上方受到限制。使用普通贝塞尔滤波器时,最好注意指标的小周期。由于随着周期的增加,指标的行为变得越来越稳定,差异变得越来越不明显。 这些图显示了两种过滤器类型的行为。 指标参数: TypeFilter - 正常/对数滤波器类型选择 iPeriod - 指标周期,有效值 3 - 85。
该指标主要用于手动交易。它会分析近期价格走势,并使用其自有算法进行处理。 基于此分析,该指标计算出最重要的价格水平。这些水平将价格值划分为三个区域:买入、卖出和中性。只有当价格位于相应区域时才应开仓。如果价格位于中性区域,则应考虑平仓或将其调整至盈亏平衡点。该指标还提供自身的开仓建议。这些点在图表上以点表示。
指标设置: Indicator period – 指标周期; Type – 此参数允许您选择加权系数的类型; Sensitivity – 指标敏感度(有效值为 0-8); Color of levels 和 Line style – 允许您选择指标水平的颜色和样式; Signal settings – 指标信号设置。
使用指标。选择时间范围(我推荐 M5-D1)。设置所需的指标周期。该指标首次启动可能需要一些时间。这是因为该指标需要统计数据,这些数据是根据历史数据收集的。该指标还包含警报选项和发送消息的功能。然而,在某些情况下,该指标可能会非常频繁地发出信号——大约每分钟一次。