Vertex Structure Dashboard
- 指标
- 版本: 1.30
- 激活: 5

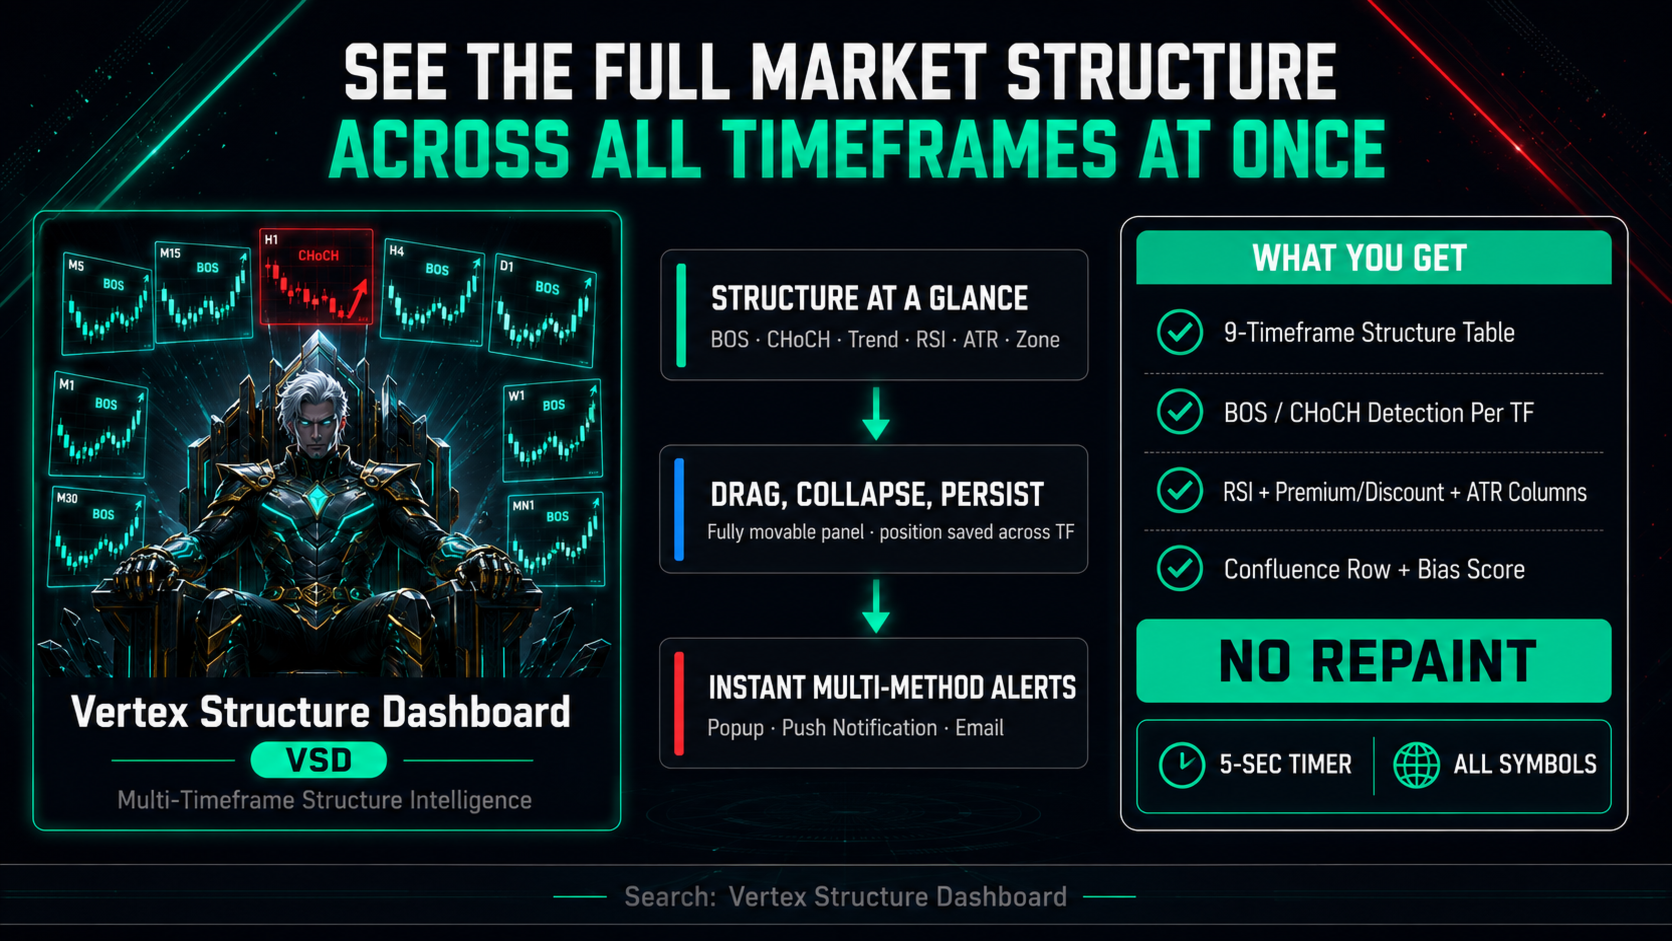
Vertex Structure Dashboard delivers a complete multi-timeframe market structure analysis in a single, compact panel. It monitors up to 9
timeframes simultaneously and displays trend bias, structural breaks, momentum, and value zones in real time — no tab-switching, no manual
tracking.
The panel is fully draggable and collapsible. Its position persists across timeframe changes through GlobalVariables, so your layout stays
exactly where you placed it.
How It Works
Each enabled timeframe is analyzed independently using swing-point logic. The indicator detects when price breaks a swing high (BOS or CHoCH
bullish) or swing low (BOS or CHoCH bearish) and tracks the most recent structural event per timeframe. All values update on every tick and
refresh automatically every 5 seconds via timer — session and bias data remain current even during quiet markets.
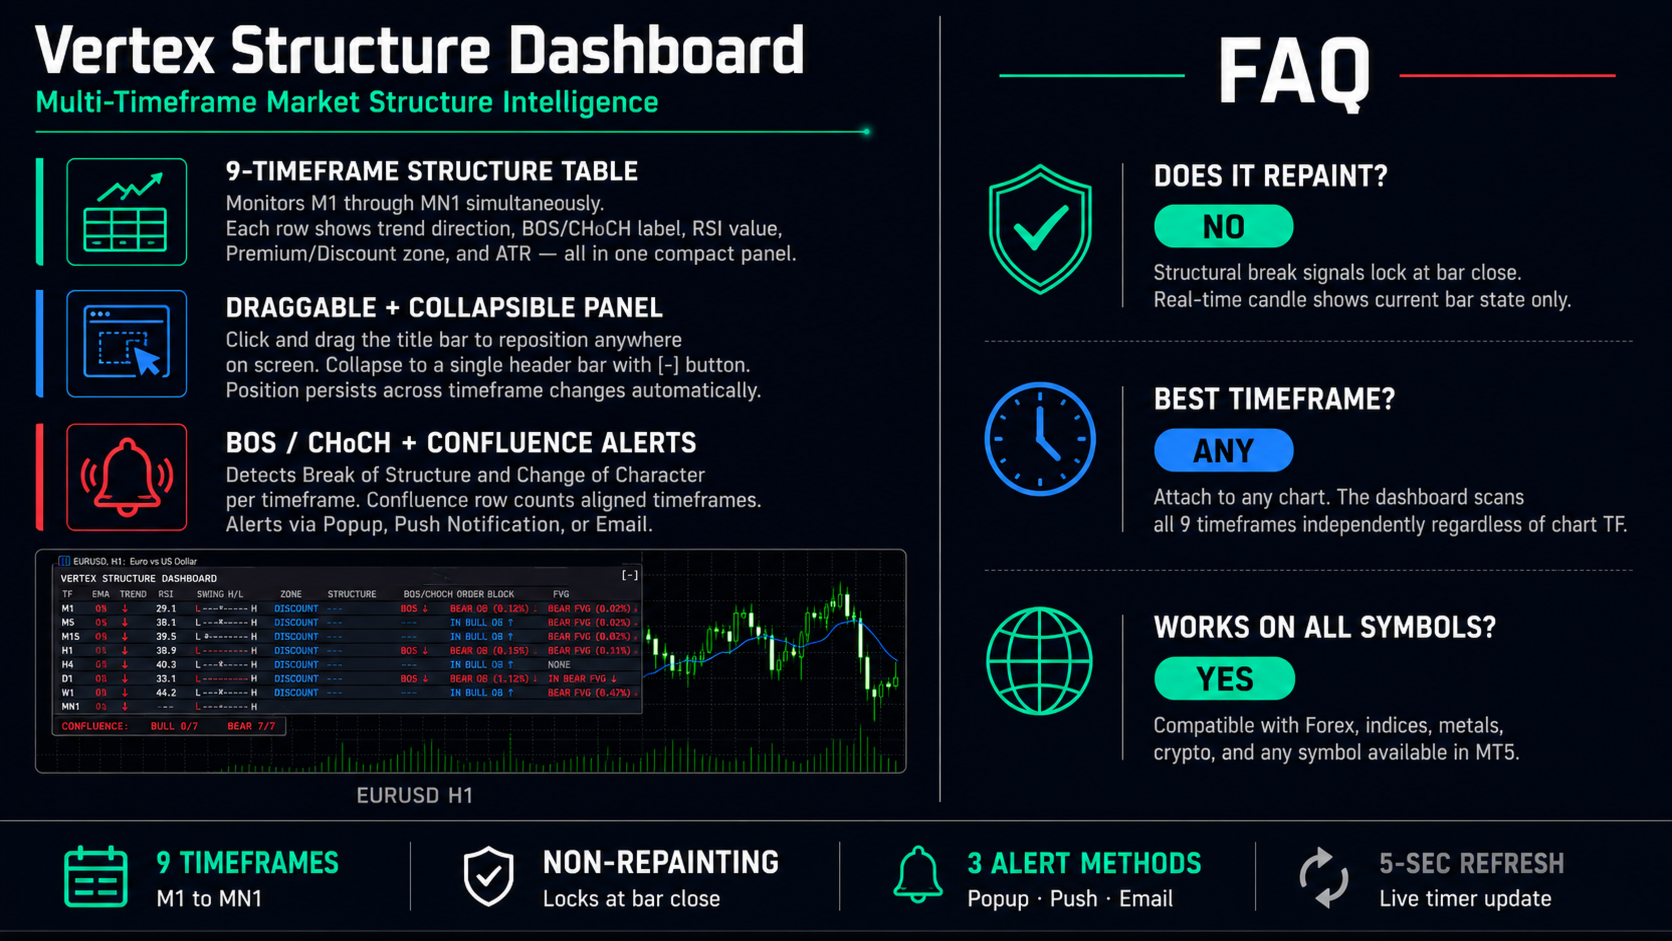
All signals are non-repainting. Structural break labels lock at bar close.
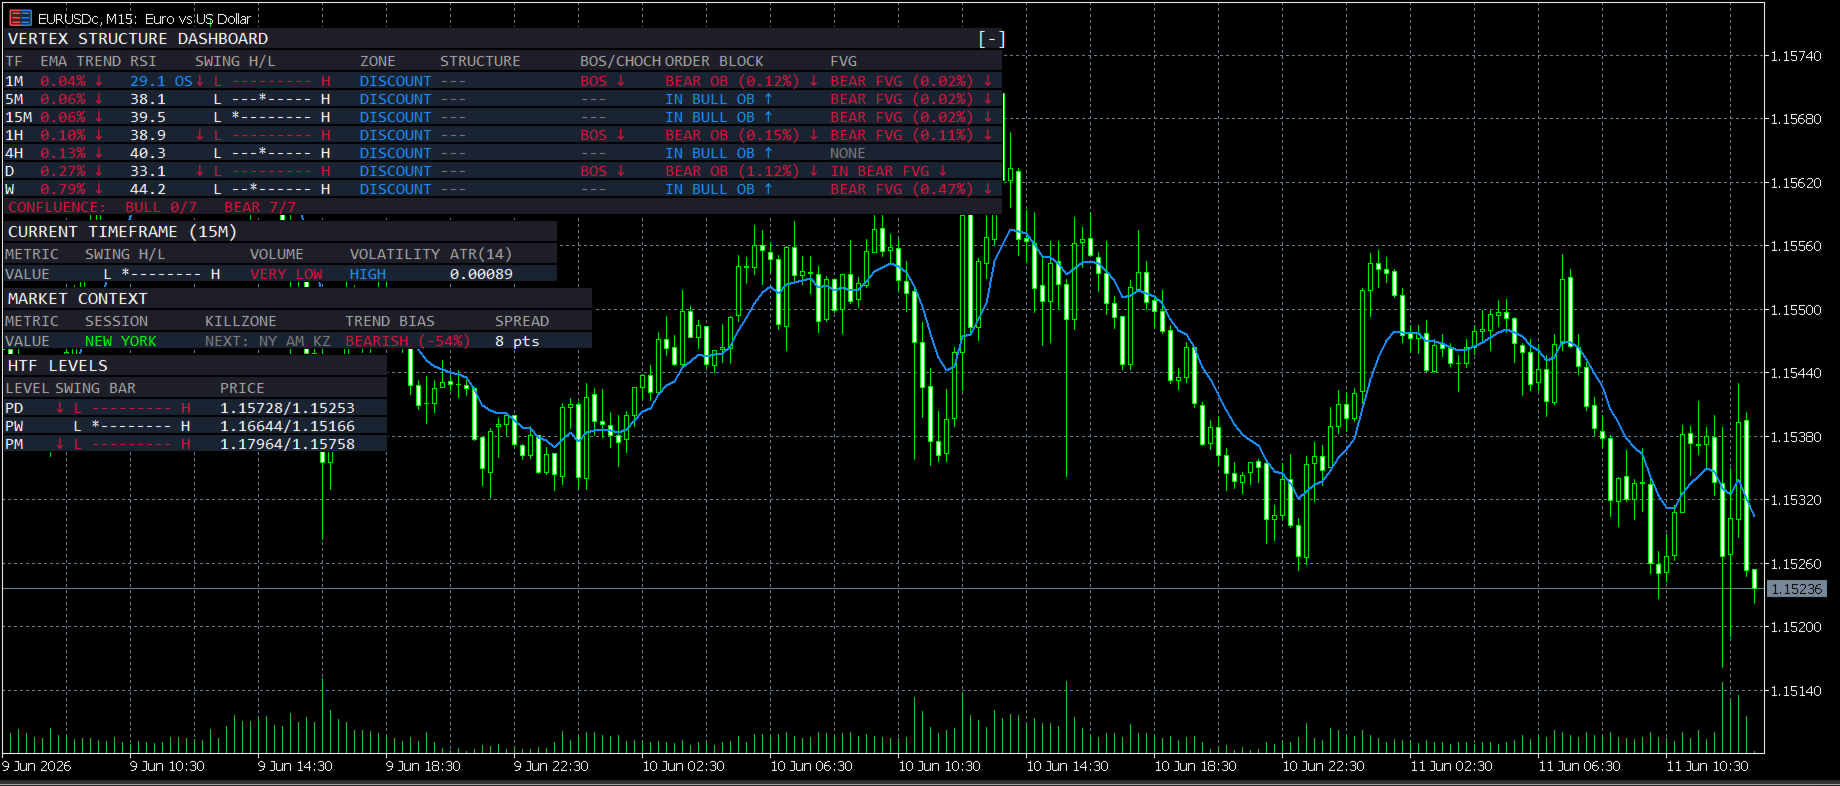
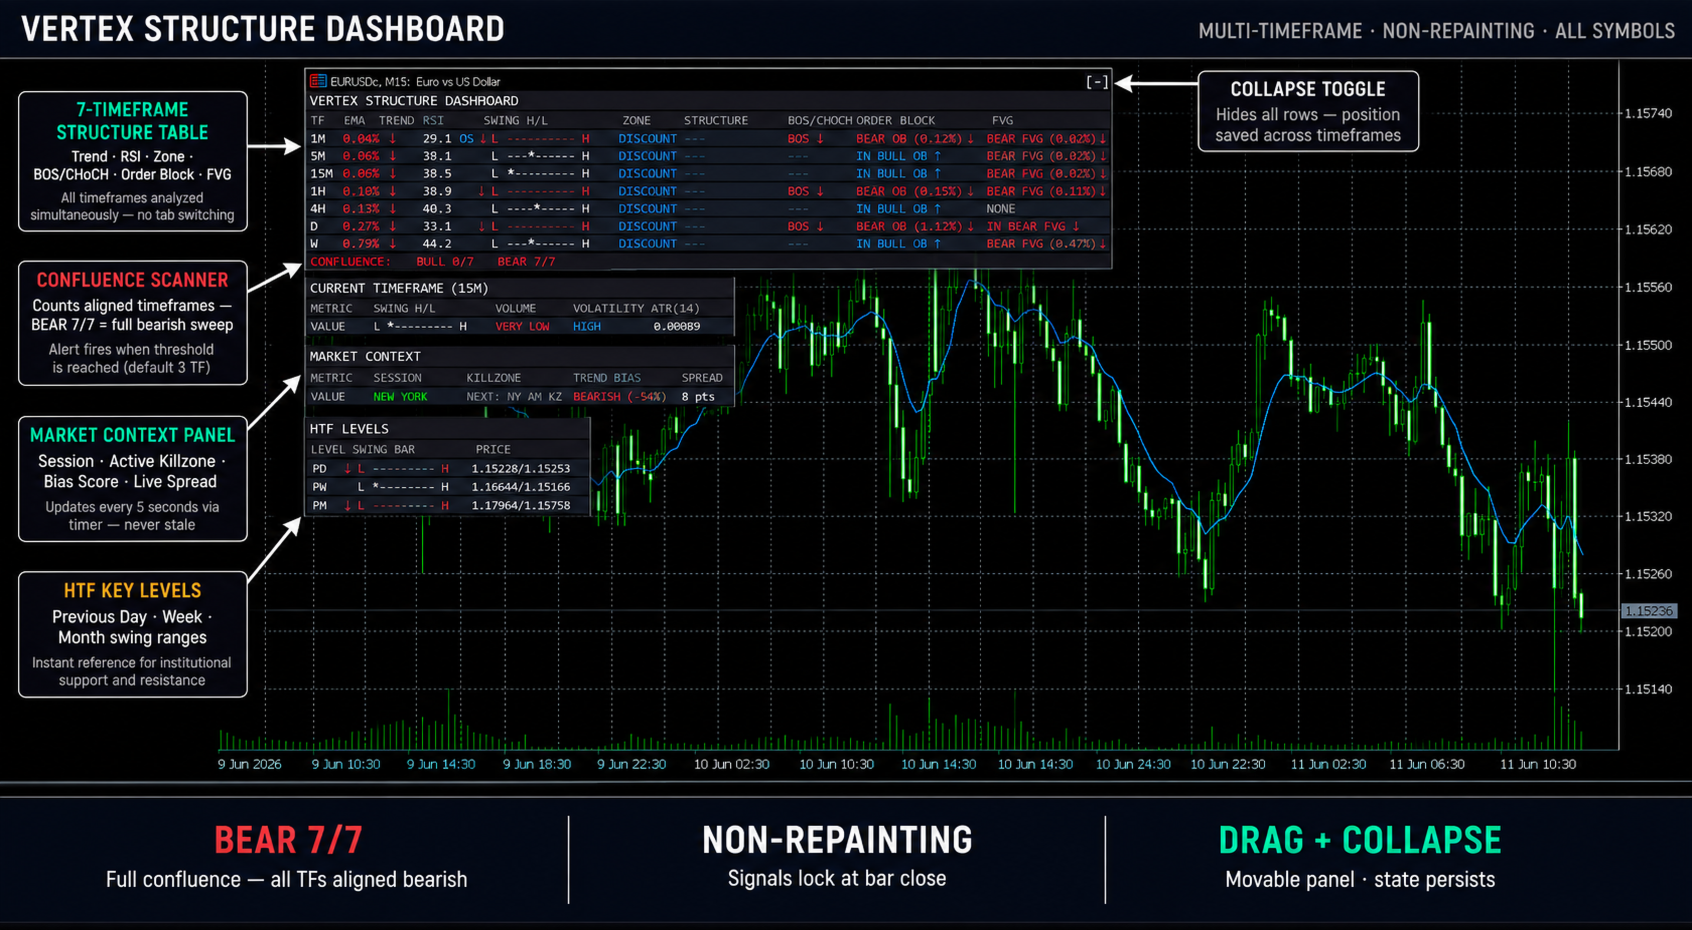
Multi-Timeframe Structure Table
The main table shows one row per enabled timeframe. Columns include:
- Timeframe label (M1 through MN1, user-selectable)
- Internal structure trend (arrow + BOS/CHoCH label)
- Swing structure trend
- RSI value with overbought / oversold highlight (≥70 red, ≤30 teal)
- BOS / CHoCH label with directional color
- Premium / Discount zone (price position relative to swing range midpoint)
- ATR value (14-period)
A Confluence row below the table counts how many timeframes show bullish vs. bearish bias and highlights the dominant direction.
Market Context Panel
Below the structure table, the Market Context panel shows:
- Current session (Asian / London / New York / overlap)
- Active killzone (Asian KZ 20:00–01:00 NY, London KZ 02:00–05:00, NY AM KZ 07:00–10:00, NY Lunch, NY PM)
- Trend bias direction with percentage score
- Spread in points (live)
Panel Controls
- Drag: click and hold the title bar, drag to any screen position
- Collapse: click the [-] button in the title bar to hide all rows; click [+] to restore
- Position and collapse state persist via GlobalVariables — survives timeframe changes and chart reload
Alert System
Alerts fire on BOS / CHoCH detection and on Confluence threshold. Three delivery methods are available independently:
- Popup alert (MT5 Alert window)
- Push notification (requires MetaQuotes ID in MT5 Options)
- Email (requires SMTP configuration in MT5 Tools → Options → Email)
Parameters
Display Settings:
Dashboard Corner — panel anchor corner (default: upper left)
Dashboard X Offset — horizontal position in pixels (default: 10)
Dashboard Y Offset — vertical position in pixels (default: 30)
Dashboard Font Size — 6 to 16, scales all rows proportionally (default: 8)
Show Behind Chart — place panel behind candles (default: off)
Timeframe Toggles:
Enable M1 / M5 / M15 / M30 / H1 / H4 / D1 / W1 / MN1 — individual on/off
Swing Length — pivot detection lookback (default: 5)
RSI Length — RSI period (default: 14)
Market Context:
Show Market Context — on/off (default: on)
Show Bias Score % — display percentage alongside direction (default: on)
Show Spread — display current spread in points (default: on)
Dashboard Columns:
Show RSI Column — on/off
Show BOS/CHoCH Column — on/off
Show Premium/Discount Column — on/off
Show ATR Column — on/off
Show Confluence Row — on/off
Alerts:
Alert on BOS/CHoCH — on/off (default: on)
Confluence Alert Threshold — minimum TF count to trigger (default: 3)
Alert Method: Popup — on/off (default: on)
Alert Method: Push Notification — on/off (default: off)
Alert Method: Email — on/off (default: off)
Color Theme:
Bullish Color — default electric teal
Bearish Color — default electric red
Panel Background — default near-black navy
Usage
Attach to any chart on any timeframe. Enable the timeframes you trade. Set Dashboard Corner and offsets to position the panel where it does
not obstruct your entries. Use Font Size 10–12 for larger monitors.
For confluence-based entries, wait for the Confluence row to show 3 or more timeframes aligned in one direction before executing. Use the RSI
column to avoid entries into overbought / oversold conditions on higher timeframes.
The Premium / Discount column shows whether price is above (Premium — avoid buys) or below (Discount — avoid sells) the midpoint of the
current swing range per timeframe.
Compatibility
Requires MetaTrader 5. Compiled for CPU Architecture X64 Regular. Compatible with all symbols and all timeframes. Tested on MT5 build 4000+.
Support
For questions and support, please use the comments section of this product page or contact the author through the MQL5 messaging system.