Fast Switching Symbols Periods Keyboard

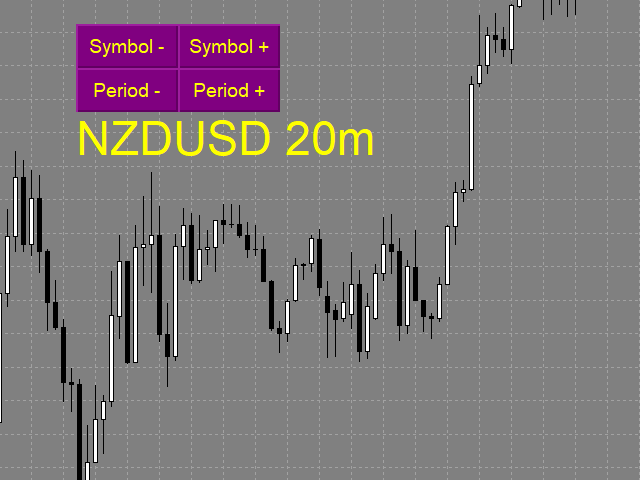
The indicator allows you to quickly switch from one instrument to another, from one time period to another using the keyboard or buttons on the monitor. Each command can be assigned a hot key from 0-9, a-Z (case-insensitive) and VK_OEM_COMMA ("<" on the keyboard) and VK_OEM_PERIOD (">" on the keyboard).

This can help you to operate the maximum number of instruments that are available at your broker, analyze more instruments/periods in less time.

This product cannot be tested in the tester, because the tester does not have the ability to change the symbol and period of the chart(on the chart where the test is already running).
All the functionality is shown in full in the video, description, and screenshots.

You can also save a default template with the added buttons, then they will be automatically added to the newly opened charts.

You can use the on-screen buttons or keyboard buttons to switch between different tools and time periods.
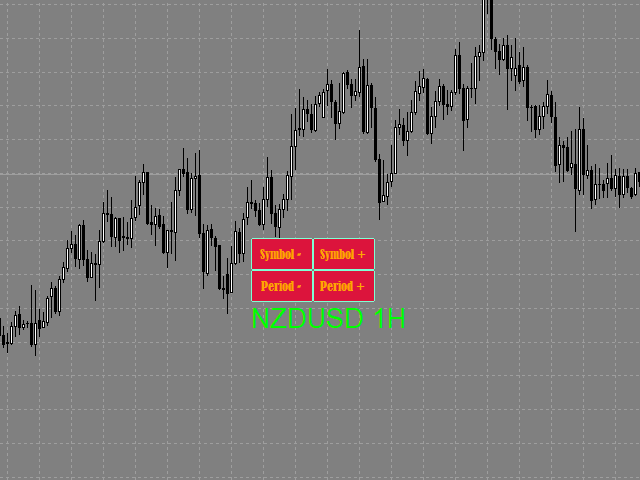
On-screen buttons can be dragged with the mouse. The text label "tool/period" moves along with the buttons.
You can hide on-screen buttons. In this case, the text label is moved to the upper-left corner. you can select the text label with the mouse and move it to any convenient location.
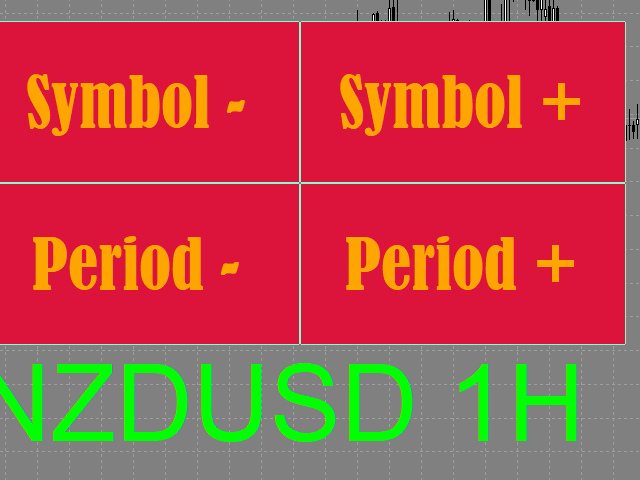
The size of on-screen buttons depends on their font and font size.
Keyboard shortcuts work regardless of whether there are on-screen buttons.


Settings

  • Buttons_Hide - hide/display on-screen buttons.
  • Button_Text_Color - the text color of the buttons.
  • Button_Background_Color - buttons background color (if Button_Background_Color=clrNONE, the buttons background is the same as the graph background color).
  • Button_Border_Color - the border color of the buttons.
  • Button_FontSize - button font size.
  • Button_Font - the font of the buttons.
  • Tag_Symbol_Period_Color - color of the caption on the chart of the current symbol/time period.
  • Tag_Symbol_Period_FontSize - font size of the caption on the chart of the current symbol / time period.
  • Tag_Symbol_Period_Font font of the caption on the chart of the current symbol / time period.

Description of the actions performed by the hot keys:

Each action can be assigned a hot key from 0-9, A-Z (case-insensitive) and VK_OEM_COMMA ("<" on the keyboard) and VK_OEM_PERIOD (">" on the keyboard).

  • Prev_Symbol (< by default) - switches the instrument to the next one (listed in Market Watch) from bottom to top (if the instrument is the first, switches to the last one, thus cycling in a loop).
  • Next_Symbol (> by default) - switches the instrument to the next one (listed in Market Watch) from top to bottom (if the instrument is the last, switches to the first one, thus cycling in a loop).
  • Period_Down (Z by default) - switches the time frame from the higher to the smaller (month - minute).
  • Period_Up (X by default) - switches the time frame from the smaller to the higher (minute - month).
    推荐产品
    Buy Sell Multiple Panel - Execute Bulk Orders in a Single Click! Description: Save time and seize market opportunities instantly. This powerful panel allows you to place multiple buy or sell orders simultaneously, each with custom lot sizes, take-profit, and stop-loss levels. Perfect for sophisticated entry strategies and managing complex trades efficiently. Key Features: Bulk Order Execution:   Open multiple market orders at once with just one click. Flexible Lot Sizing:   Set individual lot
    Скрипт используется для сбора статистики по переходам цены между уровнями сетки, размер которой задается в настройках (смотрите индикатор Transitions between levels ). Данные записываются в CSV файл. Есть два режима сбора статистики: SeparateTransition - учитывается каждый отдельный переход (смотрите скриншот 2). Время перехода - время, когда цена коснулась нового уровня. Accumulation - в файл записывается количество однонаправленных переходов  (смотрите скриншот 4). Например, -7 - семь пеерех

    Order Blocks Breaker
    Suvashish Halder
    5 (2)
    Introducing Order Blocks Breaker , a brand-new way to identify and leverage order blocks in your trading strategy. After developing multiple order block tools with unique concepts, I’m proud to present this tool that takes things to the next level. Unlike previous tools, Order Blocks Breaker not only identifies order blocks but also highlights Breaker Order Blocks —key areas where the price is likely to retest after a breakout. MT5 -  https://www.mql5.com/en/market/product/124102/ This tool inco
    Trend Ray
    Andriy Sydoruk
    The indicator shows the potential trend direction by cyclical-wave dependence. Thus, all the rays of the intersection will be optimal rays, in the direction of which the price is expected to move, taking into account the indicator period. Rays can be used as a direction for potential market movement. But we must not forget that the approach must be comprehensive, the indicator signals require additional information to enter the market.
    CorrelationUSD
    Andriy Sydoruk
    CorrelationUSD is a basic indicator, which is located on the chart. This tool allows you to monitor the relationship between assets, it reliably determines the patterns of quotation changes of one relative other asset. What is the indicator? All basic assets are interconnected, first of all, by a full complex of essential fundamental factors. For example, most currency pairs have a strong influence on measurements of each other’s quotes. Trends of this kind create macroeconomic news.
    红盘手交易助手,该EA不会自动交易,属于辅助工具,参考4小时图表波动率参数,自动给订单设置止损和止盈,以及追踪止损。策略带有风控标准,如下<1K为50 >1K<1W为100, >1W<5W为500, >5W<10W为1000, >10<20为2000。最大的特色是资金管理和风控功能。显示信号为5日平滑均线方向,布林线中轨平仓功能,开仓警报提醒功能,手数资金恢复功能,该EA可以在历史数据测试时下单,所以它相当于复盘工具。注意EA会修改所不带止损和止盈品种的定单,并执行风控标准。EA参数经过实盘反复验证和优化,可以直接使用默认参数。        参数与功能: FixBuy_target 指定后统一修改当前品种所有多单的止盈价; FixSell_target 指定后统一修改当前品种所有空单的止盈价; 一比一恢复资金 默认不启用,启用盈利按固定亏损金额数字平仓; Boll_close_order 默认不启用,启用后价格遇到布林线(周期30)中轨平仓; Lots 设置固定手数,开启UseMM后无效; UseMM 默认启用资金管理; 风险系数 启用; ATR止损基数 默认按4小时
    SwitchRefresh
    Ahmet Metin Yilmaz
    Switch & Refresh Charts This Script shows all the charts open on your MT4 platform in sequence with a delay of the second you specify, and refreshes the displayed charts if desired. When it comes to the first chart you started, it waits for the minute you specify and starts the same cycle again. The file you downloaded is located in the 'Scripts' section and when you come to the graphic you started to finalize, it should be removed from the chart as seen in the screenshot.
    Auto Fibo Pro m
    DMITRII GRIDASOV
    “Auto FIBO Pro” Crypto_Forex 指标 - 是交易中的绝佳辅助工具! - 指标自动计算并放置在图表斐波那契水平和局部趋势线(红色)上。 - 斐波那契水平指示价格可能反转的关键区域。 - 最重要的水平是 23.6%、38.2%、50% 和 61.8%。 - 您可以将其用于反转剥头皮或区域网格交易。 - 还有很多机会可以使用 Auto FIBO Pro 指标来改进您当前的系统。 - 它具有信息价差掉期显示 - 它显示所连接的外汇对的当前价差和掉期。 - 显示屏还显示账户余额、净值和保证金。 - 可以将信息价差掉期显示定位在图表的任何角落 . 点击这里查看高质量的交易机器人和指标! 这是仅在此 MQL5 网站上提供的原创产品。 ...............................................
    Partial Close MT4
    Ahmed Alaoui Chrifi
    This is a very simple, and easy-to-use Trade Manager with features like   Auto Partial Close, Auto Stop-loss, Breakeven. EA  closes a profitable position in partial closes when the price moves first in the direction of profits, and then comes back. EA monitors the position. If the price moves in the direction of profits, then ea establish the first level of rollback price at a distance. If the price continues to move in the direction of profits, this level of profit continues modifying this lev
    Price Magnets
    Ivan Simonika
    Price Magnet — Price Density and Attraction Levels Indicator Price Magnet is a professional analytical tool designed to identify key support and resistance levels based on statistical Price Density. The indicator analyzes a specified historical period and detects price levels where the market spent the most time. These zones act as “magnets,” attracting price action or forming a structural base for potential reversals. Unlike traditional Volume Profile tools, Price Magnet focuses on price-time d
    Trend PA
    Mikhail Nazarenko
    5 (3)
    The Trend PA indicator uses   Price Action   and its own filtering algorithm to determine the trend. This approach helps to accurately determine entry points and the current trend on any timeframe. The indicator uses its own algorithm for analyzing price changes and Price Action. Which gives you the advantage of recognizing, without delay, a new nascent trend with fewer false positives. Trend filtering conditions can be selected in the settings individually for your trading style. The indicator
    Automatically closes orders when profit per lot or total profit reaches your specified level Per a lot : The amount of wins per lot in the selected symbol. Each orders is calculated as 1 lot. Example: If EURUSD total lot is 2.05 and earnings per lot is $ 100, then 100 * 2.05 = 205 $. Orders will be closed when EURUSD has a total profit of $ 205. When the total of all orders on the selected symbol reaches the specified amount, it closes all orders belonging to the symbol. For example: There are 3
    Scalper RS
    Vitalyi Belyh
    Scalper RS - ​​ 是一种交易和分析指标,旨在识别价格图上最可能的反转点。 执行价格构建的指标算法允许您确定各种交易工具和时间范围内的价格反转组合。 使用变量参数“ Structuring ”,您可以为所需的交易图表和时间范围选择最佳设置。 最初,该指标是为了接收时间范围 M1 - M5 - M15 上的信号而创建的,但通过选择必要的参数,它可以配置为识别时间范围 H1 - H4 - D1 上的长期趋势。 适合剥头皮交易和短期交易。 信号箭头可以不重绘或可以重绘(可切换参数)工作。 所有信号均出现在蜡烛收盘时。 有几种类型的通知。 指标信号可用于顺势而为,也可逆势而为。 该指标可以作为单独的系统使用,也可以作为现有趋势交易系统的补充。
    Virtual Exchange Reserve Equity Monitor In an environment where exchanges offer increasingly high leverage ratios, it is all the more important for traders to tightly regulate their level of equity .  This software is designed to be run in the background on any virtual private server that can run Meta Trader 4/5.  It implements basic equity control functions ahead of the broker---allowing users to set their own equity trailing stop, an equity limit to lock-in a certain profit margin, and a unive
    FREE
    Trade statistics
    Makarii Gubaydullin
    所选时间段内的详细交易统计 查看我的  #1 交易管理器 :66+ 功能,包括扩展统计  |   联系我 如有任何问题 统计显示模式: 针对  选定的 货币对/交易工具 针对  所有交易   (" ALL ") 您可以选择要获取统计的时间段: 1 天 1 周 1 个月 2  个月 3  个月 6  个月 1 年 2 年 全部交易历史 显示的信息:  毛利润 毛亏损 总利润/亏损 交易数量 买入交易的盈利百分比 卖出交易的盈利百分比 总盈利交易百分比 平均持仓时间 盈利交易的平均持仓时间 亏损交易的平均  持仓时间 界面优势: 您可以  折叠面板 ,从而释放图表上的空间:(按钮 (^)); 您可以  移动面板  到图表上的任何位置:(按钮 < MOVE >); 深色 / 浅色界面主题 :(开关 " Dark "); 查看我的  #1 交易管理器 :66+ 功能,包括扩展统计  |   联系我 如有任何问题
    Magic Balance
    Daniil Evstratenko
    The indicator shows which trading pairs, strategies, robots and signals that you use are profitable and which are not. The statistic of trades and balance graph are displayed in the account currency and pips - to switch simply click on the graph. button "$"(top left) - minimize/expand and move the indicator panel button ">"(bottom right) - stretching and resetting to the original size Statistic of trades 1 line - account balance, current profit and lot of open trades; 2 line - the number of all
    Trade History Exporter automatically exports trade history to a CSV (comma separated values) file. Trade History Exporter: - automatically exports trade history every time a trade is closed - allows you to manually force an export by using the "W" key on your keyboard - can use Order Comments as Magic Numbers - useful for instance when using a Trade Copier - calculates the Net Profit per trade
    Download link for the sound files, it is to be placed in the MQL4 Sound Folder. https://www.mql5.com/en/blogs/post/762237 Simplify your trading with   Ultimate Price Alert , a lightweight and powerful utility tool designed for MetaTrader 4. This intuitive tool allows traders to set price alerts for all 28 major and cross forex pairs plus gold (XAUUSD) on a single chart, eliminating the need to open multiple charts and streamlining your workflow. Key Features: Multi-Pair Alerts on One Chart :
    Hello Traders! Version 3.0 of the script has been released!  What's new?  Thanks to your suggestions I have inserted these changes to the tool: 1 - Data input are now date picker, it will be easier and faster to set the data export period; 2 - A message box will check that there is not a file with the same name in your folder; 3 - Error message to check that data insert are correct. If you like this product, take a look to the FULL INTERFACE!   MT4 To Excel Interface This script is a very usefu
    This tool will allow you to export MetaTrader indicators data (Buffers) for any financial instrument present in your MetaTrader 4. You can download multiple Symbols and Timeframes in the same csv file. Also, you can schedule the frequency of download (every minute, 5 minutes, 60 minutes, etc.). No need to open a lot of charts in order to get the last data, the tool will download the data directly. The CSV File will be stored in the folder:   \MQL4\Files . MetaTrader 5 version :  https://www.
    FREE
    Risk Manager Pro MT4
    Jhojan Alberto Tobon Monsalve
    Risk Manager Pro is a simple utility that calculates the necessary lots with the risk percentage and the pips of stop loss, before opening positions. The web calculators can be useful in some cases but they are not efficient to open operations in real time. In the trading days, there are few opportunities to open positions and when the opportunity arises, the seconds make the difference. This is not possible with conventional web calculators, since to calculate the size of an operation regarding
    “可调分形” - 是分形指标的高级版本,非常有用的交易工具! .................................................................... - 众所周知,标准分形 MT4   指标根本没有设置 - 这对交易者来说非常不方便。 - 可调分形解决了这个问题 - 它具有所有必要的设置: - 指标的可调周期(建议值 - 高于 7)。 - 价格高点/低点的距离可调。 - 可调分形箭头设计。 - 指标内置移动和 PC 警报。 点击这里查看高质量的交易机器人和指标! 这是仅在此 MQL5 网站上提供的原创产品。 ....................................................
    The utility is designed to close several types of orders. Closing is done by pressing the hot key. How to place and delete orders by voice using the utilities of this type, see the video below the description.  https://www.youtube.com/channel/UCTpVWJkEic6TzoXr0qc9RIw/featured Provided closing options: KEY "1" DELETE BUY STOP. KEY "2" DELETE SELL STOP. KEY "3" DELETE BUY AND SELL STOP. KEY "4" DELETE BUY LIMIT. KEY "5" DELETE SELL LIMIT. KEY "6" DELETE BUY AND SELL LIMIT. KEY "7" DELETE ALL PEND
    FREE
    MQL5 博客: https://www.mql5.com/en/blogs/post/761446 MT4 版本: https://www.mql5.com/en/market/product/136790 MT5 版本: https://www.mql5.com/en/market/product/136791 Time Wizard 是一款专业的交易助手,专为需要在简洁的控制面板上实现速度、时机和执行控制的交易者而设计。 这款智能交易系统 (EA) 专为事件驱动交易、定时执行和快速半自动订单管理而设计。它允许您提前准备订单、定义精确的执行时间、设置分层挂单、通过止损和止盈管理风险,并通过图表上的简洁界面监控所有信息。 无论您是围绕经济事件、开盘、突破点还是您自己的自定义计划进行交易,Time Wizard 都能帮助您以结构化和纪律性的方式执行交易。 主要功能 1. 基于时间的订单执行 设置具体的执行日期和时间,EA 即可在需要时精准下单。 此功能非常适合: 新闻交易 突破交易设置 预先计划的市场执行 定时下单 2. 挂单阶梯 创建多层挂单,层间距和
    Indicator Values Panel
    AL MOOSAWI ABDULLAH JAFFER BAQER
    Indicator Values Panel – Your Ultimate Indicator Monitoring Solution! Are you tired of constantly switching between indicators to check values? Want a simple, elegant, and real-time solution that puts all key indicator readings in one place? Indicator Values Panel is the ultimate utility for traders who want a clear and concise display of important indicator values – directly on their chart! What is Indicator Values Panel? Indicator Values Panel is a sleek, easy-to-use utility that provides rea
    This indicator is useful for monitoring the performance of individual strategies or even everything of the entire portfolio of strategies directly on your MT4. In this way you can view the equity line and the balance line directly on the chart. In addition, you can set a line based on the percentage number of DD Max that the individual strategy can reach. Try it.
    Data Downloader
    Mounir Cheikh
    5 (1)
    This tool will allow you to export candles data (Open, High, Low, Close, Volume) for any financial instrument present in your MetaTrader 4. You can download the data of multiple Symbols and TimeFrames in the same csv file at once. You can schedule the frequency, simply choose the refresh interval (1 minute minimum, if 0 then the extraction will be done once) and the tool will do the work. No need to open a lot of charts in order to get the last sync, the tool will download the data directly. The
    FREE
    The indicator detects and displays М. Gartley's Butterfly pattern. The pattern is plotted by the extreme values of the ZigZag indicator (included in the resources, no need to install). After detecting the pattern, the indicator notifies of that by the pop-up window, a mobile notification and an email. The pattern and wave parameters are displayed on the screenshots. The default parameters are used for demonstration purposes only in order to increase the amount of detected patterns. Parameters z
    This product is a full-screen dashboard that constantly monitors account performance based on historical trading history. It has a graphical line for balance and equity, and displays wins, losses, and percentages for the current and past day, month, week, and year. When there are no open positions, the balance and equity lines are superimposed; when a position is opened, the yellow equity line is also visible.
    FFx Momentum
    Eric Venturi-Bloxs
    4 (1)
    The purpose of this new version of the MT4 standard indicator provided in your platform is to display in a sub-window multiple timeframes of the same indicator. See the example shown in the picture below. But the display isn’t like a simple MTF indicator. This is the real display of the indicator on its timeframe. Here's the options available in the FFx indicator: Select the timeframes to be displayed (M1 to Monthly) Define the width (number of bars) for each timeframe box Alert pop up/sound/ema
    FREE
    该产品的买家也购买
    欢迎来到 Trade Manager EA——这是一个终极风险管理工具,旨在使交易变得更直观、精准和高效。它不仅仅是一个下单工具,而是一个用于无缝交易计划、仓位管理和风险控制的全面解决方案。不论您是新手交易员、资深交易员,还是需要快速执行的剥头皮交易员,Trade Manager EA 都可以满足您的需求,适用于外汇、指数、大宗商品、加密货币等各种市场。 借助 Trade Manager EA,复杂的计算已成过去。只需分析市场,在图表上用水平线标记入场、止损和止盈,设置您的风险水平,Trade Manager 就会立即计算出理想的头寸规模,并实时显示以点、账户货币计价的止损和止盈。每笔交易都得以轻松管理。 主要功能: 头寸规模计算器 :根据定义的风险瞬间确定交易规模。 简单的交易计划 :在图表上用可拖动的水平线直接计划交易,设置入场、止损和止盈。 实时显示 SL 和 TP :以账户货币、点或分显示止损和止盈,便于分析。 高级保护工具 盈亏平衡选项 : 基本盈亏平衡 :当您的交易达到设定水平时自动保护利润。 多级盈亏平衡 :设置多达 4 个级别以逐步保护利润。 尾随止损选项 : 基本尾随
    一旦您確定了要進行交易的關鍵區域,就會自動交易支撐和阻力或供需區域。該 EA 允許您只需單擊即可繪製買入和賣出區域,然後將它們準確地放置在您預期價格轉向的位置。然後,EA 會監控這些區域,並根據您為這些區域指定的價格行為自動進行交易。一旦進行初始交易,EA 就會在您放置的相反區域(即目標區域)獲利。然後,您有兩種選擇,要么關閉交易並繪製新的區域進入,要么獲利退出並立即反向反向交易,創建「始終在」的市場風格策略。 包含輸入和策略的完整手冊位於: https://www.mql5.com/en/blogs/post/760256 該 EA 專為在市場上不使用固定或硬止損的頭寸交易者或美元成本平均交易策略而設計。相反,它的目的是透過在下一個可用支撐或阻力區域以相同方向進行新交易來縮小不正確的交易,並調整您在市場中頭寸的平​​均價格。如果需要的話,還有備用退出標準,形式為每筆交易的最大損失金額或基於時間的退出。 只需按下按鈕即可繪製準備放置在感興趣等級的區域。 關閉按鈕和關閉最舊的按鈕可退出所有交易,或僅退出舊交易(如果它們跌幅過大而無法立即調整您的平均頭寸)。 適用於任何時間範圍內的
    News Filter EA: Advanced Algo Trading Assistant News Filter EA is an advanced algo trading assistant designed to enhance your trading experience. By using the   News Filter EA , you can integrate a Forex economic news filter into your existing expert advisor, even if you do not have access to its source code. In addition to the news filter, you can also specify   trading days   and   hours   for your expert. The News Filter EA also includes   risk management   and   equity protection   features
    DrawDown Limiter MT4
    Haidar Lionel Haj Ali
    5 (8)
    Drawdown Limiter EA You are in the right place if you were searching for Drawdown control, Drawdown limiter, Balance protection, Equity Protection or Daily Drawdown Limit related to Prop Firm, FTMO, or Funded account trading, or if you want to protect your trading account. Have you suffered from controlling your drawdown when trading funded accounts? This EA is meant for you. Prop firms usually set a rule called “Trader Daily Drawdown”, and if it is not respected, you are disqualified.  I am an
    Support and Resistance Dashboard for MT4 is a multi-timeframe and multi-symbol scanner and alert system that finds S/R zones and pivot points for all timeframes and symbols and alerts when price has interaction with them. If you are using support and resistance (or supply and demand) zones in your trading strategy, this dashboard and its alert and filtering system is a big time saver for you. Download demo version   (works on M 1,M5,M30,W1   timeframes) Full description of scanner parameters ->
    Telegram to MT4 Multi-Channel Copier 可自动将您 Telegram 频道中的交易信号直接复制到 MetaTrader 4。无需机器人,无需浏览器扩展,无需手动复制。您在 Telegram 上收到信号,EA 会在几秒钟内在您的终端上开仓。 本产品包含两个组件:一个监听您 Telegram 频道的 Windows 应用程序,以及在您的 MT4 终端上执行信号的 EA。同时也提供 MT5 版本。 设置指南和应用程序下载: https://www.mql5.com/en/blogs/post/768988 工作原理 Windows 应用程序使用您自己的 API 凭据连接到 Telegram,而不是机器人。这意味着它可以读取您订阅的任何频道、群组或话题,包括私人和 VIP 频道。检测到信号后,它会进行解析并发送给 EA。EA 根据您的经纪商解析交易品种名称,基于您的风险设置计算手数,然后开仓。 整个过程都是自动的。您无需守在电脑前。 打开应用程序并登录 Telegram(仅第一次)。 选择要监听的频道或话题。 按下 Start。EA 会处理其余的一切。 支持的
    Strategy Builder offers an incredible amount of functionality. It combines a trade panel with configurable automation (covert indicators into an EA), real-time statistics (profit & draw down) plus automatic optimization of SL, TP/exit, trading hours, indicator inputs. Multiple indicators can be combined into an single alert/trade signal and can include custom indicators, even if just have ex4 file or purchased from Market. The system is easily configured via a CONFIG button and associated pop-up
    PZ Trade Pad Pro MT4
    PZ TRADING SLU
    3.67 (3)
    这是一个可视化的交易面板,可帮助您轻松进行交易管理,避免人为错误并增强交易活动。它结合了易于使用的视觉界面以及完善的风险和位置管理方法。 [ 安装指南 | 更新指南 | 故障排除 | 常见问题 | 所有产品 ] 易于使用 从图表轻松交易 精确的风险管理交易,无忧 保本是重中之重 让利润不受您的关注 尽快享受无风险交易 所有已开通交易的自动追踪止损 交易开始后立即设置初始止损 进行交易后,EA将执行以下任务: 初始止损/获利被自动放置 它会尽快锁定自由行(可选) 它将止损首次移动到盈亏平衡点(可选) 它使用您所需的方法跟踪止损,直到止损为止 其他很酷的功能是: 出色的终端活动报告 单一但功能强大的尾随止损方法 干净的图表界面 没有输入参数 我进行交易后会怎样? 这是您进行交易后EA的操作: 它放置初始止损并获利订单。 尽快搭便车并确保保本。默认情况下,这是通过在达到盈亏平衡点时关闭50%的交易来完成的,默认情况下为5点。这意味着,如果您日后被淘汰,您将一无所获(可选)。 盈亏平衡后,跟踪止损开始运行。 它跟踪止损,直到止损为止,让利润运行。 尾随止损如何运作? 追踪止损表示为所管
    The product will copy all telegram signal to MT4   ( which you are member  ) , also it can work as remote copier.  Easy to set up, copy order instant, can work with almost signal formats, image signal, s upport to translate other language to English Work with all type of channel or group, even channel have "Restrict Saving Content", work with  multi channel, multi MT5 Work as remote copier: with signal have ticket number, it will copy exactly via ticket number. Support to backtest signal. How to
    MT4 至 Telegram 信号提供者 是一款易用、可完全自定义的工具,它使发送信号到 Telegram 成为可能,将您的账户变成信号提供者。 消息的格式 可以完全自定义! 但是,为了简便使用,您也可以选择一个预设模板,并能够启用或禁用消息的特定部分。 [ 演示 ]  [ 手册 ] [ MT5 版本 ] [ Discord 版本 ] [ Telegram 频道 ]  New: [ Telegram To MT5 ] 设置 可通过 用户指南 获取逐步说明。 无需了解 Telegram API;开发者提供所需的一切。 主要特性 自定义发送给订阅者的订单详情的能力 您可以创建分层订阅模型,例如铜牌、银牌、金牌。金牌订阅可获得所有信号等。 按订单号、符号或备注过滤订单 包括执行订单的图表的屏幕截图 在发送的屏幕截图上绘制已关闭的订单,以便额外验证 推迟发送新订单消息的可能性,以便在发送前对位置进行调整 订单详情的全透明度: 新的市场订单 *附带屏幕截图 订单修改(止损、获利点) 已关闭订单 *附带屏幕截图 部分关闭订单 ** 新的挂起订单 修改的挂起订单(进场价格) 挂起订单激活(
    一款面向手动交易的专业面板,把完整的交易流程都收进图表上的一个窗口,从精准入场到账户防护。按设定的风险精确计算手数,借助 RR Tool 直接在图表上用线条搭建交易,开立市价单和挂单、网格与 OCO。持仓的后续管理交给面板打理:最多五级分批平仓、六种跟踪止损、保本以及 Virtual SL/TP。日、周、月三档限额守护本金,一旦被突破即自动触发。 使用指南与免费 Live 演示 免费的 Live 演示版可在此获取 ( Free Live Demo )。 产品的使用指南见此 ( User Manual )。 NT Trade Manager 把交易者的整套工作流程收进图表上一块紧凑的面板,无需在终端各窗口之间反复切换,也不必在每次入场前埋头计算。它为坚持手动、独立判断的交易者而打造:主观交易者、剥头皮和波段交易者,外汇、金属、指数、大宗商品乃至加密货币等任何品种都适用。决策由你拍板,执行的琐碎操作、风控纪律和持仓跟踪则交给面板。没有你的指令,什么都不会发生:这是一件实战工具,而不是全自动交易程序,也不是信号服务。 功能概览 每笔交易的手数都严格按设定的风险算出:可取账户余额的百分比
    TradePanel MT4
    Alfiya Fazylova
    4.84 (95)
    交易面板是一款多功能交易助手。该应用包含超过50种手动交易功能,并允许您自动执行大多数交易任务。 在购买之前,您可以在演示账户上测试演示版本。下载用于演示账户的试用版应用程序: https://www.mql5.com/zh/blogs/post/762579 。 完整说明 这里 。 贸易. 只需单击一下即可执行交易操作: 打開掛單和頭寸,並自動計算風險。 一鍵打開多個訂單和頭寸。 打開訂單網格。 按組別關閉掛單和頭寸。 反轉頭寸方向(關閉買入>打開賣出,關閉賣出>打開買入)。 鎖定頭寸(通過開啟缺少的頭寸,使買入和賣出頭寸的數量相等)。 一鍵部分關閉所有頭寸。 將所有頭寸的止盈和止損設置在同一價格水平。 將所有頭寸的止損設置在盈虧平衡水平。 開倉時,可使用以下功能: 在多個訂單或倉位之間分配計算出的數量(在單擊一次時開啟多個訂單和倉位)。 在開啟訂單前在圖表上可視化交易水平。 僅在當前點差不超過設定值時才開啟倉位。 止盈和止損之間的自動比例。 虛擬止損和止盈。 自動將止損和止盈的大小增加為當前點差的大小。 基於ATR指標讀數計算止盈和止損。 設置掛單的到期日期。 為掛單設置追蹤(掛單
    Trade Copier Global
    Laszlo Tormasi
    5 (15)
    Trade Copier Global: The name speaks for itself. This copier allows you to copy orders between MT4 terminals even if they are not installed on the same computer. Features Copying trades between MT4 terminals around the world with a short delay. Automatically recognizes symbol prefixes. Can connect many Slaves to the same Master. Supports pending and market orders. Supports partial order close (with limitations, see below) Can send messages and notifications to the Slaves from the Master Several
    达到目标利润时自动锁定利润 EquityTargetCloser   — 是一款 MetaTrader 5 实用工具型专家顾问,当   净值(Equity)超过当前余额达到指定的利润金额时 ,它会自动平掉所有市价单并删除挂单。平仓后目标自动提高:新门槛 = 新余额 + 指定利润。该 EA 不负责开仓,仅管理现有头寸,帮助可靠地锁定利润并保护积累的资金。 MT5-version:  https://www.mql5.com/en/market/product/169839 工作原理 该专家顾问持续将   净值(Equity)   与动态目标进行比较: 目标 =   当前余额(Balance) + plusMoney   (美元)。 当净值大于或等于该金额时,触发保护机制: 平掉   所有市价单   (任何品种)。 如果参数   Delete pending orders = true ,则删除   所有挂单 。 平仓后余额更新,目标重新计算:   新余额 + plusMoney 。这样,EA 在每个成功周期后逐步提高利润锁定门槛。 重要提示 :触发条件取决于   累计浮动利润 ,而不是
    跟单->方便快捷的界面交互,用户上手即用       ->>>> 推荐在windows电脑,或者VPS Windows上使用 特色功能: 多样化个性跟单设置: 1.对不同的信号源可以设置不同的手数模式 2.不同的信号源分别设置正向反向跟单 3.信号分别设置注释 4.是否根据合约手数校准手数 多样化个性跟单设置2: 1.对不同的品种可以设置不同的手数模式 2.不同的品种分别设置正向反向跟单 3.信号分别设置注释 4.是否根据合约手数校准手数 注释过滤,MAGIC过滤,信号手数过滤,本地品种过滤 净持仓模式(该模式下手数计算仅支持倍率) 工作时间设置 反向同步接收端的平仓 订单绑定功能:任意订单可以绑定到设置信号源订单上 (双击表格更改) 账户风险控制  基本功能: 跟单正常交互速度0.5s以下 自动检测信号源,并显示信号源账号列表 自动匹配品种,不同平台常用交易品种(后缀不同等特殊情况)95%自动匹配,基本无需手动设置,品种映射表可随意双击更改对应品种.(映射表具有快速搜索品种功能) 4种手数计算模式(1.倍率 2.固定手数 3.自适应资金风险 4.源账户资金比例风险) 特殊手数模式
    Auto Trade Copier
    Vu Trung Kien
    4.76 (85)
    自动交易复制器旨在以 100% 的准确度在多个 MT4/MT5 账户/终端之间复制交易。提供商和接收方账户必须位于同一台 PC/VPS 上。使用此工具,您可以将交易复制到同一台 PC/VPS 上的接收方账户。所有交易操作都将从提供商复制到接收方,不会有任何延迟。此版本仅适用于 MT4 账户。对于 MT5 账户,您必须使用 MT5 的自动交易复制器。参考: 参考: 对于 MT4 接收器,请下载“Trade Receiver Free” 这里 . 对于 MT5 接收器,请下载“Trade Receiver Free MT5”  这里 . 对于同一台 PC/VPS 上的 MT5 提供商,请检查“Auto Trade Copier MT5” 这里 . 如果您需要通过互联网在不同的 PC/VPS 上进行账户复制,请查看“Trade Copier Pro” 这里 . 如果您需要通过互联网在不同的 PC/VPS 账户之间进行复制,且接收方数量不限,请查看“无限交易复制器专业版” 这里 . 以下是重点功能 在 MT4 和 MT5 账户之间复制。 一个提供商可以将交易复制到多个接收者的账户。 一个提
    Telegram to MT4 Coppy
    Sergey Batudayev
    4.09 (11)
    Telegram 到 MT4: 终极信号复制解决方案 使用 Telegram 转 MT4 简化您的交易流程,这款先进的实用程序旨在将交易信号直接从 Telegram 频道和聊天复制到您的 MetaTrader 4 平台,无需 DLL 文件。这款强大的解决方案确保信号执行的无缝衔接,拥有无与伦比的精度和丰富的自定义选项,从而节省您的时间并提高您的效率。 [ Instructions and DEMO ] 主要特点 直接 Telegram API 集成 通过电话号码和安全码进行身份验证。 使用用户友好的 EXE 桥轻松获取和管理聊天 ID。 添加、删除和刷新多个频道/聊天以同时复制信号。 使用高级过滤器进行信号解析 跳过包含自定义例外词(例如“报告”、“摘要”)的不需要的信号。 支持灵活的 SL 和 TP 格式:价格、点数或点数。 当信号指定点而不是价格时自动计算入场点。 订单定制和灵活性 使用多种模式定制订单规模:固定手数、动态手数(% 风险)或特定符号手数。 使用信号数据或自定义参数调整 SL/TP。 配置滑点、挂单到期和重试设置以实现完美执行。 综合符号管理 排除特定符号或匹配自定义
    Custom Alerts AIO:多市场智能监控,一键启动,无需设置 概述 Custom Alerts AIO 是一款“开箱即用”的高级市场扫描工具,无需额外安装任何其他指标或进行复杂设置。它内置了 Stein Investments 的所有核心指标(FX Power、FX Volume、FX Dynamic、FX Levels 和 IX Power),可帮助您轻松监控所有主要资产类别,如外汇、黄金、指数和加密货币。如果您的经纪商支持股票,您也可以手动添加个股进行监控。 1. 为什么选择 Custom Alerts AIO? 无需额外购买任何指标 • 所有关键指标均已内置,开箱即用。 • 专注于实时预警,不包含任何图形元素,性能高效,界面简洁。 全面覆盖所有主要市场 • 支持监控外汇、金属、加密货币和指数市场。 • 无需手动输入任何交易品种,只需在设置中勾选资产类别即可启用。 • 股票并不属于默认类别,如有需要可手动通过参数输入添加。 高效、专业、便捷 • 无需图表模板和手动加载,适合自动化或远程交易环境。 • 非常适合 VPS 上长期运行,或作为后台市场预警工具使用。 2
    MACD Divergence Scanner is a multi-timeframe and multi-symbol dashboard and alert that checks all timeframes and symbols to find regular and hidden divergences between price chart and MACD indicator. This divergence scanner is integrated with support and resistance zones so you can check the MACD divergences in the most important areas of the chart to find trend reversals in the price chart. Download demo version   (works on M 1,M5,M30,W1   timeframes) Full description of scanner parameters ->  
    RSI Divergence Scanner is a multi-timeframe and multi-symbol dashboard and alert that checks all timeframes and symbols to find divergences between price chart and RSI indicator. This divergence scanner is integrated with support and resistance zones so you can check the RSI divergences in the most important areas of the chart to find trend reversals in the price chart. Download demo version   (works on M 1,M5,M30,W1 timeframes) Full description of scanner parameters ->   click here . How to get
    The News Filter
    Leolouiski Gan
    5 (25)
    这个产品在新闻时间过滤所有的专家顾问和手动图表,因此您不必担心突然的价格波动会破坏您的手动交易设置或其他专家顾问输入的交易。此产品还带有完整的订单管理系统,可在任何新闻发布前处理您的持仓和挂单。一旦您购买了 The News Filter ,您将不再需要依赖以后的专家顾问内置的新闻过滤器,因为这个产品可以从此过滤它们所有。 新闻选择 新闻来源于Forex Factory的经济日历。 选择可以基于任何一种货币,如USD,EUR,GBP,JPY,AUD,CAD,CHF,NZD和CNY等。 选择也可以基于关键识别,例如Non-Farm (NFP),FOMC,CPI等。 能够选择新闻影响级别的筛选,从低、中、到高影响。 自动模式只选择与图表相关的新闻。 新闻来源每小时自动刷新,以确保最新的新闻数据。 为每个新闻影响级别提供单独的输入,以确定您要过滤掉的新闻发布前后的分钟数。 订单管理选项 在新闻发布前关闭未平仓头寸的选项,并在新闻发布后恢复它们。 在新闻发布前删除挂单的选项,并在新闻发布后恢复它们。 在新闻发布前移除止损和止盈水平的选项,并在新闻发布后恢复它们。 在新闻发布前移动止损和止盈
    Unlimited Trade Copier Pro is a tool to copy trade remotely to multiple MT4, MT5 and cTrader accounts at different computers/locations over internet. This is an ideal solution for you if you are a signal provider and want to copy your trades to other receivers globally on your own rules. One provider can copy trades to multiple receivers and one receiver can get trade from multiple providers as well. The provider can even set the subscription expiry for each receiver, so that receiver will not b
    Trade Manager MT4 DaneTrades
    Levi Dane Benjamin
    4.09 (11)
    交易管理器可帮助您快速进入和退出交易,同时自动计算风险。 包括帮助您防止过度交易、报复性交易和情绪化交易的功能。 交易可以自动管理,账户绩效指标可以在图表中可视化。 这些功能使该面板成为所有手动交易者的理想选择,并有助于增强 MetaTrader 4 平台。多语言支持。 MT5版本  |  用户指南+演示 交易经理在策略测试器中不起作用。 如需演示,请参阅用户指南 风险管理 根据%或$自动调整风险 可选择使用固定手数或根据交易量和点自动计算手数 使用 RR、点数或价格设置盈亏平衡止损 追踪止损设置 最大每日损失百分比,在达到目标时自动平仓所有交易。 保护账户免遭过多提款并阻止您过度交易 最大每日损失(以美元为单位)在达到目标时自动关闭所有交易。 保护账户免遭过多提款并阻止您过度交易 一键实现所有交易的盈亏平衡 自动计算从手机/电话发送的交易的风险 OCO 在设置中可用 交易和头寸管理 通过设置每月、每周、每天、每小时或每分钟的最大交易次数,停止过度交易和报复性交易。 高级挂单管理。 调整何时关闭挂单的规则 追踪挂单 支持市价订单和挂单 每日最大利润目标(以美元为单位)以确保头寸并停止
    VirtualTradePad PRO SE MT4 — MetaTrader 4 高级交易面板和图表工作区 VirtualTradePad PRO SE 是一款适用于 MetaTrader 4 的专业交易面板和交易管理工作区。它帮助交易者通过一个基于图表的界面,更快速地开仓、管理、保护、平仓和分析交易。 该产品专为需要的不只是简单按钮集合的活跃手动交易者而创建。PRO SE 将一键执行、挂单、持仓控制、部分平仓、篮子利润/亏损逻辑、加仓均价层级、ATM 规则、信号监控、市场信息、策略测试器流程和面向 VPS 的准备整合到一个结构化工作区中。 MT5 版本 | 完整说明和截图 | 如何购买 | 如何安装 | 如何获取日志文件 | 如何测试与优化 | Expforex 的所有产品 为什么交易者会选择这套面板 图表一键交易 ,并支持键盘快速操作 快速完成开仓、平仓、修改、反转、锁仓与部分平仓 深度控制仓位、挂单、总利润与风控逻辑 自动参数计算,减少手动输入与重复劳动 相对于普通手动交易的优势 一个工作区替代多个窗口 — 交易执行、持仓控制、风险信息和管理工具都保留在图表上。 更快处理交易
    神速EA跟单(TradeMirror)是一款MT4/MT5平台的订单复制软件。 使用教程 请点击 神速EA跟单使用教程 链接以查看更多使用教程 为什么选择神速EA跟单 我们深知对于金融软件而言安全、稳定和隐私的重要性,因此我们在细节处对这三大要素进行了额外的加固: 提供用户友好的图形界面,操作简单易用 注重隐私安全,适合对订单分发有隐私要求各种金融场景 精准复制订单,毫秒级分发 支持全平台,MT4/MT5全面覆盖 智能感知系统状态,邮件通知守护交易安全 核心功能列表 对于跟单软件而言,功能并不是越多越好的,因此经过严谨的需求分析,我们对程序进行了精简,并最终保留了如下核心功能: 多重连接 邮件通知 手数缩放 信号过滤 反向跟单 重置止盈/止损 免费演示 在购买Trademirror之前,你总是可以尝试免费演示。 点击本页面上的免费演示按钮 点击是的,我有Metatrader 4/5 允许浏览器打开Mt4/5 在Mt4/5中,找到专家顾问/市场/TradeMirror,打开它并点击测试 启用复盘显示(否则你将看不到GUI界面)。 点击开始 现在你可以在可视化图表上看到TradeMirro
    使用我们先进的 Telegram Bridge EA 提升您的交易信号 是时候用专业且视觉吸引人的实时交易更新来吸引您的受众了。 联系我获取试用版并查看演示频道! 我们在用户友好的功能上进行了大量投资,为客户和提供商创造了独特的体验。  SIGNAL BRIDGE 能够为所有业务场景提供 100% 跟单友好信号,甚至可以绕过其他 EA 无法处理的 Metatrader 逻辑! 我们的 Telegram Bridge EA 自动将信号、图表快照和详细的绩效报告直接发送到您的 Telegram 群组——无需您动手。 查看 功能输入详细说明手册! 主要功能和优势  全面的交易数据 决定每条消息中显示的内容:从点数、入场价、止损、止盈、手数,甚至风险和盈亏比。为您的关注者提供完全透明度。 发送新订单、更新止损/止盈、从设置中自定义盈亏平衡,发送 100% 跟单友好的部分平仓  超精美图表附件功能 包含每笔交易的截图,显示您的入场点、止损/止盈和整体市场背景。完美构建每次更新的信任度和清晰度。 选择图表模板、自定义交易颜色、决定缩放级别  决定附加位置:所有交易、仅挂单、仅市价单、部分平
    EasyTrade MT4
    Alain Verleyen
    5 (1)
    Easy Trade – 智能、简洁且强大的交易管理工具 Easy Trade 是为 MetaTrader 用户打造的一体化交易管理解决方案,帮助您轻松掌控风险,实现流畅交易执行。 它是根据交易者的反馈从零开始开发的,简化了多品种交易的执行、监控和管理流程,无需繁琐的操作。 无论您是手动短线交易者,还是管理多个交易设置的小型投资组合,Easy Trade 都能让您专注于明智决策和稳定盈利。 ⸻ 为什么选择 Easy Trade? 精准风险管理:可选择固定手数或按百分比定义每笔交易的风险。实时显示风险与潜在收益。 篮子式跟踪止盈:追踪多笔交易的总利润,目标达成时自动锁定部分收益,适用于组合交易。 交易截图记录:每笔交易都可截图保存,方便日记记录、回顾与绩效分析。 定时自动平仓:可设定具体日期和时间自动关闭持仓,适合日终或周末前平仓。 界面可自定义:可调整按钮排序与大小、线条样式与颜色、缩放比例等,满足个人使用习惯。 ⸻ 主要功能(版本 1.0) 魔术号与策略标签: 使用注释标记轻松区分不同策略的交易,便于统计与复盘。 手数设置: 支持固定手数或基于止损与账户资金百分比的动态手
    Close by percentage MT4
    Konstantin Kulikov
    5 (1)
    Hello friends. I wrote this utility specifically for use in my profile with a large number of Expert Advisors and sets ("Joint_profiles_from_grid_sets" https://www.mql5.com/en/blogs/post/747929 ). Now, in order to limit losses on the account, there is no need to change the "Close_positions_at_percentage_of_loss" parameter on each chart. Just open one additional chart, attach this utility and set the desired percentage for closing all trades on the account. The utility has the following function
    Smart Channel M4
    Vahidreza Heidar Gholami
    The trend in the market can be predicted using trend lines but the problem is you don’t know where exactly the price is going to touch the trend line where you can put your pending orders on. Smart Channel Expert Advisor makes it possible to put an advanced channel around the price data, which can be configured to handle placing orders, opening and closing positions, managing risk per trade, spread, slippage, and trailing stop-loss and take-profit automatically. Features Money Management (Calcul
    Local Trade Copier EA 是针对需要从外部来源执行交易信号或需要同时管理多个账户的个人交易者或账户经理的解决方案,无需 MAM 或 PAMM 账户。它可以从多达 8 个主帐户复制到无限的从帐户 [ 安装指南 | 更新指南 | 故障排除 | 常见问题 | 所有产品 ] 100% 自托管 容易安装和使用 不使用安装程序、配置文件、服务器、内存管道或 DLL 1000 次激活可永久使用 EA 本地执行,无网络延迟 它实现了您需要的所有功能: 最多8个主账户和无限从属账户 适用于所有经纪人和 DD/NDD/ECN/STP 执行 适用于具有不同帐户货币的帐户 在真实账户和模拟账户之间工作不明显 支持主从账户中的符号名称后缀 按幻数和订单评论过滤 不会干扰其他交易 可选择复制 SL 和 TP 水平 可选择复制挂单 支持符号翻译 支持部分关闭 反向模式 灵活的交易规模: - 固定地段 - 乘数 - 成比例的 - 与乘数成比例 EA 可以使用投资者或任何账户的主密码复制交易。 如何将交易从一个主账户复制到一个或多个从账户 在源终端中安装 EA 将 EA 加载到任何图表并选择“MA
    作者的更多信息
    Running along Lines MT5
    Pavel Verveyko
    5 (1)
    The indicator draws support and resistance lines on an important part of the chart for making decisions. After the trend line appears, you can trade for a breakout or rebound from it, as well as place orders near it. Outdated trend lines are deleted automatically. Thus, we always deal with the most up-to-date lines. The indicator is not redrawn . Settings: Size_History  - the size of the calculated history. Num_Candles_extremum  - the number of candles on each side of the extremum. Type_Arrow
    Ichimoku Map MT5
    Pavel Verveyko
    Ichimoku Map (instant look at the markets) - built on the basis of the legendary Ichimoku Kinko Hyo indicator. The task of the Ichimoku Map is to provide information about the market strength on the selected time periods and instruments, from the point of view of the Ichimoku indicator. The indicator displays 7 degrees of buy signal strength and 7 degrees of sell signal strength. The stronger the trend, the brighter the signal rectangle in the table. The table can be dragged with the mouse. The
    Turn
    Pavel Verveyko
    The indicator shows the market turning points (entry points). Reversals allow you to track rebound/breakout/testing from the reverse side of the lines of graphical analysis or indicators. Reversals can be an independent signal. The indicator allows you to determine reversals taking into account the trend and without it. You can choose a different period for the movement preceding the reversal, as well as the volatility coefficient. When plotting reversals, the indicator takes into account volati
    Length Movement
    Pavel Verveyko
    5 (1)
    Measures the length of the selected movement in points, shows the duration of the movement, as well as the speed of movement.   Outputs the average value of each dimension. It is designed to calculate the expected target based on typical market movements. The intended goal will provide information about the ratio of the stop size to the possible profit and will allow you not to open positions with a small expected profit. It will also help you determine the point at which it is more logical to c
    Ratio TP SL
    Pavel Verveyko
    5 (1)
    This indicator allows you to measure the profitability of each specific transaction (the ratio of Stop and Profit). The indicator allows you to adjust the ratio by step size and number of steps. You can build an unlimited number of ratios to compare the risks from different movements. Note: in MT4, the number of horizontal lines in a single ratio cannot exceed 32. Building a line : click the " Ratio " button and draw a line (mouse click - the first point of the line, where the mouse is release
    Corporate Report
    Pavel Verveyko
    5 (1)
    The script displays info about the share's corporate reports and dividends. The data is downloaded from   investing.com : Report date Profit per share (EPS) Revenue Market capitalization Amount of dividends Date of payment of dividends Dividend income The product cannot be tested in the tester (since it is not possible to receive data from the Internet). Before launching:  Add 2   URL   https://ru.investing.com/earnings-calendar/Service/getCalendarFilteredData  and   https://ru.investing.com/di
    Channel FTF
    Pavel Verveyko
    The Envelopes indicator determines the presence of a trend or flat. It has 3 types of signals, shows the probable retracement levels and levels of the possible targets. The Fibonacci coefficients are used in the indicator's calculations. Signals (generated when touching the lines or rebounding from lines): Trend - the middle line of the Envelopes has a distinct inclination; the lines below the channel's middle line are used for buy trades, the lines above the middle line and the middle line itse
    Mr Big
    Pavel Verveyko
    The indicator shows and highlights the chart candles, which are formed as a result of large players entering the market in large volumes. Such candles can also be formed after achieving a certainty on the market, when most of the participants hold positions in the same direction. The movement is likely to continue in that direction after such candles. The indicator highlights the significant candles from the existing ones on the chart; The indicator allows identifying the trends based on candles
    Splash
    Pavel Verveyko
    The indicator identifies the most suitable moment for entering the market in terms of market volatility, when the market has the strength to move (the signal is indicated by an arrow under the candle). For each of the signals, the presence of trends on the current and higher timeframes is determined, so that the signal is in the direction of the majority of positions opened on the market (denoted near the signal by abbreviations of timeframes with a trend present). The signal appears after the c
    The indicator displays the key support and resistance levels on the chart. The significance of these levels lies in that the price may reverse or strengthen the movement when passing such levels, since they are formed as a consequence of the natural reaction of market participants to the price movement, depending on which positions they occupied or did not have time to occupy. The psychology of the level occurrence: there always those who bought, sold, hesitated to enter or exited early. If the
    This indicator is a multitimeframe trading strategy. It has the levels for stop loss, take profit and entry point. The order level can also be set manually. The indicator uses the regularity of the market, which manifests itself on all instruments, and does not require adjustment of the parameters. The strategy uses a proprietary approach to determining: trend, volatility, hierarchy of timeframe significance, the size of the history period (the number of candles), which is important for making a
    Trend Sync
    Pavel Verveyko
    5 (1)
    The indicator shows the trend of 3 timeframes: higher timeframe; medium timeframe; smaller (current) timeframe, where the indicator is running. The indicator should be launched on a chart with a timeframe smaller than the higher and medium ones. The idea is to use the trend strength when opening positions. Combination of 3 timeframes (smaller, medium, higher) allows the trend to be followed at all levels of the instrument. The higher timeframes are used for calculations. Therefore, sudden change
    The indicator detects important peaks and troughs (extremes) on the chart. These points can be used to plot support/resistance levels and trend lines, as well as any other graphical analysis. These points can serve as reference points for setting trading orders. The indicator does not redraw . Settings: Size_History  - the size of the calculated history. Num_Candles_Right  - number of candles to the right of the peak or trough. Num_Candles_Left  - number of candles to the left of the peak or
    Running along Lines
    Pavel Verveyko
    3 (2)
    The indicator draws support and resistance lines on an important part of the chart for making decisions. After the trend line appears, you can trade for a breakout or rebound from it, as well as place orders near it. Outdated trend lines are deleted automatically. Thus, we always deal with the most up-to-date lines. The indicator is not redrawn . Settings: Size_History  - the size of the calculated history. Num_Candles_extremum  - the number of candles on each side of the extremum. Type_Arrow
    Key Volumes
    Pavel Verveyko
    1 (1)
    The indicator shows key volumes confirmed by the price movement. The indicator allows you to analyze volumes in the direction, frequency of occurrence, and their value. There are 2 modes of operation: taking into account the trend and not taking into account the trend (if the parameter Period_Trend = 0, then the trend is not taken into account; if the parameter Period_Trend is greater than zero, then the trend is taken into account in volumes). The indicator does not redraw . Settings History_S
    Catch Impulse
    Pavel Verveyko
    This trading system is based on market impulses of varying complexity.   To generate a signal, the indicator uses the moments when the direction of the pulse and the necessary section of the trend coincide. The indicator also takes into account the current market volatility. Stop_loss tags can be set with the parameter "0" or "1", then Stop_Loss will take into account market volatility.   Take_Profit tags can be set with the parameter "0", then Take_Profit will take into account market volatil
    Indexes
    Pavel Verveyko
    The stocks that make up the index are one of the drivers of the movement. Analyzing the financial performance of all elements of the index, we can assume further development of the situation. The program (script) displays corporate reports of shares that are part of the index selected in the settings.   "Indexes" cannot be tested in the tester (since there is no way to get information from the Internet). Information is downloaded from the site investing.com: Report Date Earnings per share (E
    Fibo World
    Pavel Verveyko
    The indicator builds a graphical analysis based on the Fibonacci theory. Fibo Fan is used for the analysis of the impulses and corrections of the movement. Reversal lines (2 lines at the base of the Fibonacci fan) are used to analyze the direction of movements. The indicator displays the of 4 the target line in each direction. The indicator takes into account market volatility. If the price is above the reversal lines, it makes sense to consider buying, if lower, then selling. You can open posi
    The indicator determines the state of the market: trend or flat. The state of the market is determined by taking into account volatility. The flat (trading corridor)is displayed in yellow. The green color shows the upward trend. The red color shows the downward trend. The height of the label corresponds to the volatility in the market. The indicator does not redraw . Settings History_Size   - the amount of history for calculation. Period_Candles  - the number of candles to calculate the indicat
    The indicator plots flexible support and resistance levels (dots). A special phase of movement is used for construction. Levels are formed dynamically, that is, each new candle can continue the level or complete it. The level can provide resistance or support to the price even where it is no longer there. Also, support and resistance levels can change roles. The importance of levels is affected by: the amount of time the level is formed and the number of touches. The significance of these lev
    The indicator is a trading system for short-term trading. Scalper Assistant helps to determine the direction of the transaction, and also shows the entry and exit points. The indicator draws two lines (possible points for opening positions). At the moment of the breakdown of the upper line up (and when all trading conditions are met), an up arrow appears (a buy signal), as well as 2 goals. At the moment of the breakdown of the lower line down (and when all trading conditions are met), a down ar
    Gold n XAU
    Pavel Verveyko
    The trading system is designed to work with gold on time periods: 30M, 1H. The indicator allows you to adjust to the market situation. Parameters for 1H :   PERIOD=9F ,   FILTER=300 .   Parameters for  30M :   PERIOD=22B ,   FILTER=450 .   A small adjustment to a specific broker is allowed .   If you change the amount of history displayed, you may also need to adjust the parameters. The indicator is not redrawn.     "Gold n XAU" uses different rules for entering a trade and different rules fo
    The indicator builds "psychological levels": levels of round numbers and intermediate levels of round numbers. Round numbers play an important role in forming support and resistance levels. There is a pattern in which the decline or growth of the price can stop at round numbers. The level whose price ends at 0 is the level of a round number of the first order. Intermediate level, this is the level between two round levels, for example, between 10 and 20 this is level 15. In the " Num_Zeros "
    Ichimoku Map
    Pavel Verveyko
    Ichimoku Map (instant look at the markets) - built on the basis of the legendary Ichimoku Kinko Hyo indicator. The task of the Ichimoku Map is to provide information about the market strength on the selected time periods and instruments, from the point of view of the Ichimoku indicator. The indicator displays 7 degrees of buy signal strength and 7 degrees of sell signal strength. The stronger the trend, the brighter the signal rectangle in the table. The table can be dragged with the mouse. The
    The indicator displays a stock chart of a non-standard type, in which the price and time have the same value. The usual chart of Japanese candlesticks does not take into account all the information that the time analysis can give. Renko charts do not use all the information that price can give in relation to time. The "Chart Price and Time" indicator takes into account price and time equally and shows the predominance of price or time. Taking into account price and time equally gives an idea
    The indicator tracks sharp volatility (moments when the market has shown increased activity and movement may occur), on the selected instruments and time periods. The information is displayed as colored rectangles. Thus, it is possible to assess at a glance which tool should be given priority attention. The indicator will be useful for scalpers when they need a quick reaction or for traders working with a large number of instruments. The indicator does not redraw. The indicator displays 8 degree
    Alert Creator
    Pavel Verveyko
    The Alert Creator indicator is designed to create alerts for selected conditions. You can select one or several indicators for the notification. If several conditions are selected, the alert is triggered when all the selected conditions are met. The signals can be configured separately for buying and separately for selling. Example, a buy alert: the closing price is above the moving average, the RSI is below 20. (In this example, 2 indicators are used to generate an alert: MA and RSI) At the
    Trend Arithmetic
    Pavel Verveyko
    The indicator determines the strength of the trend and its possible reversal points, based on the author's arithmetic approach . Each new peak or trough is a trend development. Such peaks and troughs are numbered so that the strength of the trend development can be seen. Attempts to change the trend are also numbered. This gives an understanding of a possible change in the direction of the trend. Indicator signals are generated when trying to change the trend . In the settings, it is possible
    Level Predictor
    Pavel Verveyko
    该指标绘制可能成为未来显着支撑位和阻力位的潜在水平。 该线越长,在该水平击穿后价格反转或价格变动增加的可能性就越高。 随着电平形成概率的降低,线的长度减小。 该指标不需要调整。 在设置中,您可以更改指示器的设计。 " Line_Length "按钮放置在图表上以调整线的长度(为了便于感知指标)。 所选的" Line_Length "设置将为每个时间段和仪器保存。 " Line_Length "按钮可以用鼠标拖动。 当悬停在按钮的左边缘时,它会用选定的颜色突出显示,按下时,数字会减少,指示线会缩短。 当您将鼠标悬停在按钮的右边缘时,它会以选定的颜色突出显示,按下时,数字会增加,指示线会延长。 _________________
    Jumping along Levels is dedicated to the most important aspect of trading: support and resistance levels. This indicator is built using a unique technology based on proprietary development and testing algorithms. The indicator has a built-in intelligent market situation assessment system. It can automatically adjust to varying market volatility. Jumping along Levels simultaneously displays levels from different time periods on the current chart. It has a graphical table for working with comple
    筛选:
    hkarram
    288
    hkarram 2021.12.05 15:56 
     

    用户没有留下任何评级信息

    mambobody
    462
    mambobody 2019.07.21 22:41 
     

    用户没有留下任何评级信息

    回复评论