
Smart Chandelier Exit
- Göstergeler
- Sürüm: 1.4
- Güncellendi: 13 Ağustos 2026

SMART CHANDELIER EXIT
=====================
OVERVIEW
--------
Smart Chandelier Exit is an adaptive trailing-stop and trend-direction indicator.
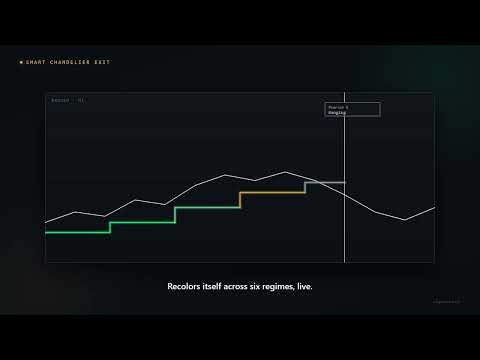
It plots a single stop line that follows price: green below price in an uptrend,
red above price in a downtrend. The line only ever ratchets in the trend's favor,
never against it, so it doubles as a mechanical stop-loss and a trend-state signal.
What makes it "smart" is the built-in Pearson R trend-quality filter. A raw stop
line tells you WHERE the stop is; the Pearson R engine tells you HOW GOOD the
current trend actually is (strong, moderate, weak, or just ranging noise). Both
are shown together on a compact on-chart panel, along with rolling statistics that
separate genuine trend flips from short-lived "fake" flips.
The indicator is non-repainting: the stop line is computed on closed bars with a
one-directional ratchet, alerts fire only on a closed bar, and flip arrows are
confirmed after a fixed number of bars (so an arrow never appears and then
disappears). What you see in history is what you would have seen live.
WHAT YOU SEE ON THE CHART
-------------------------
1. STOP LINE (the main plot)
- Green line ("CE Long SL"): the trailing stop while the trend is UP. It sits
below price and can only move up.
- Red line ("CE Short SL"): the trailing stop while the trend is DOWN. It sits
above price and can only move down.
- Only one of the two is visible at any time. A flip from one to the other marks
a change of trend direction.
2. FLIP ARROWS (optional, InpShowFlips)
- Green up-arrow below the bar: confirmed flip to bullish.
- Red down-arrow above the bar: confirmed flip to bearish.
- Arrows are drawn only AFTER the flip has survived InpFakeFlipBars bars. This
is a deliberate confirmation delay: it filters out flips that instantly
reverse, and it guarantees the arrow is non-repainting.
3. INFO PANEL (optional, InpShowPanel) - top-right corner
THE PANEL, LINE BY LINE
-----------------------
Line 1 (title): Smart CE - SYMBOL - TIMEFRAME
Just identifies the instrument and timeframe the panel refers to.
Line 2 (direction): BULLISH / BEARISH / ----
The current trend state as defined by the stop line. BULLISH = green Long stop
is active; BEARISH = red Short stop is active.
Line 3 (stop distance): SL <distance><unit> <x>R
How far the active stop is from the current price.
- <distance><unit>: distance in pips or points (see Distance Unit below).
- <x>R: the SAME distance expressed in ATR units. For example "0.96R" means the
stop is 0.96 ATR away from price. IMPORTANT: this "R" means ATR-multiples of
distance. It is NOT the Pearson R on the next line. Two different R's:
* "0.96R" on this line = stop distance measured in ATRs.
* "R +0.830" below = Pearson correlation coefficient.
Line 4 (trend quality): R <value> <arrow> <regime>
- R <value>: the Pearson correlation coefficient between price and time over the
last InpRPeriod bars. Range -1 to +1.
* near +1 = clean straight-line uptrend
* near -1 = clean straight-line downtrend
* near 0 = no linear trend (choppy / ranging)
- <arrow>: the direction R is moving (momentum of trend quality), comparing now
to 3 bars ago:
* up-up = rising fast up = rising
* right = flat
* down = falling down-down = falling fast
- <regime>: a plain-language label derived from |R| and the threshold inputs:
* Strong UP / Strong DOWN when |R| >= InpRStrongLevel (default 0.7)
* Moderate up / Moderate down when |R| >= InpRModerateLevel (default 0.5)
* Weak when |R| >= 0.3
* RANGING when |R| < 0.3
The line is also colored by regime (green shades up, red shades down, gray
when ranging).
Line 5 (flip statistics): F|R| <value> RL|R| <value>
Rolling statistics over the last 50 flips:
- F|R| = the average |Pearson R| recorded at FAKE flips (flips that reversed
within InpFakeFlipBars bars).
- RL|R| = the average |Pearson R| recorded at REAL flips (flips that lasted).
These two averages summarize the trend-quality context in which recent fake and
real flips occurred, letting you gauge how much confidence to place in a new flip
on the current instrument and timeframe.
INPUT PARAMETERS
----------------
=== CE Parameters ===
InpATRPeriod (default 22) ATR period used to size the stop distance.
InpLookback (default 22) Number of bars used for the highest-high / lowest-low
that the stop is measured from.
InpMultiplier (default 3.0) ATR multiplier. Larger = wider stop, fewer flips.
=== Pearson R (Trend Quality) ===
InpRPeriod (default 22) Lookback for the price-vs-time correlation.
InpRStrongLevel (default 0.7) |R| at/above this = "Strong" regime.
InpRModerateLevel (default 0.5) |R| at/above this = "Moderate" regime.
=== Fake Flip Detection ===
InpFakeFlipBars (default 5) A flip that reverses within this many bars is tagged
FAKE. Also the confirmation delay for drawing arrows.
=== Visual ===
InpShowPanel (default true) Show/hide the info panel.
InpShowFlips (default true) Show/hide the confirmed flip arrows.
InpPanelColor (default White) Default text color of the panel.
InpFontSize (default 10) Panel font size.
InpCornerX (default 10) Panel horizontal offset from the right edge (pixels).
InpCornerY (default 20) Panel vertical offset from the top edge (pixels).
=== Distance Unit ===
InpUnitMode (default AUTO) How the stop distance on panel line 3 is expressed:
AUTO = pips for Forex, points otherwise (chosen
automatically from the symbol type)
PIP = force pips
POINT = force points
=== Alert ===
InpAlertOnFlip (default false) Pop-up alert on a confirmed direction flip (closed bar).
InpPushOnFlip (default false) Push notification to the MetaTrader mobile app on flip
(requires a MetaQuotes ID configured in the terminal).
HOW THE DIRECTION AND STOP ARE COMPUTED
---------------------------------------
- Long stop = highest-high(Lookback) - ATR * Multiplier
- Short stop = lowest-low(Lookback) + ATR * Multiplier
- The active long stop only moves up; the active short stop only moves down (ratchet).
- Direction flips to UP when the close crosses above the short stop, and to DOWN
when the close crosses below the long stop. Only the stop for the current
direction is plotted; the other is hidden.
SUGGESTED USE
-------------
- Trend direction / bias: trade in the direction of the active stop line.
- Trailing stop: use the plotted line as a mechanical stop that never loosens.
- Quality filter: prefer signals when the regime is Strong or Moderate in the trade
direction, and be cautious (or stand aside) when the panel reads RANGING.
- Flip trust: use the F|R| vs RL|R| gauge and the R momentum arrow to judge whether
a fresh flip is likely genuine or a counter-trend trap.
Works on any symbol and timeframe. Default parameters (22/22/3.0) are a classic
starting point; tune the ATR multiplier and lookback to the volatility of your
instrument and timeframe.
This is an indicator for analysis and decision support. It does not place trades.
Always test thoroughly before using any tool in live trading. Trading involves risk.










































Really liking this MT5 indicator so far. It’s clean, easy to read, and gives a lot of useful information without making the chart too cluttered. The trend direction, fake flips, ATR, and execution levels are especially helpful. The recent panel positioning fix is also a nice improvement. Overall, a really solid indicator!