Smart Chandelier Exit

5

Smart Chandelier Exit

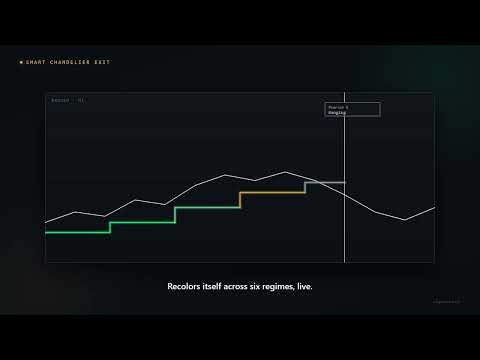
Smart Chandelier Exit is an adaptive trailing-stop and trend-direction indicator. It plots a neon-glow stop line that follows price: emerald-green below price in an uptrend, crimson-red above price in a downtrend. The line only ever ratchets in the trend's favor, never against it, so it doubles as a mechanical stop-loss and a trend-state signal.

What makes it "smart" is the built-in Pearson R trend-quality filter. A raw stop line tells you WHERE the stop is; the Pearson R engine tells you HOW GOOD the current trend actually is (strong, moderate, weak, or just ranging noise). Both are shown together on a compact on-chart panel, along with rolling statistics that separate genuine trend flips from short-lived "fake" flips.

The indicator is non-repainting: the stop line is computed on closed bars with a one-directional ratchet, alerts fire only on a closed bar, and flip arrows are confirmed after a fixed number of bars (so an arrow never appears and then disappears). What you see in history is what you would have seen live.

What you see on the chart

1. Neon glow stop lines
The active stop direction is rendered as three stacked lines for a premium neon-glow look:

  • Outer glow (width 5, very faint) — background halo
  • Inner glow (width 3, medium) — mid corona
  • Core line (width 1, bright) — the precise stop level

Color shifts automatically with the Pearson R regime:

  • Bright Emerald — Strong UP
  • Soft Green — Moderate UP
  • Amber — Weak trend
  • Cool Gray — Ranging / no trend
  • Soft Red — Moderate DOWN
  • Bright Crimson — Strong DOWN

Only the active direction's glow is shown. The passive side (inactive stop) is completely hidden so the chart stays clean.

2. Fill band (shadow zone)
A subtle shaded band approximately 0.4 × ATR wide hugs the active stop line: dark green shadow below the bullish stop line, dark red shadow above the bearish stop line. This gives an instant visual depth cue showing where the "danger zone" is relative to the current price.

3. Flip arrows (optional, InpShowFlips)

  • Green up-arrow below the bar: confirmed flip to bullish.
  • Red down-arrow above the bar: confirmed flip to bearish.
  • Arrows are drawn only after the flip has maintained its direction continuously for InpFakeFlipBars bars. This confirmation delay filters out flips that reverse intra-window, guaranteeing the arrow is non-repainting.
  • Arrow width encodes trend quality at the moment of the flip: 3px when |R| ≥ Strong level, 2px when |R| ≥ Moderate level, 1px otherwise. A small R-value label is printed next to each arrow.
  • Important: there is no Pearson R threshold for whether an arrow appears — every flip that survives the confirmation window gets an arrow, even during a ranging regime. Width and the R label are the only cues to flip quality.
  • Only the most recent InpMaxArrows arrows are kept on the chart to avoid chart-object bloat. Set InpMaxArrows to 0 to keep every arrow.

4. Info panel (optional, InpShowPanel)
A compact on-chart dashboard placed in the corner selected by InpPanelCorner, offset by InpCornerX / InpCornerY pixels, with a pulsing LIVE badge and three sections: SETUP, EXECUTION, INSIGHTS.

The panel, row by row

SETUP — Pearson R (−1.0 to +1.0) with a 10-segment strength bar, a plain-language Regime label (Strong / Moderate / Weak / Ranging, Up or Down), and the ATR period / multiplier the stop was drawn with.

EXECUTION — Direction, the exact active Stop Level price, and Distance to that stop in your chosen unit plus ATR risk units ("R"). On short trades the spread is added to the price first, because the close is the Bid while a short stop is triggered on the Ask.

Two different "R" readings on this panel: the "R" inside Distance is the stop distance measured in ATR units (risk); the "Pearson R" row is the trend-quality correlation coefficient. They are unrelated.

INSIGHTS — Fake Flips is the share of the last 50 flips that reversed within the confirmation window (LOW < 20%, MED 20–40%, HIGH > 40%), shown with a risk-thermometer bar. Bars Since counts how long the current direction has been active.

How direction and the stop are computed

  • Long stop = Highest High (Lookback) − ATR × Multiplier
  • Short stop = Lowest Low (Lookback) + ATR × Multiplier
  • The active long stop only moves up; the active short stop only moves down (one-directional ratchet).
  • Direction flips to UP when the close crosses above the short stop, and to DOWN when the close crosses below the long stop. Only the stop for the current direction is plotted.

Automated trading (EA integration)

The indicator exposes two hidden data buffers for EA developers to read via iCustom:

  • Buffer 10 (CE Direction): 1 for Bullish (Long SL active), −1 for Bearish (Short SL active).
  • Buffer 11 (CE Pearson R): the exact Pearson R correlation value (−1.0 to +1.0).

An EA can trade on direction flips while filtering out weak signals where |R| is low.

Input parameters

Group Parameter Default Description
CE Parameters ATR Period 22 ATR period used to size the stop distance
Lookback 22 Bars used for the highest-high / lowest-low the stop is measured from
ATR Multiplier 3.0 Larger = wider stop, fewer flips
Pearson R (Trend Quality) R Period 22 Lookback for the price-vs-time correlation
Strong Level 0.7 |R| at/above this = "Strong" regime
Moderate Level 0.5 |R| at/above this = "Moderate" regime (Weak floor is fixed at 0.3)

Fake Flip Detection Fake Flip Bars 5 A flip reversing within this many bars is tagged FAKE; also the arrow confirmation delay
Performance & Limits Max Bars 5000 Max bars processed on calculation (0 = all history)
Max Arrows 100 Max flip arrows kept on chart (0 = all)
Visual Show Panel true Show/hide the info panel
Show Flips true Show/hide confirmed flip arrows
Panel Corner Top Left Panel corner position
Panel Theme Dark Obsidian Dark Obsidian / Cyberpunk Neon / Midnight Blue
Corner X / Y 20 / 20 Panel offset from the selected corner (px)
Distance Unit Auto Auto = pips for Forex, raw price difference for indices/crypto/shares
Alerts Alert On Flip false Pop-up alert on a confirmed direction flip
Push On Flip false Mobile push notification (requires a MetaQuotes ID configured in the terminal)
Mail On Flip false Email alert on a confirmed direction flip

Suggested use

  • Trend direction / bias: trade in the direction of the active glow line.
  • Regime quality: prefer signals when the panel reads Strong or Moderate in the trade direction.
  • Trailing stop: use the core stop line as a mechanical stop that never loosens.
  • Flip trust: read the Fake Flips thermometer together with the Regime row before acting on a fresh arrow.

Works on any symbol and timeframe. Default parameters (22/22/3.0) are a classic starting point; tune the ATR multiplier and lookback to the volatility of your instrument and timeframe.

This is an indicator for analysis and decision support. It does not place trades. Trading involves risk.


Avis 2
lisi 7887
1770
lisi 7887 2026.07.31 15:28 
 

Fire!!!

Produits recommandés
Rainbow MT5
Jamal El Alama
4 (1)
Description : Rainbow MT5 is a technical indicator based on Moving Average with period 34 and very easy to use. When price crosses above MA and MA changes color to green, then this is a signal to buy. When price crosses below MA and MA changes color to red, then this is a signal to sell. The Expert advisor ( Rainbow EA MT5 ) based on Rainbow MT5 indicator is now available here . MT4 version is available here .
FREE
Basic Vwap
james mugendi
4 (1)
Simple Vwap with the daily, weekly and monthly VWAP is the abbreviation for   volume-weighted average price , which is a technical analysis tool that shows the ratio of an asset's price to its total trade volume. It provides traders and investors with a measure of the average price at which a stock is traded over a given period of time. How it's used Identify entry and exit points:   Traders can use VWAP to determine when to buy or sell an asset.   Understand price trends :  Traders can use V
FREE
Pin Bars MT5
Yury Emeliyanov
Main purpose:   "Pin Bars"   is designed to automatically detect pin bars on financial market charts. A pin bar is a candle with a characteristic body and a long tail, which can signal a trend reversal or correction. How it works:   The indicator analyzes each candle on the chart, determining the size of the body, tail and nose of the candle. When a pin bar corresponding to predefined parameters is detected, the indicator marks it on the chart with an up or down arrow, depending on the directi
FREE
Shadow Flare MT5
Kestutis Balciunas
L’indicateur Shadow Flare est un outil de tendance et de liquidité non re‑dessinant pour MetaTrader 5. Il calcule une ligne de base configurable à partir d’une moyenne mobile (HMA, EMA, SMA ou RMA), l’entoure d’un canal basé sur l’Average True Range et produit un état de tendance « collant » qui ne change que lorsque le cours de clôture franchit la borne supérieure ou inférieure. Le même moteur de tendance alimente un module automatique de zones d’offre et de demande qui détecte les sommets et c
FREE
GDS Renko Pip ST - Fixed Brick Renko Chart Tool for MetaTrader 5 GDS Renko Pip ST is a Renko chart tool for MetaTrader 5 designed for traders who want to build and study fixed brick Renko movement using a practical pip or point-based setup. The purpose of this tool is simple: create a cleaner Renko structure so the trader can observe direction, brick runs, pullbacks, support and resistance behavior without normal candle noise. This is not a signal indicator and it does not predict the market. It
FREE
GDS Renko Pip ST Chart - Pip-Based Renko Chart Indicator for MetaTrader 5 GDS Renko Pip ST Chart is a pip-based Renko chart indicator for MetaTrader 5. It helps traders build and study cleaner Renko price movement using a practical fixed pip or point-based brick structure. This tool is designed as a Renko chart foundation for manual analysis. It does not predict the market, does not generate buy or sell signals and does not decide whether a trade should be opened. What Pip ST Chart Does Renko ch
FREE
SMMA Bands Indicator
Elie Baptiste Granger
The SMMA Bands indicator is an advanced volatility-based trading tool that creates 6 dynamic support and resistance levels around an envelope formed by two Smoothed Moving Averages (SMMA).  This indicator combines the reliability of SMMA trend identification with the precision of standard deviation-based volatility bands, making it suitable for both trend-following and mean-reversion strategies. Every band has its own buffer for use in EA. feel free to make suggestions and add reviews , i will
FREE
The indicator highlights the points that a professional trader sees in ordinary indicators. VisualVol visually displays different volatility indicators on a single scale and a common align. Highlights the excess of volume indicators in color. At the same time, Tick and Real Volume, Actual range, ATR, candle size and return (open-close difference) can be displayed. Thanks to VisualVol, you will see the market periods and the right time for different trading operations. This version is intended f
FREE
Sweep Liquidity
Nawal Kishor Yadav
Liquidity Sweep Pro v3.2 — Détection de Liquidité Smart Money Indicateur professionnel conçu pour détecter les balayages de liquidité institutionnels en temps réel. Identifie les balayages de Buy-Side Liquidity (BSL) et Sell-Side Liquidity (SSL) avec une classification automatique en Strong et Weak. Fonctionnalités Principales : • Détection en temps réel des balayages BSL et SSL • Classification Strong vs Weak basée sur le ratio de mèche, la clôture du corps et le volume • Filtres de qualité int
FREE
Read This : Please provide comments and reviews for future improvements. WaveTrendPro_Indi v1.05 WaveTrend indicator with enhanced histogram visualization : Histogram is now scaled higher (adjustable via  HistScale ). Different colors for positive & negative bars, making trend direction clearer. Lightweight & responsive across pairs and timeframes. Perfect for scalpers, swing traders, and trend-following strategies. WaveTrendPro_Indi v1.05 Indikator WaveTrend dengan tampilan histogram yang le
FREE
Frato Vwap Bands
Francisco Felipe Alves Da Silva Rocha
Bandes VWAP de Frato — Prix moyen pondéré par le volume avec écart type Les Bandes VWAP de Frato sont un indicateur qui combine le VWAP traditionnel avec des bandes de volatilité dynamiques. Il offre une vue multi-périodes du prix moyen pondéré par le volume. Fonctionnalités principales : L’indicateur calcule le VWAP (Prix moyen pondéré par le volume) et trace jusqu’à 3 bandes supérieures et inférieures en fonction de l’écart type. Le calcul est réinitialisé au début de chaque nouvelle pério
FREE
Renko subwindow
Alexandre Vincent Traber
Overview Renko SubWindow affiche un graphique Renko en bougies colorées dans une fenêtre d'indicateur séparée, sans affecter le graphique principal. La taille de brique peut être fixe en points ou calculée dynamiquement via l'ATR pour des briques adaptatives basées sur la volatilité. How it works Reconstruit les briques Renko à partir des prix de clôture du symbole/timeframe actuel. Une nouvelle brique se forme dès que le prix dépasse la taille définie depuis la clôture de la brique précédente.
FREE
Phoenix Delta Volume
Nigel Nii Darku Narnor Darko
This is the Phoenix Institutional SMC Dashboard (Emerald-Teal Edition). It is engineered to provide retail traders with the same "Volume-at-Price" clarity used by institutional desks. Below is a full breakdown of the benefits, the high-confluence logic for entries, and how to manage your trades using the current visual engine. Strategic Benefits to the User Sentiment over Price: Most indicators only look at where the price is. This dashboard tells you how much effort (Volume Delta) was required
FREE
LT Donchian Channel
Thiago Duarte
4.86 (7)
Donchian Channel is an indicator created by Richard Donchian. It is formed by taking the highest high and the lowest low of the last specified period in candles. The area between high and low is the channel for the chosen period. Its configuration is simple. It is possible to have the average between the upper and lower lines, plus you have alerts when price hits one side. If you have any questions or find any bugs, please contact me. Enjoy!
FREE
Value Chart Candlesticks
Flavio Javier Jarabeck
4.57 (14)
The idea of a Value Chart indicator was presented in the very good book I read back in 2020 , " Dynamic Trading Indicators: Winning with Value Charts and Price Action Profile ", from the authors Mark Helweg and David Stendahl. The idea is simple and the result is pure genius: Present candlestick Price analysis in a detrended way! HOW TO READ THIS INDICATOR Look for Overbought and Oversold levels. Of course, you will need to test the settings a lot to find the "correct" one for your approach. It
FREE
Pinbar MT5
Nedyalka Zhelyazkova
5 (1)
Pin bar pattern   is characterized by a long upper or lower wick with a small body relative to the size of the wick with little to no lower or upper shadows. Pin bars are not to be traded in isolation , but need to be considered within the larger context of the chart analysis. A pin bar entry signal, in a trending market, can offer a very high-probability entry and a good risk to reward scenario. Inputs Multiplier ; AlertOn   - enable alerts; EmailAlert   - enable email alerts; PushAlert   - en
FREE
Waves Sizer
Flavio Javier Jarabeck
3.86 (7)
Wyckoff fans, enjoy! Ideally to be used with the Weis Waves indicator, but it can be easily used alone, the Waves Sizer puts the range (in resulting Price movement) done by the Price on its market swings. You can control how accurate or loose will be the swings. This tool is very helpful for visually know how much the Price has traveled in your Timeframe. This way you can confront this level of effort with the resulting Volume, etc... Weis Waves indicator: https://www.mql5.com/en/market/produc
FREE
Automatic Trendlines
Pasi Hakamaki
4.68 (50)
The indicator draws trendlines on chart. This indicator has six inputs. User can specify alternative labels for both lines. If multiple instances of the indicator are used, the labels must differ. User can set width and color of the lines and depth which specifies what significant peaks should be used. For example, Depth=10 sets trendlines using the current peaks and valleys that have at least 10 bars to the right and to the left and that have highs/lows less/greater than the peak's high/low. In
FREE
-- Simple mais efficace. Indicateur d'inversion - Qu'est-ce que c'est ? Un indicateur superposé qui suit les tendances et combine la logique SuperTrend avec la technologie des courbes exponentielles. Il détecte la direction de la tendance, trace un canal dynamique sur le graphique et envoie des alertes en temps réel lorsque la tendance s'inverse. Comment fonctionne-t-il ? L'indicateur calcule une ligne de base exponentielle à l'aide de l'ATR et d'un facteur SuperTrend. Lorsque le prix clôture
FREE
GDS Renko ATR - ATR-Based Renko Chart Indicator for MetaTrader 5 GDS Renko ATR is a free ATR-based Renko chart indicator for MetaTrader 5. It helps traders build and study Renko movement using a volatility-adaptive brick size based on Average True Range. The purpose of this tool is to provide a flexible Renko chart foundation for manual market analysis. It does not predict the market, does not generate buy or sell signals and does not decide whether a trade should be opened. Why ATR Renko Matter
FREE
Donchian Breakout And Rsi
Mattia Impicciatore
4.5 (2)
Description générale Cet indicateur est une version améliorée du Canal Donchian classique, enrichie de fonctionnalités pratiques pour le trading réel. En plus des trois lignes standard (supérieure, inférieure et ligne médiane), le système détecte les cassures et les affiche visuellement avec des flèches sur le graphique, en montrant uniquement la ligne opposée à la direction actuelle de la tendance pour une lecture plus claire. L’indicateur comprend : Signaux visuels : flèches colorées lors des
FREE
Bollinger Bands B
Flavio Javier Jarabeck
4.5 (6)
John Bollinger created this indicator in 2010 as a way to read the original indicator (Bollinger Bands) in a more "technical" way, shown as an oscillator. The typical range of the Bollinger Bands %B is 0 - 0.5 - 1.0, where "0" represents the lower band, the "0.5" the middle band, and "1" the upper band. The line on the indicator represents the Closing prices. As simple as that. SETTINGS Bollinger Bands period of analysis Standard Deviation multiplier Shift Price type to be analyzed If you like
FREE
Are you tired of drawing trendlines every time you're analyzing charts? Or perhaps you would like more consistency in your technical analysis. Then this is for you. This indicator will draw trend lines automatically when dropped on a chart. How it works Works similar to standard deviation channel found on mt4 and mt5. It has 2 parameters: 1. Starting Bar 2. Number of bars for calculation The   starting bar   is the bar which drawing of the trend lines will begin, while the   number of bars for c
FREE
Do you find it difficult to track and manage your open positions across multiple different symbols in MetaTrader 5? Do you need a quick and comprehensive overview of your current market exposure and the performance of each symbol individually? The "Dynamic Exposure Table" indicator is your ideal tool! This indicator displays a clear and detailed table in a separate window below the chart, summarizing all your open positions and intelligently grouping them by symbol, giving you a complete view of
FREE
HTF Candles Nika superpose des bougies en taille réelle provenant de n'importe quelle période supérieure directement sur le graphique actuel dans MetaTrader 5. Il offre une vue multi-unités de temps claire sans quitter votre graphique. Fonctionnalites principales - Dessine les bougies de la période supérieure sous forme de rectangles remplis avec des mèches sur le graphique actuel - Prend en charge les modes d'affichage : bougies standard et Heiken Ashi - Minuterie de compte à rebours en direc
FREE
MIDAS Super VWAP
Flavio Javier Jarabeck
4.27 (11)
Imagine VWAP, MVWAP and MIDAS in one place... Well, you found it! Now you can track the movement of Big Players in various ways, as they in general pursue the benchmarks related to this measuring, gauging if they had good execution or poor execution on their orders. Traders and analysts use the VWAP to eliminate the noise that occurs throughout the day, so they can measure what prices buyers and sellers are really trading. VWAP gives traders insight into how a stock trades for that day and deter
FREE
PZ Penta O MT5
PZ TRADING SLU
3.8 (5)
The Penta-O is a 6-point retracement harmonacci pattern which usually precedes big market movements. Penta-O patterns can expand and repaint quite a bit. To make things easier this indicator implements a twist: it waits for a donchian breakout in the right direction before signaling the trade. The end result is an otherwise repainting indicator with a very reliable trading signal. The donchian breakout period is entered as an input. [ Installation Guide | Update Guide | Troubleshooting | FAQ | A
FREE
Each VolumeProfile holds: The price range for a given period Buy/sell volume for each price level Calculated POC, VAH, VAL, Delta, and Imbalance Indicator Logic Summary Divide data by timeframe (e.g., one H1 profile per hour). Aggregate volumes for each price level. Separate buy and sell volumes using tick or trade direction. Compute Delta (Buy − Sell) and Imbalance (dominance ≥70%). Detect POC, VAH, VAL to outline the Value Area. Draw graphical profiles beside price candles using color-co
Bar Color Trend
Germano Chagas
4.38 (8)
Combining the best of Price Action , Directional Movement , and Divergence/Convergence analysis, Candle Color Trend is a easy and reliable way to identify trend direction. The indicator automatically paints the candles according to the assumption that an uptrend is defined by prices that form a series of higher highs and higher lows. In contrast, a downtrend is defined by prices that form a series of lower highs and lower lows. Additionally, ADX Wilder indicator is used to measure trend weakness
FREE
Stackable VWAP
Flavio Javier Jarabeck
3.5 (4)
Volume Weighted Average Price (VWAP) is a trading benchmark commonly used by Big Players that gives the average price a Symbol has traded throughout the day. It is based on both Volume and price. Additionally we put in this indicator the MVWAP (Moving Volume Weighted Average Price). For those who do not know the usage and the importance od this indicator I recommend a great article about this subject at Investopedia ( https://www.investopedia.com/articles/trading/11/trading-with-vwap-mvwap.asp
FREE
Les acheteurs de ce produit ont également acheté
Ce produit a été mis à jour pour le marché 2026 et optimisé pour les dernières versions de MT5. AVIS DE MISE À JOUR DU PRIX : Smart Trend Trading System est actuellement disponible à $99 . Le prix passera à $199 après les 30 prochains achats . OFFRE SPÉCIALE : Après avoir acheté Smart Trend Trading System, envoyez-moi un message privé pour recevoir Smart Universal EA GRATUITEMENT et transformer vos signaux Smart Trend en trades automatisés. Smart Trend Trading System est un système de trading c
Trend Sniper X
Sarvarbek Abduvoxobov
5 (8)
Trend Sniper X est un indicateur de suivi de tendance multi-période pour MetaTrader 5 qui aide les traders à identifier la direction de la tendance et les points de retournement potentiels avec clarté et précision. Informations sur le prix : Le prix actuel est un prix promotionnel et est sujet à changement à mesure que les futures mises à jour et nouvelles fonctionnalités seront publiées. Canal Code2Profit Maîtrisez le marché grâce à l'analyse multi-période ! Spécifications techniques Plateforme
Welcome to ENTRY IN THE ZONE AND SMC MULTI TIMEFRAME Entry In The Zone and SMC Multi Timeframe is a professional trading indicator built on Smart Money Concepts (SMC) , combining market structure analysis with a No Repaint BUY / SELL signal system in a single indicator. It helps traders understand market structure more clearly, identify key price zones, and focus on higher-quality trading opportunities. By combining Multi-Timeframe Analysis , Points of Interest (POIs) , and real-time signals, th
Commençons par être honnêtes. Aucun indicateur ne vous rendra rentable à lui seul. Si quelqu’un vous dit le contraire, il vous vend un rêve. Tout indicateur qui affiche des flèches parfaites d’achat/vente peut être rendu impeccable — il suffit de zoomer sur la bonne partie de l’historique et de capturer uniquement les trades gagnants. Nous ne faisons pas cela.  SMC Intraday Formula est un outil. Il lit la structure du marché pour vous, identifie les zones de prix à la probabilité la plus élevée
SuperScalp Pro
Van Minh Nguyen
4.6 (30)
SuperScalp Pro –  Système Professionnel de Scalping à Confluence Multicouche SuperScalp Pro est un système professionnel de scalping à confluence multicouche, conçu pour aider les traders à identifier des opportunités à plus forte probabilité grâce à des confirmations d'entrée plus claires, des niveaux de Stop Loss et de Take Profit basés sur l'ATR, ainsi qu'un filtrage flexible des signaux sur le XAUUSD, le BTCUSD et les principales paires de devises du Forex. La documentation complète est disp
La légende est de retour : Entry Points Pro 10. La relance de l'indicateur légendaire qui s'est maintenu 3 ans dans le Top-3 du MQL5 Market. Des centaines d'avis enthousiastes (589 sur les deux versions), des milliers de traders l'utilisent chaque jour, 31 000+ téléchargements de la démo   MT4+MT5 . J'ai lu chacun de vos avis publiés en cinq ans — et au lieu de promettre, j'ai intégré les réponses directement dans la version 10. Par un auteur présent sur les marchés depuis 1999, qui tient à l'ho
Gold Entry Sniper
Tahir Mehmood
5 (18)
Gold Entry Sniper – Tableau de Bord ATR Multi-Unités de Temps pour Scalping et Swing Trading sur l'Or Gold Entry Sniper est un indicateur avancé pour MetaTrader 5 qui fournit des signaux d'achat/vente précis sur XAUUSD et autres actifs, basé sur la logique de Trailing Stop ATR et l' analyse multi-unités de temps . Caractéristiques et Avantages Clés Analyse Multi-Unités de Temps – Affiche les tendances en M1, M5, M15 sur un seul tableau. Trailing Stop Basé sur l'ATR – Ajuste automatiquement selon
M1 Quantum MT5
Hamed Dehgani
4.6 (10)
Signaux de Trading en Direct avec M1 Quantum : Signal   (L’opération est exécutée automatiquement par le Quantum Trade Assistant , inclus gratuitement avec ce produit.) Plan de prix : Prix actuel : $169 (Offre de lancement) Prochain prix prévu : $189 Prix de vente prévu : $299 Note du développeur : Après votre achat, veuillez me contacter pour recevoir le dernier fichier de configuration recommandé (Set File) , des conseils d'utilisation, ainsi qu'une invitation au groupe d'assistance VIP , où
Divergence Bomber
Ihor Otkydach
4.9 (92)
De temps en temps, je trade moi-même selon ce système. Découvrez mon trading manuel « BOMBER » sur un compte réel : LIVE SIGNAL Chaque acheteur de cet indicateur reçoit également gratuitement : L’outil exclusif « Bomber Utility », qui accompagne automatiquement chaque opération de trading, fixe les niveaux de Stop Loss et de Take Profit, et clôture les positions selon les règles de la stratégie Des fichiers de configuration (set files) pour adapter l’indicateur à différents actifs Des set files
Neuro Poseidon MT5
Daria Rezueva
4.73 (55)
Neuro Poseidon is a new indicator by Daria Rezueva. It combines precise trading signals with adaptive TP/SL levels - creating best possible trades as a result! Message me and get  Neuro Poseidon Assistant  as a gift to automize your trading process! What makes it stand out? 1. Proven profitability on all assets and timeframes 2. Only confirmed BUY and SELL signals present on the chart 3. Adaptive TP & SL levels generated by the software for each trade 4. Easy to understand - suitable for al
Gann Made Easy   est un système de trading Forex professionnel et facile à utiliser qui est basé sur les meilleurs principes de trading en utilisant la théorie de mr. WD Gann. L'indicateur fournit des signaux d'ACHAT et de VENTE précis, y compris les niveaux Stop Loss et Take Profit. Vous pouvez échanger même en déplacement en utilisant les notifications PUSH. VEUILLEZ ME CONTACTER APRÈS L'ACHAT POUR RECEVOIR GRATUITEMENT DES INSTRUCTIONS DE TRADING ET D'EXCELLENTS INDICATEURS SUPPLÉMENTAIRES! V
Atomic Analyst MT5
Issam Kassas
4.38 (47)
Ce produit a été mis à jour pour le marché 2026 et optimisé pour les dernières versions de MT5. AVIS DE MISE À JOUR DU PRIX : Atomic Analyst est actuellement disponible à $99 . Le prix passera à $199 après les 30 prochains achats . OFFRE SPÉCIALE : Après avoir acheté Atomic Analyst, envoyez-moi un message privé pour recevoir Smart Universal EA GRATUITEMENT et transformer vos signaux Atomic Analyst en trades automatisés. Atomic Analyst est un indicateur de trading Price Action sans repaint, san
ARICoins
Temirlan Kdyrkhan
ARICoin is a powerful trading companion designed to generate high-probability entry signals with dynamic TP/SL/DP levels based on volatility. Built-in performance tracking shows win/loss stats, PP1/PP2 hits, and success rates all updated live. Key Features: Buy/Sell signals with adaptive volatility bands Real-time TP/SL/DP levels based on ATR Built-in MA Filter with optional ATR/StdDev volatility Performance stats panel (Success, Profit/Loss, PP1/PP2) Alerts via popup, sound, push, or email Cust
GoldenX Entry MT5
Kareem Abbas
5 (15)
GoldenX Entry est un indicateur MT5 doté d’un algorithme adaptatif Smart Entry Trend, d’un système de scoring des signaux, d’un détecteur de régime de marché et d’un filtre de volatilité. Chaque signal inclut un niveau d’entrée calculé, trois niveaux de Take-Profit (TP1, TP2, TP3) ainsi qu’un niveau de Stop-Loss. Il est construit sur plusieurs couches analytiques conçues pour s’adapter à différentes conditions de marché, combinant un système analytique multicouche avec un optimiseur intégré et u
Trend Catcher ind mt5
Ramil Minniakhmetov
5 (17)
INDICATEUR DE DÉTECTEUR DE TENDANCE L'indicateur de détecteur de tendance analyse les mouvements de prix du marché grâce à une combinaison d'indicateurs d'analyse de tendance adaptatifs, propriétaires et personnalisés. Il identifie la véritable direction du marché en filtrant les fluctuations à court terme et en se concentrant sur la force de la dynamique sous-jacente, l'expansion de la volatilité et la structure des prix. Il utilise également une combinaison d'indicateurs personnalisés de lis
Zoryk Gold
Reda El Koutbane
5 (4)
ZORYK — Système avancé de signaux XAUUSD pour MetaTrader 5 Vous connaissez certainement cette sensation. Vous passez du temps à analyser l’or. Vous attendez le bon point d’entrée. Vous ouvrez enfin la position, puis le prix commence immédiatement à évoluer contre vous. Vous fermez trop tôt, déplacez le Stop Loss ou hésitez pendant quelques secondes. Ensuite, le marché atteint exactement l’objectif que vous aviez initialement prévu, mais sans vous dans la position. Le problème n’était pas toujour
Crystal Heikin Ashi Signals
Muhammad Jawad Shabir
5 (2)
Crystal Heikin Ashi Signals - Professional Trend & Signal Detection Indicator Advanced Heikin Ashi Visualization with Intelligent Signal System for Manual & Automated Trading Final Price: $149 ---------> Price goes up $10 after every 10 sales . Limited slots available — act fast . Overview Crystal Heikin Ashi Signals is a professional-grade MetaTrader 5 indicator that combines pure Heikin Ashi candle visualization with an advanced momentum-shift detection system. Designed for both manual traders
ARIPoint
Temirlan Kdyrkhan
1 (1)
ARIPoint is a powerful trading companion designed to generate high-probability entry signals with dynamic TP/SL/DP levels based on volatility. Built-in performance tracking shows win/loss stats, PP1/PP2 hits, and success rates all updated live. Key Features: Buy/Sell signals with adaptive volatility bands Real-time TP/SL/DP levels based on ATR Built-in MA Filter with optional ATR/StdDev volatility Performance stats panel (Success, Profit/Loss, PP1/PP2) Alerts via popup, sound, push, or email Cu
Power Candles MT5
Daniel Stein
5 (9)
Power Candles V3 - Indicateur de force à optimisation automatique Power Candles V3 transforme la force des devises et des instruments en un plan de trading exploitable sur chaque graphique auquel il est associé. Au lieu de se contenter de colorer les bougies, il effectue une optimisation automatique en temps réel en arrière-plan et vous fournit les meilleurs niveaux de Stop Loss, Take Profit et seuils de signal pour le symbole que vous avez sous les yeux. Un simple clic suffit pour l'adopter en
Gem SIGNAL
Shengzu Zhong
5 (1)
GEM Signal Pro GEM Signal Pro est un indicateur de suivi de tendance pour MetaTrader 5, conçu pour les traders qui souhaitent des signaux plus clairs, des configurations de trade plus structurées et une gestion du risque plus pratique directement sur le graphique. Au lieu d’afficher simplement une flèche, GEM Signal Pro aide à présenter l’idée complète du trade de manière plus claire et plus lisible. Lorsque les conditions sont confirmées, l’indicateur peut afficher le prix d’entrée, le stop los
L'indicateur UZFX {SSS} Scalping Smart Signals v4.0 MT5 est un indicateur de trading haute performance sans « repaint », conçu pour les scalpers, les day traders et les swing traders qui recherchent des signaux précis et en temps réel sur des marchés très volatils. Développé par (UZFX-LABS), cet indicateur combine l'analyse de l'action des prix, la confirmation de tendance et un filtrage intelligent pour générer des signaux d'achat et de vente à forte probabilité, des signaux d'alerte et des opp
M1 Sniper MT5
Oleg Rodin
5 (4)
M1 SNIPER   est un système d'indicateurs de trading facile à utiliser. Il s'agit d'un indicateur à flèche conçu pour l'unité de temps M1. Cet indicateur peut être utilisé seul pour le scalping sur l'unité de temps M1 ou intégré à votre système de trading existant. Bien que conçu spécifiquement pour le trading sur l'unité de temps M1, ce système peut également être utilisé avec d'autres unités de temps. Initialement, j'avais conçu cette méthode pour le trading du XAUUSD et du BTCUSD. Cependant, j
RelicusRoad Pro MT5
Relicus LLC
4.96 (24)
RelicusRoad Pro : Système d'Exploitation Quantitatif du Marché 70% DE RÉDUCTION ACCÈS À VIE (DURÉE LIMITÉE) - REJOIGNEZ 2 000+ TRADERS Pourquoi la plupart des traders échouent-ils même avec des indicateurs "parfaits" ? Parce qu'ils tradent des concepts isolés dans le vide. Un signal sans contexte est un pari. Pour gagner, il faut de la CONFLUENCE . RelicusRoad Pro est un Écosystème Quantitatif complet . Il cartographie la "Fair Value Road", distinguant le bruit des cassures structurelles. Arrête
SkyHammer Signal Pro Indicateur professionnel de signaux de tendance sans repaint, avec niveaux Entry, SL et TP verrouillés SkyHammer Signal Pro est un indicateur de tendance et de momentum structuré, conçu pour les traders qui recherchent des signaux clairs, fixes et vérifiables. Il fonctionne le mieux sur les timeframes courts, comme M1 et M5 . L’indicateur ne cherche pas à prédire les sommets ou les creux du marché. Il attend plutôt une structure de marché confirmée, une direction de tendance
Smc Pro ToolKit
Talal N Z Aljarusha
5 (3)
SMC Pro ToolKit  is a professional chart-based Smart Money Concepts indicator for MetaTrader 5. It helps traders read market structure, identify key liquidity areas, organize trade context, and plan setups directly from the chart. This is not a simple buy/sell arrow indicator. It is a complete visual trading toolkit that combines Smart Money Concepts, multi-timeframe analysis, session context, setup planning, risk assistance, and professional dashboard tools in one clean workspace. Watch setup
Currency Strength Wizard   est un indicateur très puissant qui vous offre une solution tout-en-un pour un trading réussi. L'indicateur calcule la puissance de telle ou telle paire de devises en utilisant les données de toutes les devises sur plusieurs périodes. Ces données sont représentées sous la forme d'un indice de devise facile à utiliser et de lignes électriques de devise que vous pouvez utiliser pour voir la puissance de telle ou telle devise. Tout ce dont vous avez besoin est d'attacher
Ce produit a été mis à jour pour le marché 2026 et optimisé pour les dernières versions de MT5. AVIS DE MISE À JOUR DU PRIX : Smart Price Action Concepts est actuellement disponible à $200 . Le prix passera à $299 après les 30 prochains achats . OFFRE SPÉCIALE : Après l’achat, envoyez-moi un message privé pour recevoir un bonus gratuit + un cadeau . Tout d’abord, il est important de souligner que cet outil de trading est un indicateur sans repaint, sans redrawing et sans retard, ce qui le rend
Atbot
Zaha Feiz
4.69 (55)
AtBot : Comment ça fonctionne et comment l'utiliser ### Comment ça fonctionne L'indicateur "AtBot" pour la plateforme MT5 génère des signaux d'achat et de vente en utilisant une combinaison d'outils d'analyse technique. Il intègre la Moyenne Mobile Simple (SMA), la Moyenne Mobile Exponentielle (EMA) et l'indice de la Plage Vraie Moyenne (ATR) pour identifier les opportunités de trading. De plus, il peut utiliser des bougies Heikin Ashi pour améliorer la précision des signaux. Laissez un avis ap
Btmm state engine pro
Garry James Goodchild
5 (4)
BTMM State Engine Pro is a MetaTrader 5 indicator for traders who use the Beat The Market Maker approach: Asian session context, kill zone timing, level progression, peak formation detection, and a multi-pair scanner from a single chart. It combines cycle state logic with a built-in scanner dashboard so you do not need the same tool on many charts at once. What it does Draws the Asian session range; session times can follow broker server offset or be set in inputs. Tracks level progression (L
Quantum TrendPulse
Bogdan Ion Puscasu
5 (25)
Présentation de   Quantum TrendPulse   , l'outil de trading ultime qui combine la puissance de   SuperTrend   ,   RSI   et   Stochastic   dans un seul indicateur complet pour maximiser votre potentiel de trading. Conçu pour les traders qui recherchent précision et efficacité, cet indicateur vous aide à identifier les tendances du marché, les changements de dynamique et les points d'entrée et de sortie optimaux en toute confiance. Caractéristiques principales : Intégration SuperTrend :   suivez f
Plus de l'auteur
Trix Trend
Bugra Kaan Yildirim
Overview Trix Trend is a momentum oscillator based on TRIX — the rate of change of a triple-smoothed exponential moving average of price. Triple smoothing removes most of the short-term noise, so the oscillator reacts to the underlying momentum of the move rather than to every small wiggle, while staying more responsive than a simple long moving average. The indicator draws a slope-colored TRIX line, a weighted signal line, a zero line, and two adjustable overbought/oversold levels. The line is
FREE
Filtrer:
lisi 7887
1770
lisi 7887 2026.07.31 15:28 
 

Fire!!!

mehmetmrt73
62
mehmetmrt73 2026.07.30 02:57 
 

L'utilisateur n'a laissé aucun commentaire sur la note

Bugra Kaan Yildirim
262
Réponse du développeur Bugra Kaan Yildirim 2026.07.30 06:56
Thank you for such a thoughtful review. You’ve described exactly what we set out to achieve: not only showing where the trailing stop is, but also helping traders judge whether the underlying trend is strong enough to trust. We’re especially pleased that you find the panel informative without cluttering the chart or tiring the eyes. We hope it continues to support your trading decisions as you spend more time with it, and we’d be glad to hear your feedback after further use. Thank you for choosing AlgoTeknik | Smart Chandelier Exit!
Répondre à l'avis