
Chart Drawing Toolkit
- 实用工具
- 版本: 1.42
- 更新: 11 八月 2026

Chart Drawing Toolkit is a complete drawing and chart-analysis workspace for MetaTrader 5. It places more than 50 drawing and markup tools in one fast, clean panel that docks to the edge of your chart, so every manual analysis tool you need is a single click away. It runs as an indicator, so it works alongside your Expert Advisors and other indicators on the same chart.
Overview
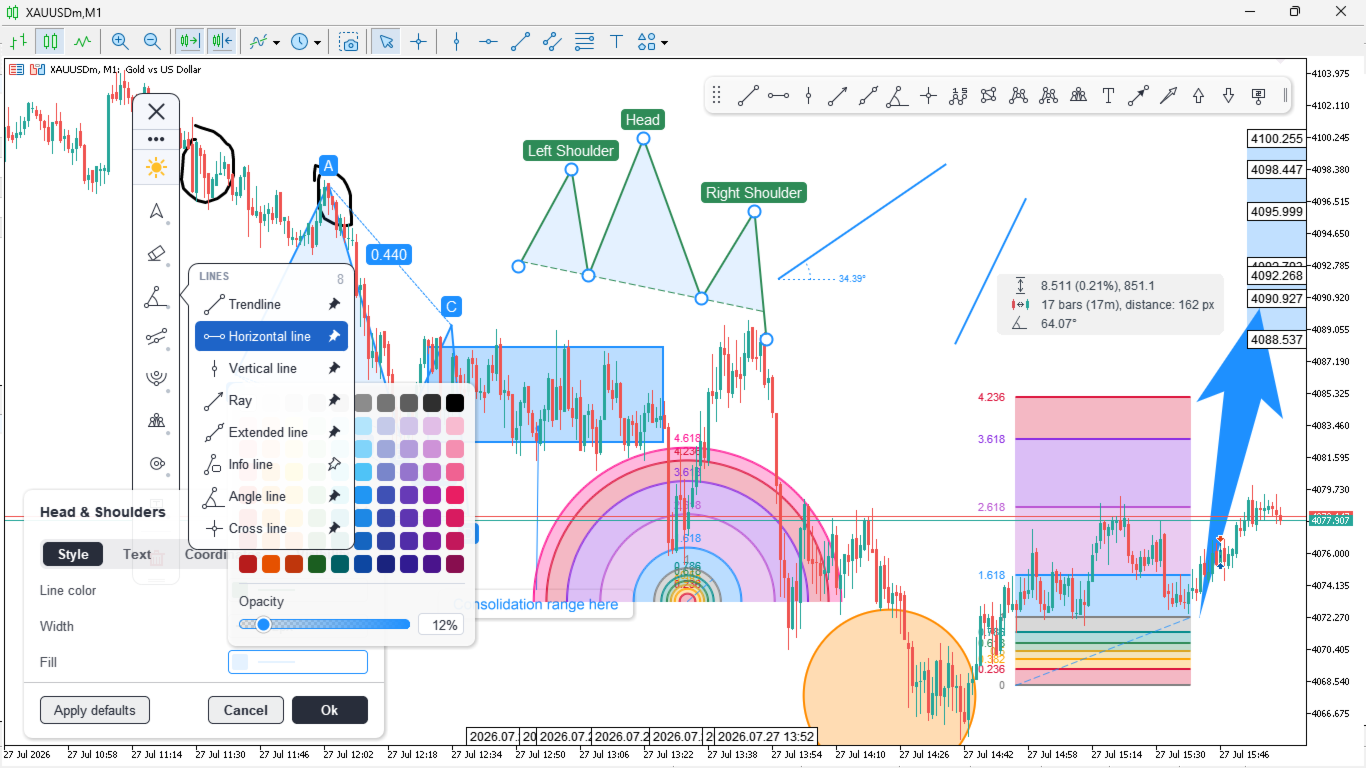
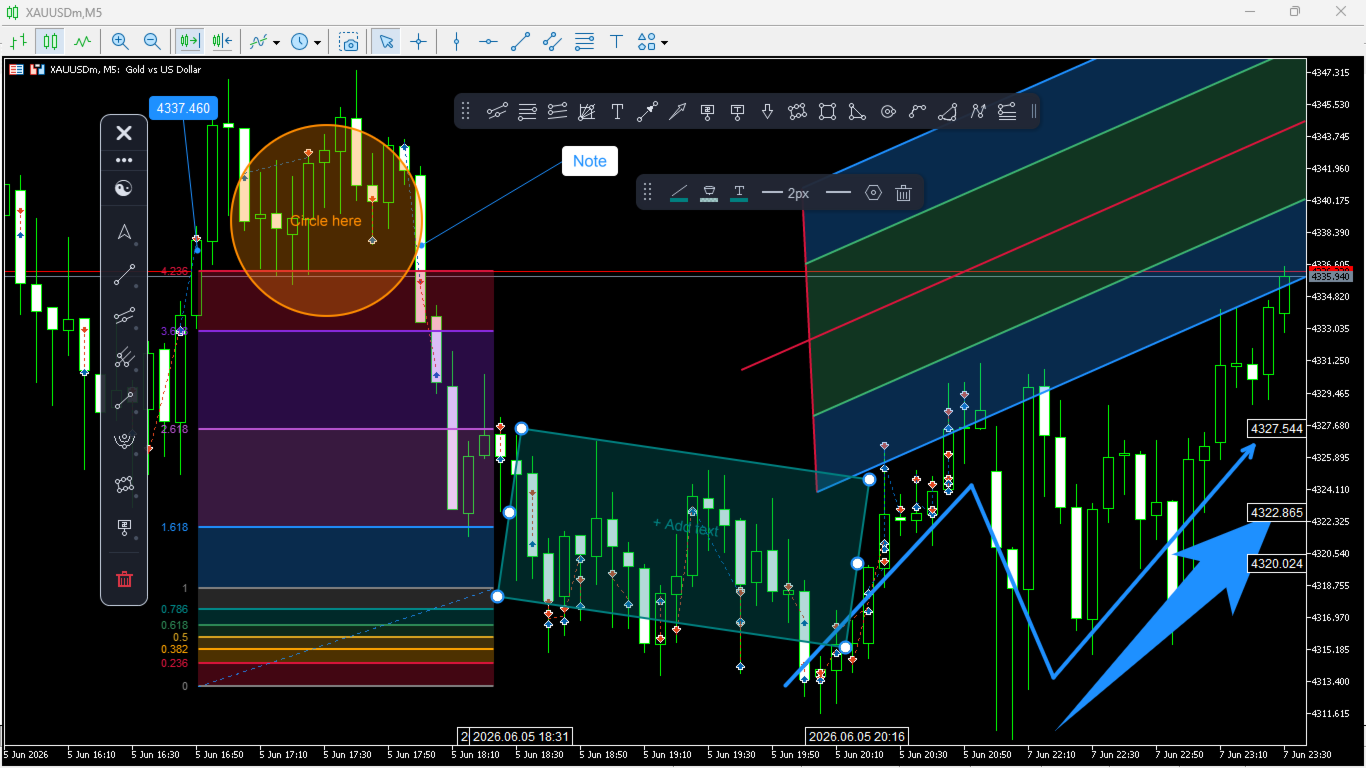
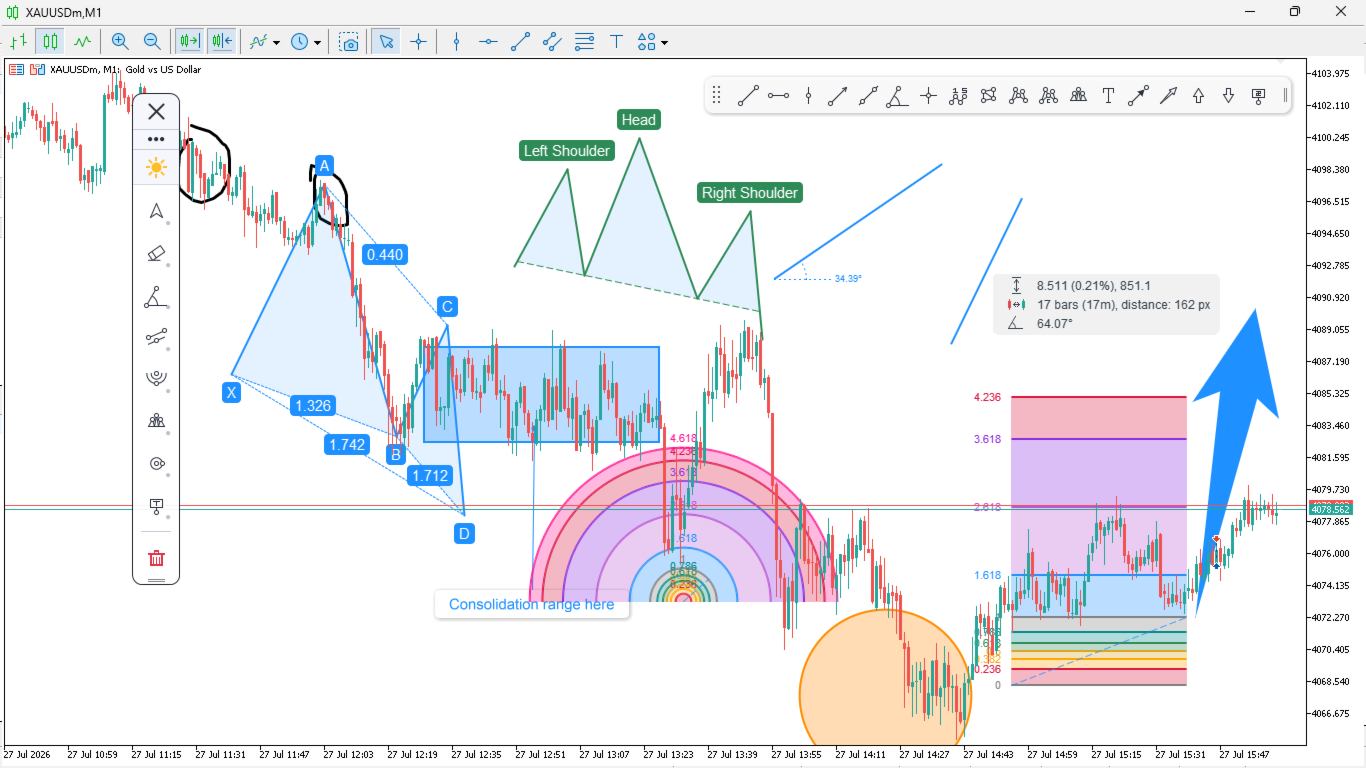
The toolkit combines a docking sidebar, a quick tool flyout, a pinned tools bar, a live properties bar for the selected object, and a settings window for precise control. Map market structure with trendlines and channels, project targets with Fibonacci, study geometry with Gann and pitchforks, mark harmonic patterns, sketch freehand, or annotate your ideas; all without cluttering your workspace.
Your drawings are saved automatically and come back exactly as you left them, on every symbol, across timeframe switches and terminal restarts.
Features
- Docking sidebar that snaps to the left or right edge of the chart, floats freely, resizes, and scrolls when needed
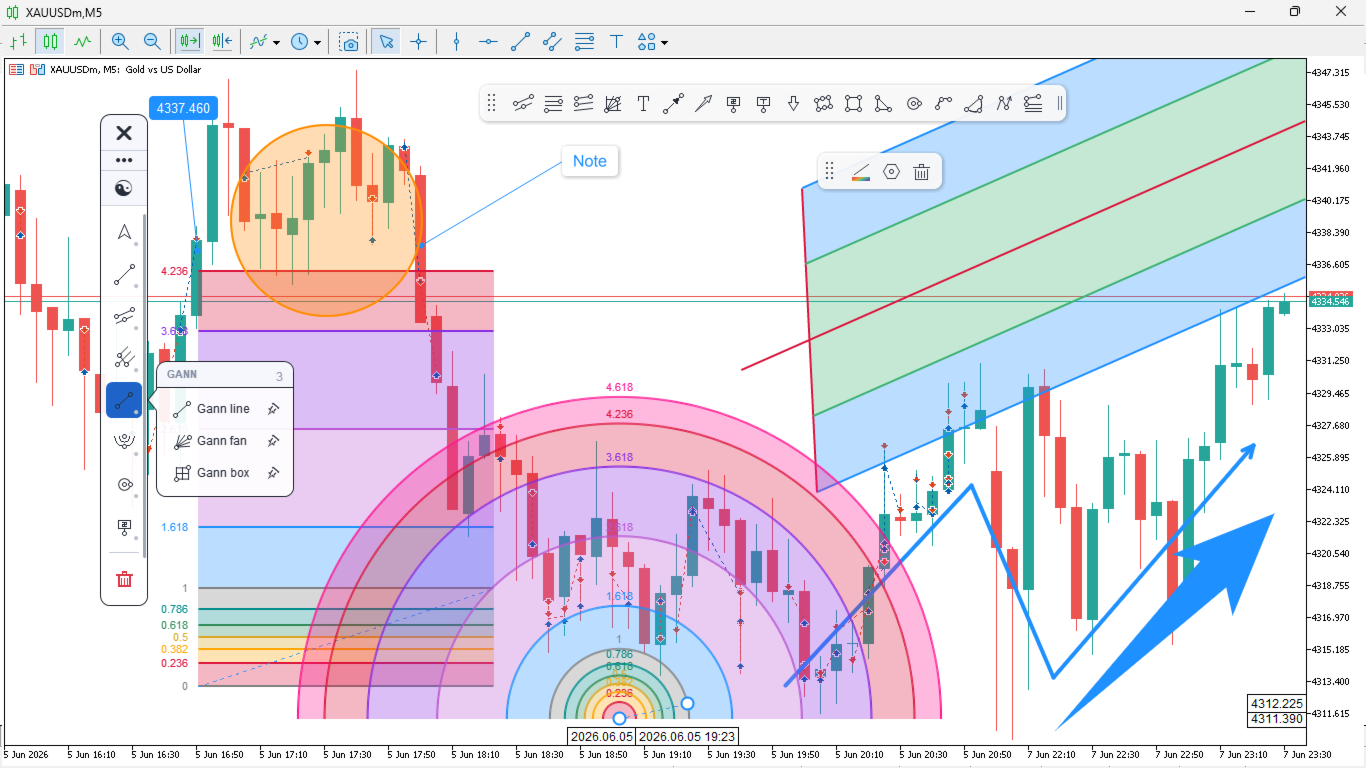
- Quick tool flyout that opens each category and sizes itself to its own contents
- Pinned tools bar for one-click access to the tools you use most
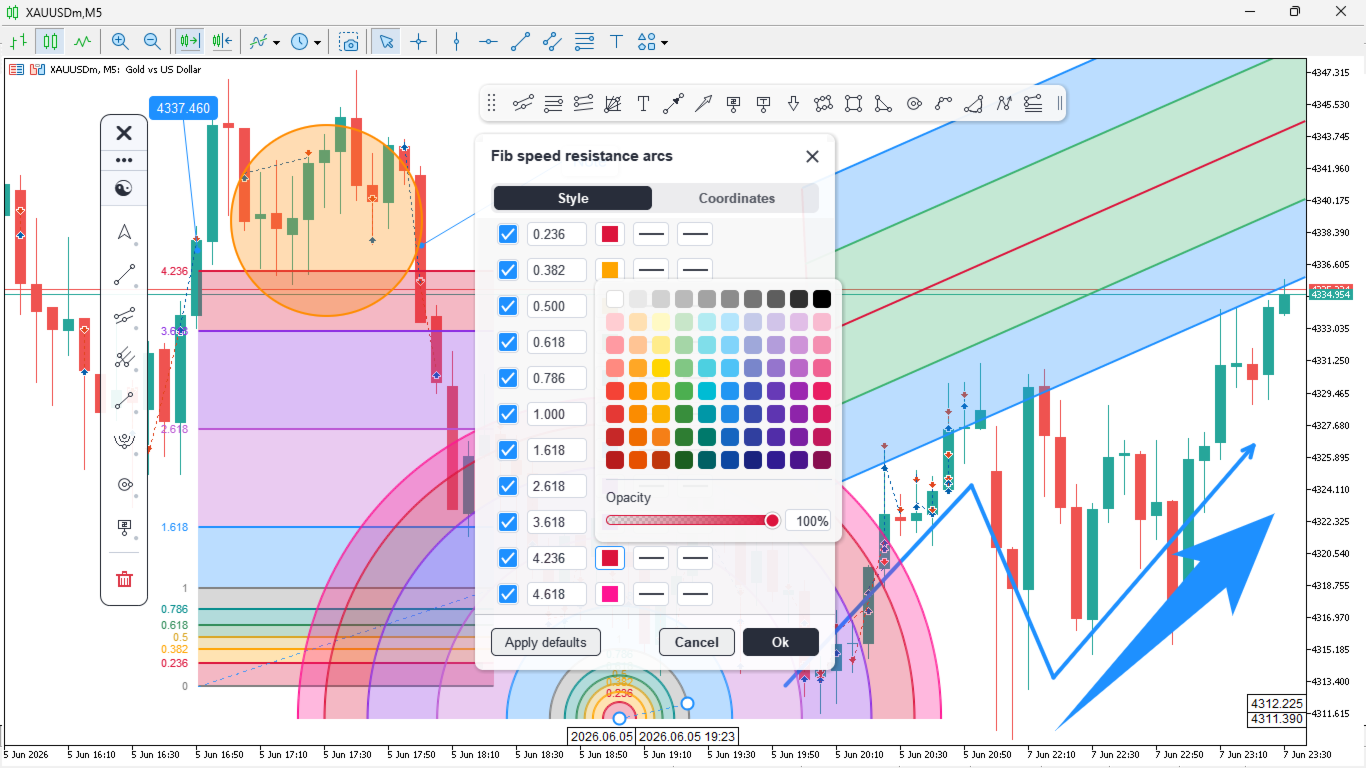
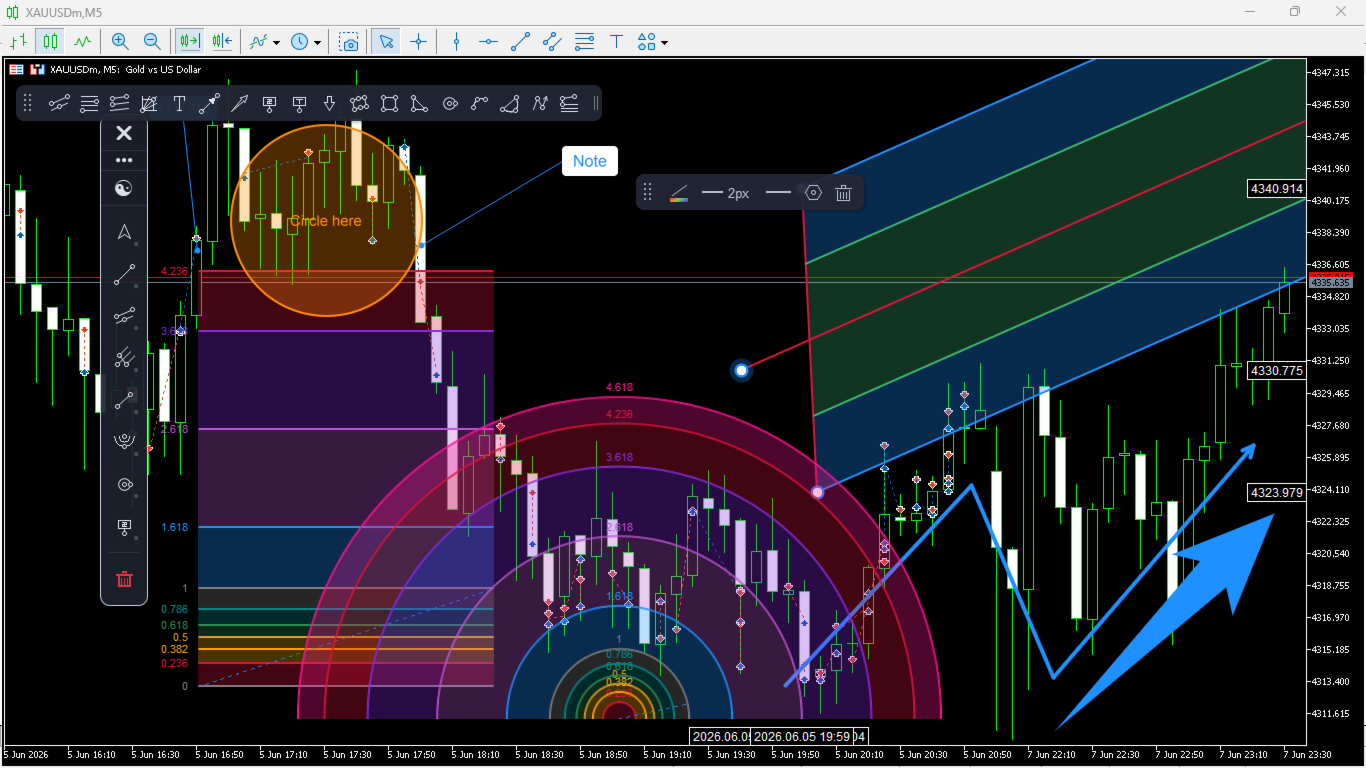
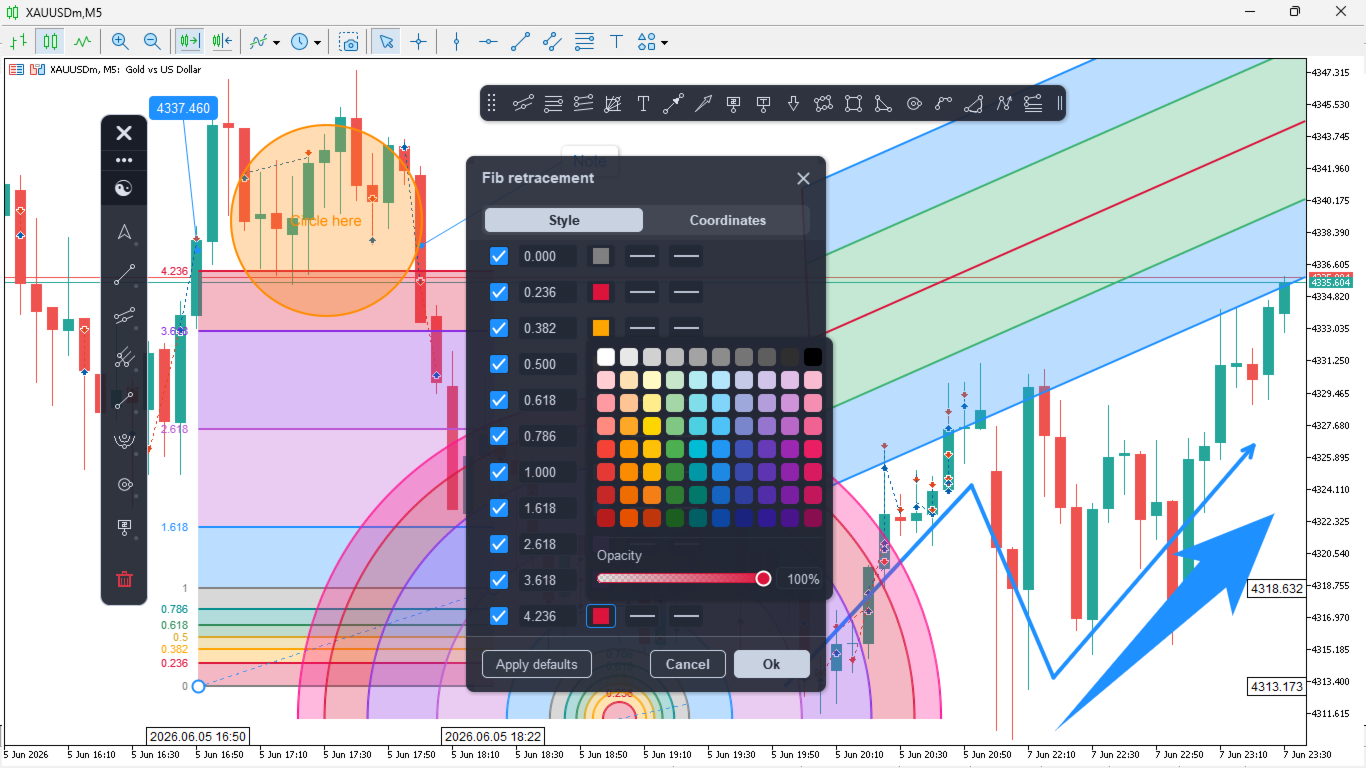
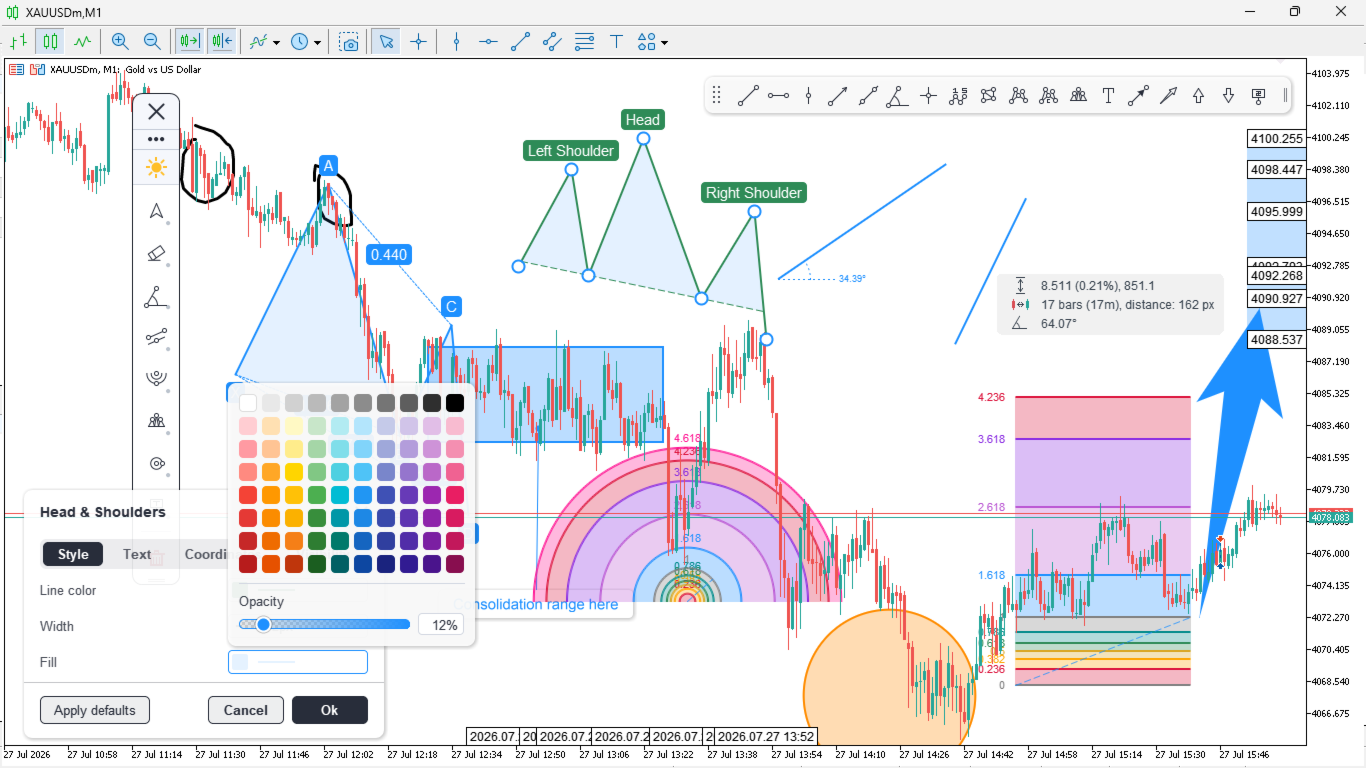
- Live properties bar to adjust colour, line width, style, opacity, font, and alignment on the selected object
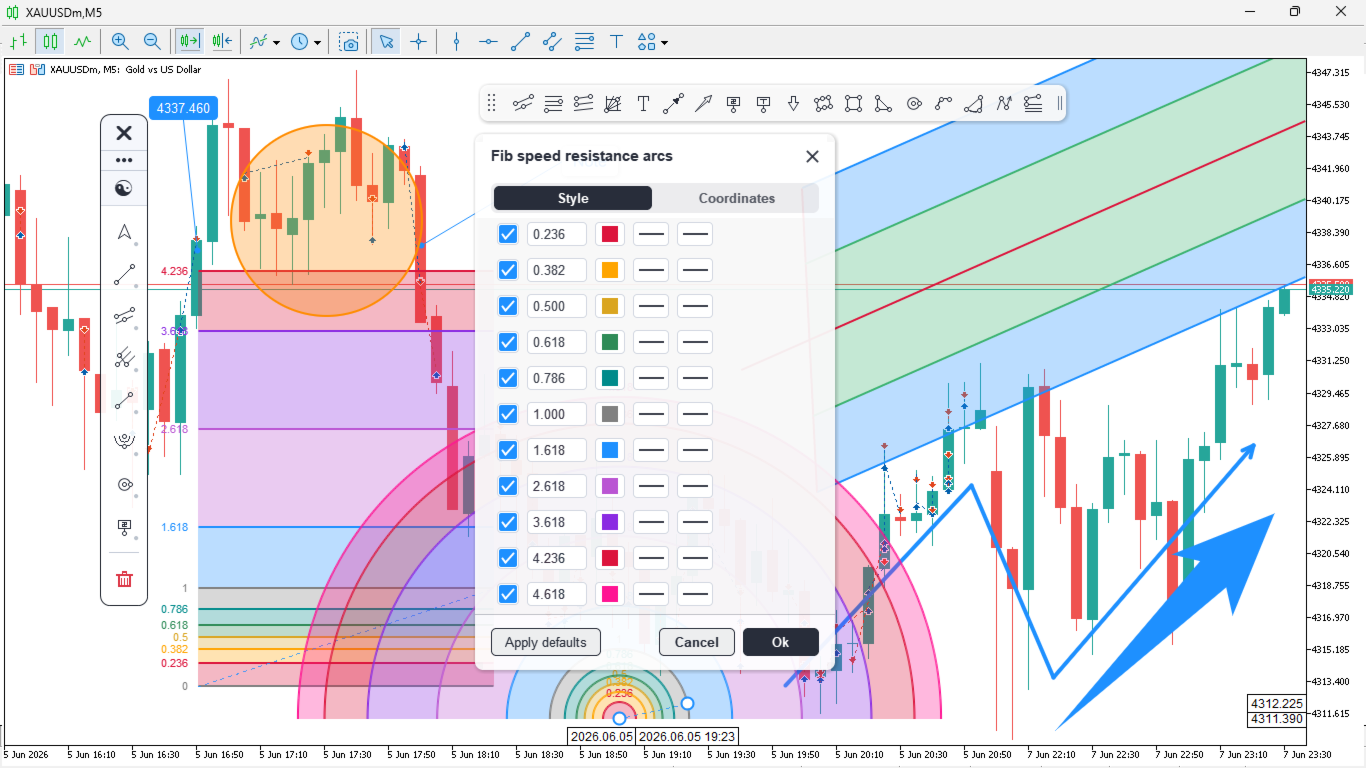
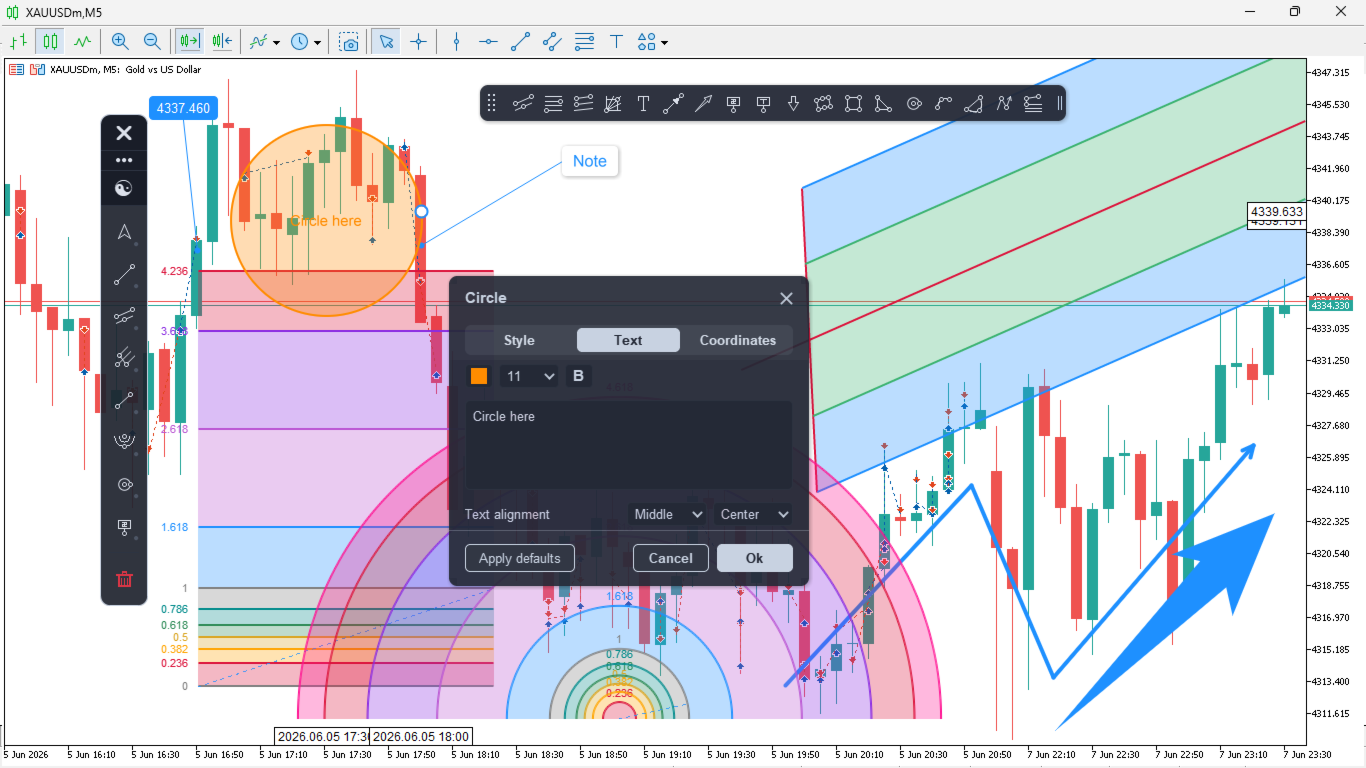
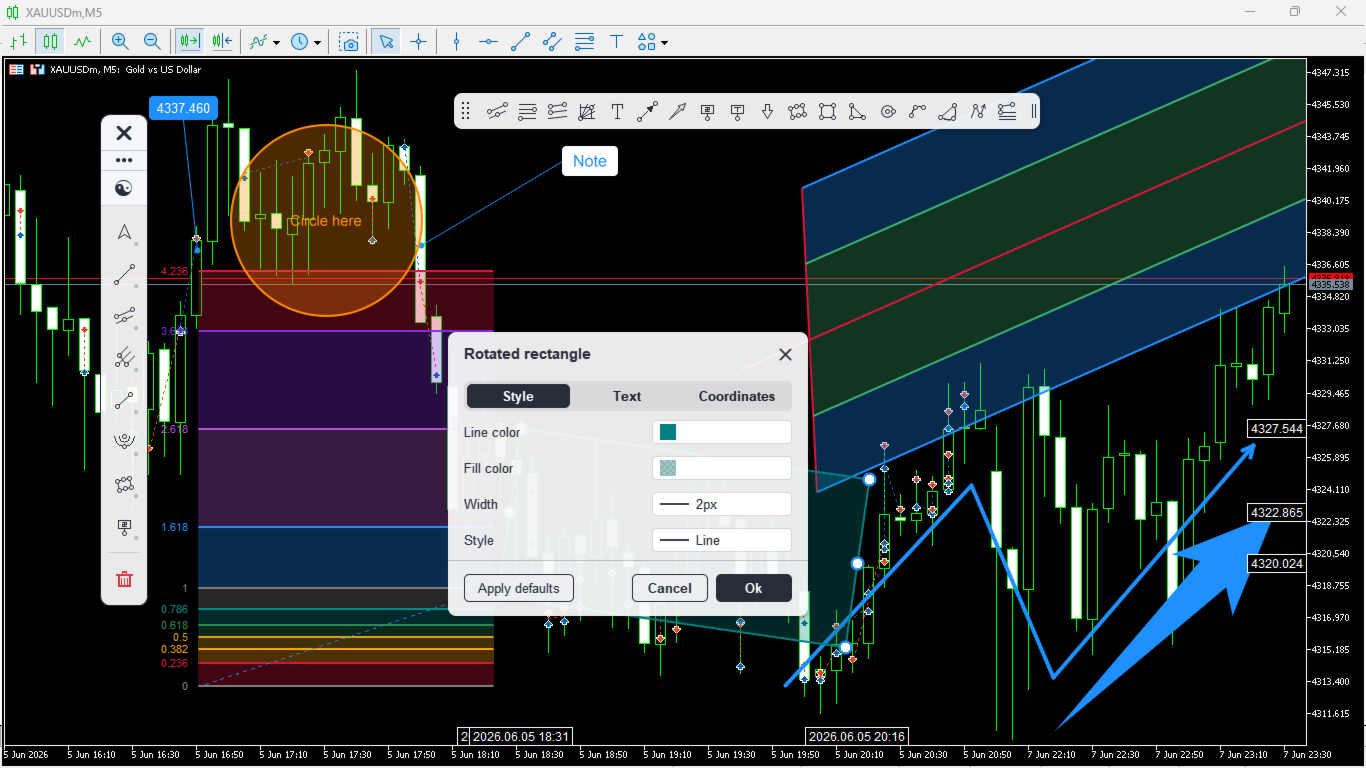
- Settings window with Style, Text, Coordinates and Visibility tabs, including exact price and time coordinates you can type in
- Per-object timeframe visibility; show a drawing only on the timeframes where it matters
- Per-tool style memory; each tool remembers the last colour, width and style you used
- Choose the drawing layer: keep drawings above the price bars, or place them behind the candles for zones and shaded areas. Whatever you choose, the object you are pointing at is always lifted to the front so you can see and grab it
- Price and time tags on the axes for the selected object, with a connector band showing the range it spans
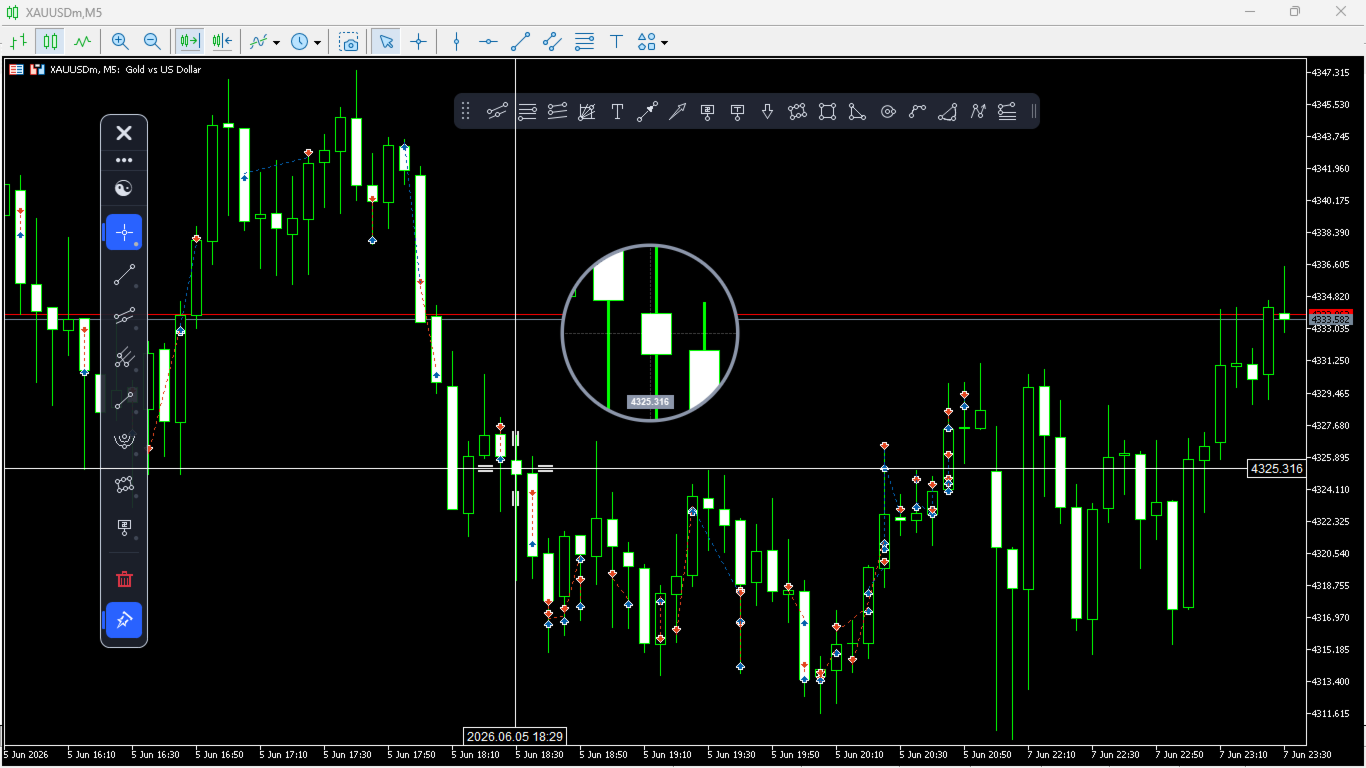
- Precision crosshair with a magnifier lens, and a measure mode that reads price and time distance
- Dark and light themes, plus DPI-aware scaling for high-resolution monitors
- Automatic persistence of every drawing, per symbol
- High-resolution, anti-aliased rendering that stays sharp at any chart scale
Tools
Cursors: Pointer, Crosshair
Lines: Trendline, Horizontal line, Vertical line, Ray, Extended line, Info line, Angle line, Cross line
Channels, pitchforks and Gann: Parallel channel, Regression trend, Standard deviation trend, Andrews pitchfork, Schiff pitchfork, Modified Schiff pitchfork, Gann line, Gann fan, Gann box
Fibonacci: Retracement, Expansion, Channel, Time zones, Speed resistance fan, Speed resistance arcs
Shapes: Rectangle, Rotated rectangle, Triangle, Ellipse, Circle, Arc, Curve, Path
Patterns: Elliott Wave, ABCD, XABCD, Cypher, Head & Shoulders
Annotations: Text, Note, Price note, Callout, Comment, Arrow, Arrow up, Arrow down, Arrow marker
Freehand and position tools: Brush, Highlighter, Eraser, Long position, Short position
How to use
- Attach the toolkit to any chart, on any symbol and timeframe.
- Click a category in the sidebar to open its tools, then select a tool and draw.
- Click any object to edit it in the properties bar, or open the settings window for full control.
- Pin your favorites, switch the theme, and dock the panel where it suits you.
Good to know
Works on all symbols and timeframes. It draws and annotates only and does not place trades.























































Fantastic drawing tools. I use it on mt5 and the risk reward tool mostly but its seamless it makes it so much easier. Keep up the good work.