Smart Turtle Indicator
- 指标
- 版本: 1.0

The Smart Turtle Indicator is an advanced, fully non-repainting trend-following system designed specifically for MetaTrader 5. It is heavily inspired by the legendary "Turtle Traders" strategy developed by Richard Dennis and William Eckhardt, but refined with modern visual enhancements to make trading decisions clearer and more intuitive.
Unlike standard Donchian Channel indicators, the Smart Turtle Indicator uses a dynamic internal logic to track trend shifts (K1 Line) and trailing stops (K2 Line), filtering out market noise and clearly highlighting the most profitable breakout opportunities.
Key Features
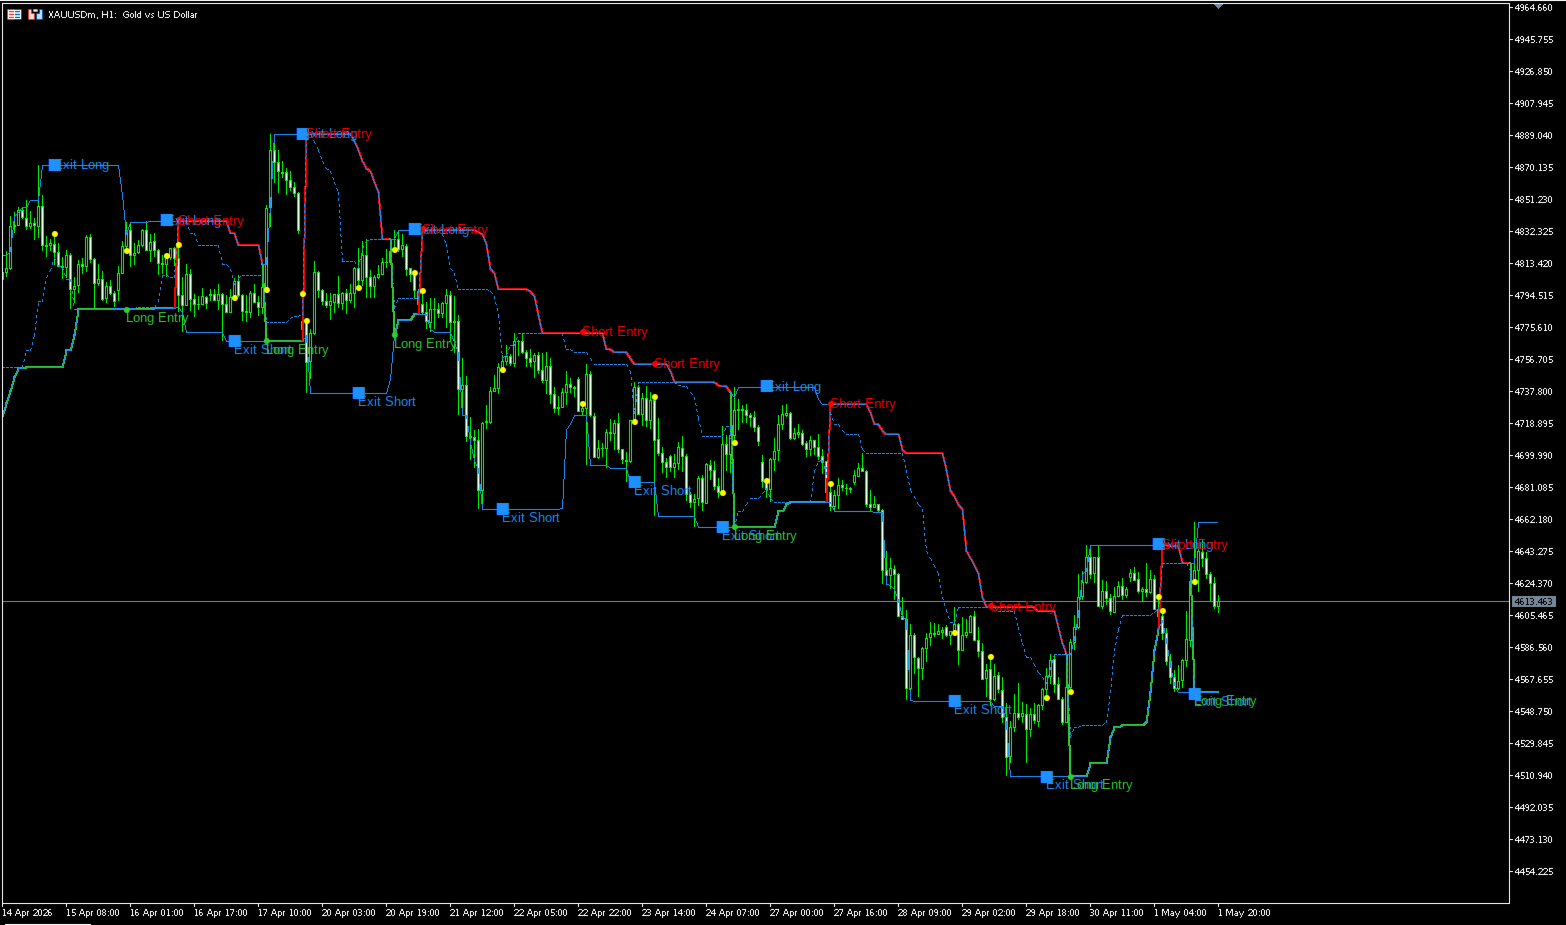
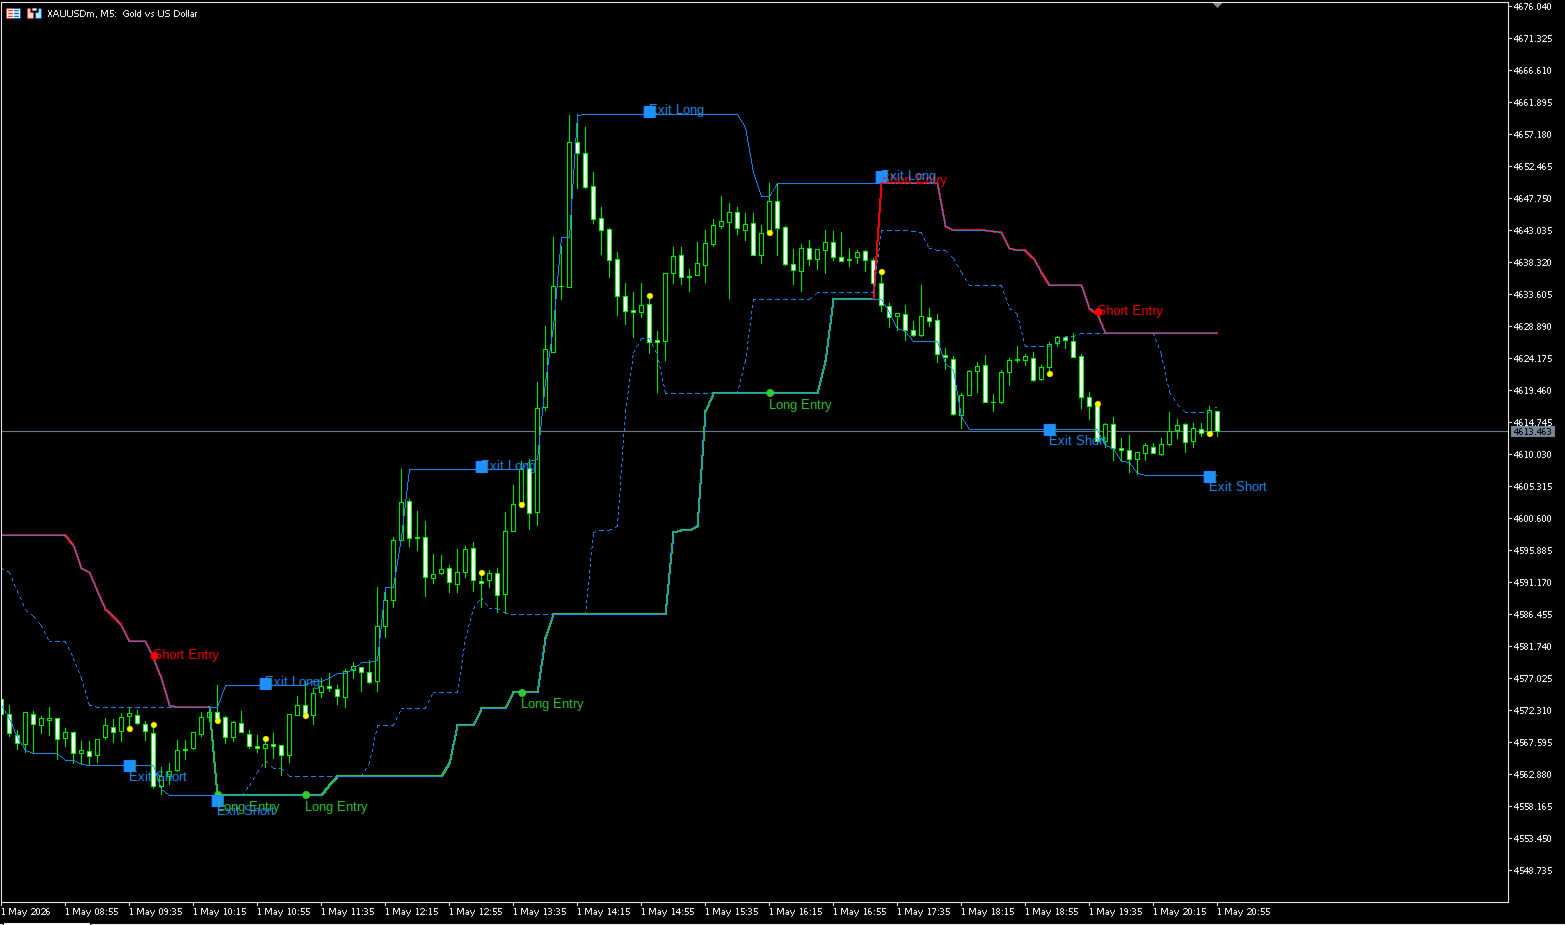
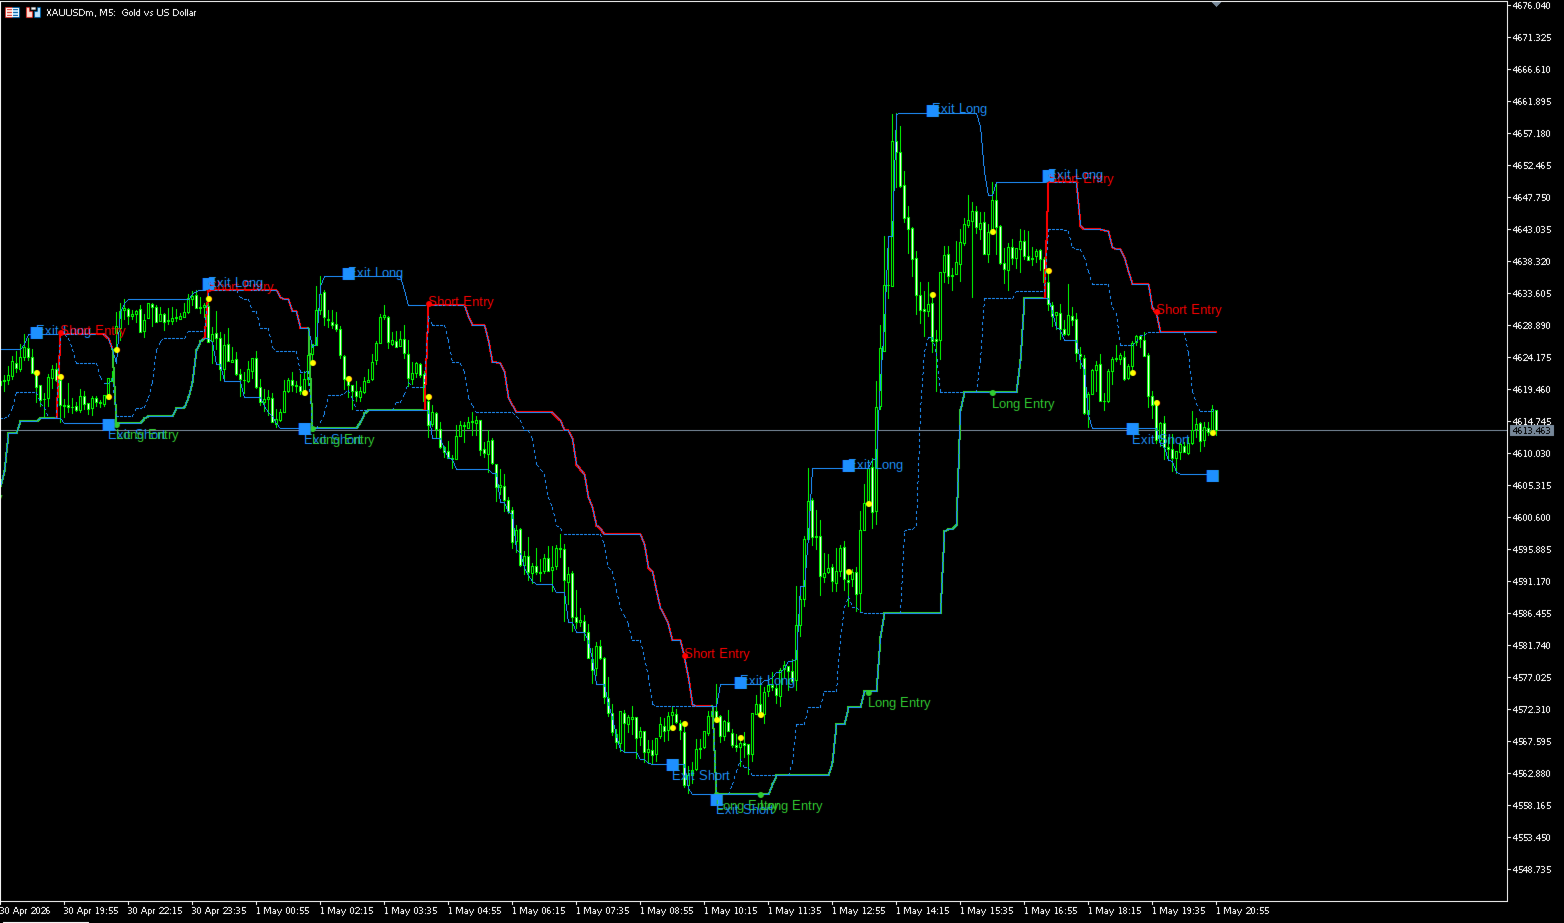
- Fully Non-Repainting: All signals (arrows, dots, and text labels) are strictly calculated on closed bars. Once a signal is printed, it will never repaint or disappear.
- Dynamic Trend Line (K1): A color-coded line (Green for Bullish, Red for Bearish) that automatically snaps to the breakout channel, showing you the exact current trend direction.
- Trailing Exit Line (K2): A dotted blue line acting as a dynamic trailing stop. It helps you ride massive trends while protecting your profits.
- Smart Signal System: Instead of just drawing arrows, the indicator provides clear text labels (Long Entry, Short Entry, Exit Long, Exit Short).
- Vertical Stacking Logic: If multiple signals occur on the exact same candle (e.g., a massive volatility spike), the text labels will neatly stack vertically, ensuring they never overlap or hide each other.
- Candle Signal Dots: A highly visible Yellow Dot is plotted directly on the high/low of the specific candle that triggered the signal, leaving no confusion about where the breakout occurred.
- Dynamic Offset: Text labels automatically scale their distance from the price based on the channel's volatility, ensuring the chart stays clean regardless of the symbol or timeframe.
How to Trade with the Smart Turtle Indicator
This indicator is a complete trading system. You do not need to guess; simply follow the rules.
1. Entering a Trade
- LONG (Buy): Wait for the price to break above the Upper Band. The indicator will plot a Green Arrow, a Yellow Dot on the candle, and the text "Long Entry". The Trend Line will turn Green.
- SHORT (Sell): Wait for the price to break below the Lower Band. The indicator will plot a Red Arrow, a Yellow Dot on the candle, and the text "Short Entry". The Trend Line will turn Red.
2. Exiting a Trade (Taking Profit / Stop Loss)
The system uses the "Exit Line" (Dotted Blue Line) to manage open positions.
- Exit Long: Close your Buy position when the price drops below the Exit Line. The indicator will print an "Exit Long" label.
- Exit Short: Close your Sell position when the price rises above the Exit Line. The indicator will print an "Exit Short" label.
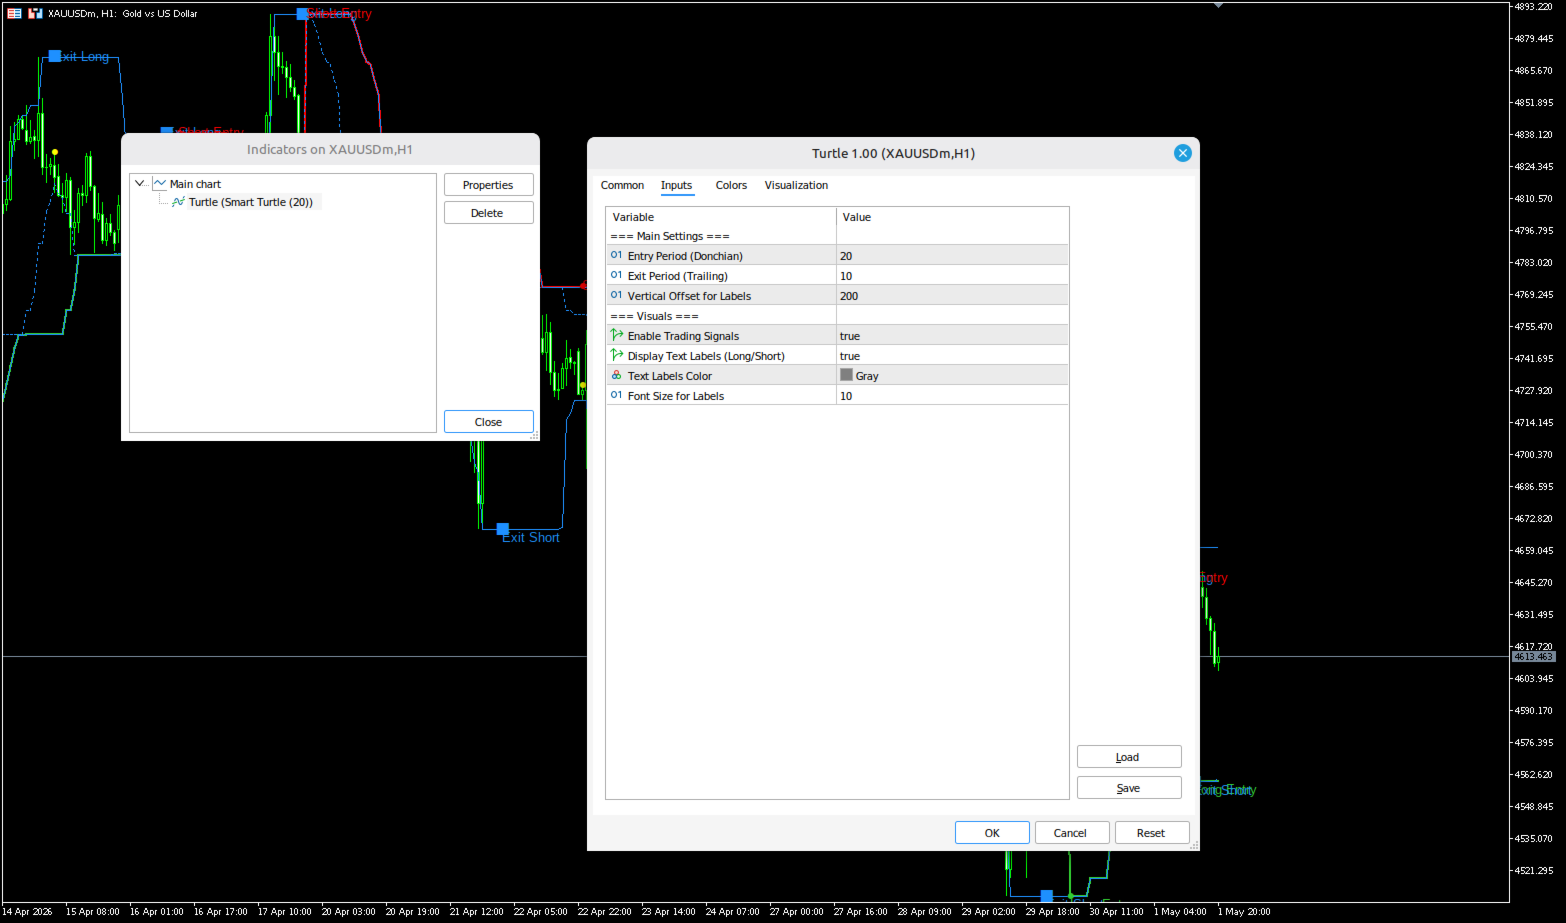
Input Parameters Explained
=== Main Settings ===
- Entry Period (Donchian): (Default: 20) The lookback period used to determine major breakouts. This is the core of the Turtle strategy (20-day high/low breakout).
- Exit Period (Trailing): (Default: 10) The lookback period used for the trailing stop-loss (Exit Line). Usually set to half of the Entry Period.
- Vertical Offset for Labels: (Default: 60) The base distance for text labels from the price. If you set this to 0 , the indicator will use an intelligent auto-scaling offset based on the current chart volatility.
=== Visuals ===
- Enable Trading Signals: Turns all entry/exit arrows on or off.
- Display Text Labels: Turns the "Long Entry" and "Short Entry" text on or off.
- Text Labels Color: Customize the color of the text to match your chart template (Dark/Light).
- Font Size for Labels: Adjust the text size for better readability on high-resolution screens.
Best Practices & Recommendations
- Timeframes: The Turtle strategy was originally designed for daily (D1) charts. However, it performs exceptionally well on H1 and H4 timeframes for swing trading.
- Symbols: Works best on highly trending assets such as Gold (XAUUSD), major Forex pairs (EURUSD, GBPJPY), Indices, and Cryptocurrencies.
- Risk Management: This is a breakout system. Win rates may be average, but the risk-to-reward ratio is huge. Always use proper lot sizing and let your profits run until the Exit signal appears!