Best Wave
- 指标
- 版本: 1.20
- 更新: 18 十一月 2021

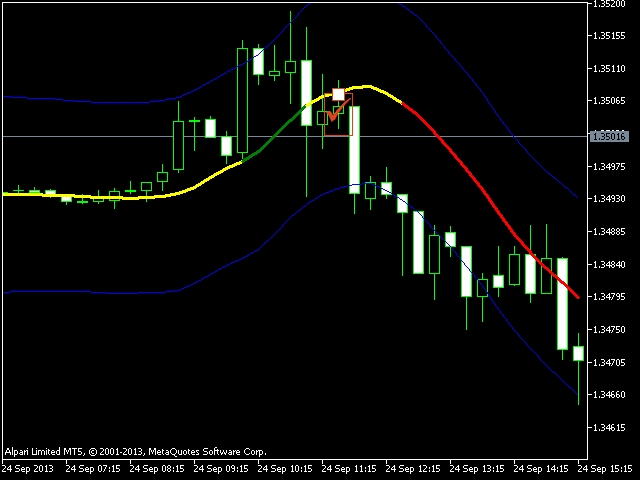
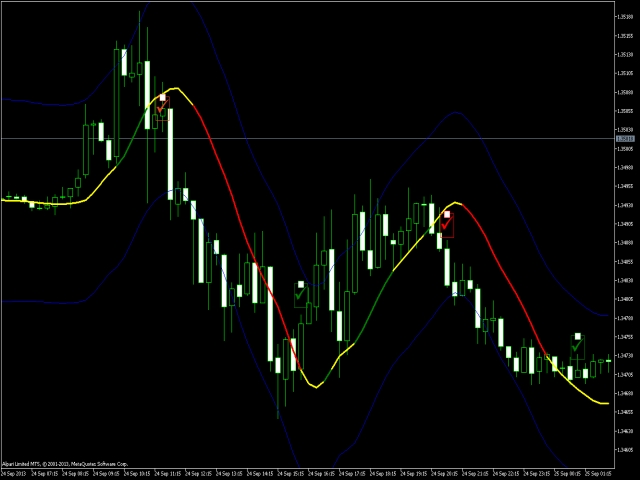
带价格通道的趋势 (盘整) 指标。
交易
- 买 - 价格上穿中线 (蜡烛条收盘于线上) 并且通道处于水平 (黄线) 或检测到上行 (绿线)。当抵达通道的反向边界,移到盈亏平衡点。当卖出条件形成,平仓。
- 卖 - 价格下穿中线 (蜡烛条收盘于线下) 并且通道处于水平 (黄线) 或检测到下行 (红线)。当抵达通道的反向边界,移到盈亏平衡点。当买入条件形成,平仓。
输入参数
- Period - 计算周期, 24 为省缺;
- Display channel - 显示通道, true 为省缺。


ÒTIMO INDICADOR, USAR NA CONTRA-TENDENCIA FAZENDO SCALPER.