TS Super Panel MT5

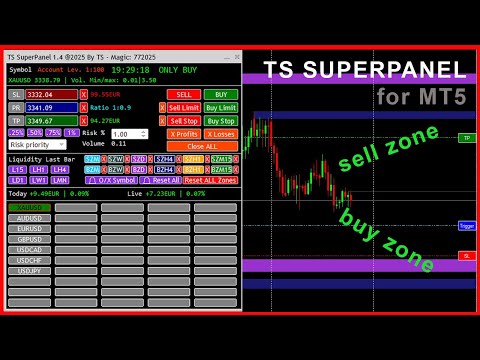
TS Super Panel es una utilidad de trading para dibujar en el gráfico zonas BUY y zonas SELL relevantes. 

NUEVO PRODUCTO. PRECIO ESPECIAL POR TIEMPO LIMITADO

Esta utilidad no se puede probar desde el probador de estrategias. Para descargar una versión DEMO puedes hacerlo desde la entrada del blog: https://www.mql5.com/es/blogs/post/763961

Con TS Super Panel podremos trabajar con hasta 50 símbolos de forma independiente. Conmutar entre un símbolo y otro es realmente rápido. En cada símbolo se podrá dibujar hasta 12 zonas BUY y SELL que resulten relevantes. TS Super Panel dispone de un sistema de alertas para avisar al usuario, cuando el precio entre en alguna de  las zonas definidas.

De forma sencilla podremos fijar sobre el gráfico los precios de StopLoss, TakeProfit y disparo, que luego se utilizarán para poder abrir posiciones BUY y SELL directamente a mercado, o bien a través de órdenes BUY STOP, SELL STOP, BUY LIMIT o SELL LIMIT. Una vez fijados los valores iniciales, dichos valores se podrán modificar directamente en el gráfico mediante el uso del ratón. El tamaño de las posiciones es configurable con un volumen fijo o bien con un porcentaje de riesgo sobre el balance de la cuenta.

  • Multi-Símbolo. Hasta 50 símbolos configurables desde la ventana de parámetros.
  • Hasta 12 zonas relevantes BUY y SELL, en los TimeFrame más habituales: Mensual, Semanal, Diario, H4, H1 y M15.
  • Posibilidad de recibir alarmas PUSH o EMAIL cuando el precio entra en alguna de las zonas definidas.
  • Posibilidad de dibujar zonas o líneas de liquidez (Máximos y mínimos) para las temporalidades más habituales: Mensual, Semanal, Diario, H4, H1 y M15.
  • Botones para apertura de posiciones BUY o SELL a mercado
  • Botones para apertura de órdenes BUY LIMIT, SELL LIMIT, BUY STOP y SELL STOP.
  • Botones para cierre de posiciones abiertas en beneficio, en pédidas o todas las posiciones.
  • Configuración del volumen de una posición de forma fija, o bien por un porcentaje de riesgo sobre el balance de la cuenta.
  • Botones con configuraciones de riesgo pre configuradas: 0.25%, 0.50%, 0.75% y 1.00%.
  • Posibilidad de minimizar y mover la ventana del panel para evitar que tape zonas importantes del gráfico.

MANUAL DE USUARIO

A continuación se detalla como usar las distintas características y funciones de TS SUPER PANEL

    Añadir símbolos al panel.

    Es posible añadir hasta  50 símbolos al panel para poder trabajar con ellos de forma independiente. Para ello abriremos la ventana de parámetros y veremos que están enumerados desde el símbolo 1 al símbolo 50. Debemos añadir aquí, los símbolos deseados. Los símbolos deben estar añadidos previamente a metatrader. Se deben escribir exactamente como aparecen en el broker.

    Una vez se cierra la ventana de parámetros, los símbolos añadidos aparecerán en el panel como un botón. Pulsando en el botón del símbolo deseado, el gráfico cambiará a dicho símbolo.

    Fijar precio del StopLoss

    Para fijar el precio del StopLoss, pulsaremos sobre el botón "SL". El botón cambiará a color "Rojo". En ese momento el sistema queda a la espera de que se haga clic con el ratón sobre el punto del gráfico donde se quiera fijar este nivel de StopLoss. Una vez hecho clic, aparecerá una linea horizontal sobre el punto marcado. A la derecha de la pantalla aparecerá un botón rojo con el texto "SL" sobre la linea dibujada. Si hacemos clic sobre este botón y arrastramos hacia arriba o hacia abajo, podremos ajustar el precio del StopLoss al nivel deseado.

    Fijar precio del TakeProfit

    Para fijar el precio del TakeProfit, pulsaremos sobre el botón "TP". El botón cambiará a color "Verde". En ese momento el sistema queda a la espera de que se haga clic con el ratón sobre el punto del gráfico donde se quiera fijar este nivel de TakeProfit. Una vez hecho clic, aparecerá una linea horizontal sobre el punto marcado. A la derecha de la pantalla aparecerá un botón verde con el texto "TP" sobre la linea dibujada. Si hacemos clic sobre este botón y arrastramos hacia arriba o hacia abajo, podremos ajustar el precio del TakeProfit al nivel deseado.

    Fijar precio de disparo. (Trigger)

    Para fijar el precio Trigger, necesario para las ordenes BuyLimit, SellLimit, BuyStop y SellStop, pulsaremos sobre el botón "PR". El botón cambiará a color "Azul". En ese momento el sistema queda a la espera de que se haga clic con el ratón sobre el punto del gráfico donde se quiera fijar este nivel de Trigger. Una vez hecho clic, aparecerá una linea horizontal sobre el punto marcado. A la derecha de la pantalla aparecerá un botón verde con el texto "Trigger" sobre la linea dibujada. Si hacemos clic sobre este botón y arrastramos hacia arriba o hacia abajo, podremos ajustar el precio del Trigger al nivel deseado.

    El botón "PR", tiene una doble funcionalidad. Si pulsamos sobre él nuevamente, el color pasará a color violeta. En ese momento se está capturando de forma automática el precio actual. Esto será útil, por si abrimos una posición BUY o SELL a mercado, porque en tiempo real se estarán actualizando los valores de perdida y beneficio estimado en función de los niveles de TakeProfit y StopLoss establecidos.

    Fijar el volumen de una posición

    El panel permite establecer el volumen de una posición de forma fija, o bien a través de un porcentaje de riesgo sobre el balance de la cuenta. En el caso de establecer el % de riesgo, podemos hacerlo de forma manual o mediante la ayuda de los botones "0.25%", "0.50%", "0.75%" y "1.00%"que establecerán dichos valores de forma rápida.

    Abrir posiciones a mercado

    Con los botones "SELL" y "BUY" podremos abrir operaciones a mercado, es decir, al precio actual, con los takeprofit y stoploss especificados.

    Abrir ordenes Stop y ordenes Limit.

    Con los botones "SELL LIMIT", "BUY LIMIT", "SELL STOP" y "BUY STOP" se abren las diferentes ordenes con los niveles de takeprofit, stoploss y trigger establecidos. Con la cruz a la izquierda de los botones, se podrá eliminar las ordenes que activas en el sistema.

    Cerrar posiciones abiertas

    Hay 3 botones para cerrar las posiciones abiertas. En este caso, podremos cerrar únicamente las posiciones que se encuentren en beneficio (Botón "X Profits"), únicamente las posiciones que se encuentren en pérdida (Botón "X Losses"), o bien cerrar todas las posiciones (Botón "Close ALL")

    Dibujar líneas o zonas de liquidez.

    Con los botones L15, LH1, LH4, LD1, LW1 y LMN se dibujan las líneas o zonas de liquidez de las temporalidades 15 minutos, 1 hora, 4 horas, 1 día, 1 semana y 1 mes respectivamente. En el caso de representar la liquidez en formato de línea, al pulsar el botón deseado, se dibujará una linea en el máximo y otra linea en el mínimo de la última vela cerrada del gráfico en la temporalidad asociada. En la ventana de parámetros es posible definir los colores de estas dos líneas. También desde la ventana de parámetros se puede definir la visualización como línea o como zona. Para eliminar del gráfico la línea o zona de liquidez dibujada, simplemente hay que pulsar de nuevo sobre el botón asociado, y las líneas desaparecerán del gráfico.

    Dibujar zonas SELL y zonas BUY.

    Muchos traders basan su operativa en analizar los gráficos e identificar zonas relevantes donde el precio podría reaccionar de una forma esperada. TS Super Panel permite dibujar de forma rápida estas zonas importantes sobre el gráfico con los botones disponibles para esta función. Las zonas "SELL-ZONE" serían zonas que se dibujarían en zonas de máximos anteriores del precio y donde el precio podría reaccionar hacia abajo. Por el contrario, las zonas "BUY-ZONE" serían zonas que se dibujarían en zonas de mínimos anteriores del precio, y donde el precio podría reaccionar hacia arriba.

    El dibujo en el gráfico de estas zonas, podremos realizarlas mediante los botones SZM, SZW, SZD, SZH4, SZH1 y SZM15 que se corresponderían con las "SELL-ZONE" de las temporalidades 1 mes, 1 semana, 1 día, 4 horas, 1 hora y 15 minutos. Igualmente disponemos de los botones BZM, BZW, BZD, BZH4, BZH1 y BZM15 que se corresponderían con las "BUY-ZONE" de las temporalidades 1 mes, 1 semana, 1 día, 4 horas, 1 hora y 15 minutos.

    Para dibujar una zona, en primer lugar hay que visualizar el gráfico en la temporalidad deseada. A continuación hay que hacer clic en el botón de zona y temporalidad deseada. El botón se queda destacado, esperando el sistema que se haga clic en algún punto del gráfico para poder dibujar la zona. Se deberá hacer clic ligeramente a la derecha de la mecha de la vela que queramos marcar. Automáticamente aparecerá dibujada la zona. La zona abarcará desde la vela seleccionada, hasta la derecha de la ventana del gráfico. Para eliminar la zona dibujada, se puede hacer clic en el botón "X" que hay a la derecha de cada botón de zona. 

    Hay un botón especial "Reset ALL Zones" que elimina todas las zonas dibujadas en el símbolo activo. En la ventana de parámetros, se pueden definir los colores de cada zona, según las preferencias del usuario.

    Alertas para las zonas "BUY-ZONE" y "SELL-ZONE"

    TS Super Panel dispone de un sistema de alertas para las zonas relevantes que se hayan dibujado en el gráfico. Esta opción se puede activar o desactivar desde la ventana de parámetros. Si tenemos la opción activa, cada vez que el precio entre en una de las zonas dibujadas, se genera una alerta que se enviará por email/push. Además el botón del símbolo en el que se haya generado la alerta, quedará destacado en el panel con un borde de color rojo.

    Con el botón "🔔 O/X Symbol" se resetean las alertas del símbolo actual que se está visualizando en el gráfico. Con el botón "🔔 Reset All" se resetean todas las alertas de todos los símbolos.

    Hay que tener en cuenta que para la correcta recepción de las alertas por email o las notificaciones Push, debe estar correctamente configurados estos parámetros en la configuración de Metatrader 5.


    推荐产品
    Custom Alerts:监控多个市场,绝不错过关键交易信号 概述 Custom Alerts 是一款动态工具,专为希望集中监控多个交易品种潜在机会的交易者设计。通过整合我们旗舰工具(如 FX Power、FX Volume、FX Dynamic、FX Levels 和 IX Power)提供的数据, Custom Alerts 可自动通知您关键的市场变化,无需频繁切换图表,也不会错过交易良机。现在,它支持您的经纪商提供的所有资产类别,只需在设置中选择相应的资产类别即可,无需手动输入任何品种名称。 1. 为什么 Custom Alerts 对交易者非常有帮助 一体化市场监控 • Custom Alerts 收集并整合来自外汇、贵金属、加密货币、指数,甚至(若经纪商支持)股票市场的信号。 • 无需频繁切换图表,一切通知集中呈现。 根据策略定制提醒 • 精准设置提醒条件。无论是追踪成交量激增、强度突破,还是极端价格波动, Custom Alerts 都能确保您不会错过任何关键信号。 • 可与 Stein Investments 工具无缝集成,助您更深入分析与优化交易决策。 节省时
    Trendline Breakout EA
    Paballo Justice Tsoako
    TB EA  – Trendline Breakout Expert Advisor Overview TB EA 1.0 is a professional-grade automated trading system that detects and executes trades based on trendline breakouts using a "body break" confirmation methodology. The EA intelligently distinguishes between support and resistance trendlines, executing BUY orders on resistance breakouts and SELL orders on support breakouts. It works seamlessly on Forex pairs and CFD Indices. Input Parameters Group Parameters Risk Management Fixed Lot Si
    AntiOverfit PRO MT5
    Enrique Enguix
    5 (3)
    Market 中那个正在让你亏钱的隐形错误(甚至很多开发者自己都没有看到) 一个漂亮的回测,可能会让你损失几百甚至几千美元。 大多数交易者在开出第一笔真实仓位之前就已经亏钱了:他们是在仅凭一条绿色收益曲线购买 EA 的那一刻亏掉这些钱的。 公平地说,Market 上的大多数开发者并不是故意想欺骗你。他们花了几个月时间去编写一个系统,在策略测试器里看到一条完美的盈利曲线,于是真心相信自己创造了一件杰作。 但他们其实正被自己的工具所误导。 当他们把系统优化到与唯一真实发生过的那段历史严丝合缝时,他们就在不知不觉中落入了过度优化的陷阱。传统回测是不够的。它呈现给你的只是一个幻象。即使 EA 的作者本身没有恶意,对你的交易账户来说结果也可能一样: 一旦市场条件发生变化,系统恶化的概率会大幅上升 。 如果你不自己去验证这一点,那你很可能是在盲目购买一个只靠历史偶然性存活下来的 EA。 越来越多的交易者 已经不再这样评估系统。他们知道,单一的历史路径根本说明不了什么。真正的问题不是这个系统是否在一个完美场景里赚过钱;真正的问题是,它能否在真实世界中存活下来。 现在,终于有一种方法可以看穿
    MOST IMPORTANT INFORMATION <1> Exactly this program was used to set World Record in Trading 2020 Account Equity was increased from $1,000,000 to $100,000,000 in 16 days Details => www.mql5.com/en/users/AIS <2> In the last days of this record the position was creating by 1000-2000 orders It was used the computer with 1 core Pentium 4 CPU at 2.8 GHz and 1 GB memory In the last two days the daily profit was $40,000,000 every day <3> It was 100% manual trading And this special program was used to s
    This indicator is based on a mathematical formula which gives you the possibility to seek and find the right frequency of the movement, and to determine its key level; just adjust the frequency parameter! Simple and highly effective; using this indicator you can easily predict the next support and  resistance    levels of the day. Also, this indicator determines the range and the next two importants levels of the movement outside this range so far. SGFL3 and RGFL3  are levels with high certainty
    BOT NOTIF - 6 - DUAL MODE - BB is a Notifier-type Expert Advisor (EA) specifically designed to monitor market saturation points (Overbought/Oversold) with high accuracy through a three-layer filter: RSI, Wick Validation (Candle Tail), and Bollinger Bands. This bot does not execute automated trades (Auto-Trade); instead, it acts as a smart assistant that sends visual signals and comprehensive Telegram notifications, including real-time chart screenshots. It is ideal for traders seeking price reve
    RSIScalperPro
    PATRICK WENNING
    介绍 RSIScalperPro - 这款基于 RSI 指标的革命性交易指标适用于 MetaTrader 5,专为一分钟图表的剖刺交易而设计。借助 RSIScalperPro,您将拥有一个强大的工具箱,用于精确的入场和出场信号,提升您的交易水平。 RSIScalperPro 使用两种不同的 RSI 指标,为超买和超卖区域提供清晰的信号。您可以根据自己的偏好自定义两个 RSI 的时间周期和限制值,以实现您的交易策略的最佳效果。图表上的明显箭头使您可以轻松识别何时进入或退出交易。 RSIScalperPro 的另一个亮点是三个可自定义的移动平均线,帮助您识别趋势方向并确认强大的交易信号。这使您可以早早发现趋势并参与到盈利交易中。 此外,您可以设置 RSIScalperPro 发出每个新交易信号的听觉警报。这样,即使您不经常坐在计算机屏幕前,也不会错过任何重要的交易机会。 RSIScalperPro 提供用户友好的界面,并且在 MetaTrader 5 中很容易插入和配置。您可以根据个人交易偏好自定义指标,并利用其多样化的功能,提高交易成果。 利用 RSIScalperPro 的优势,提高
    Seasonal Pattern Trader
    Dominik Patrick Doser
    Disclaimer : Keep in mind that seasonal patterns are not always reliable. Therefore, thoughtful risk management is crucial to minimize losses.  Seasonal patterns in the financial world are like a well-guarded secret that successful investors use to their advantage. These patterns are recurring price movements that occur during specific periods or around special events. Additionally, there are also intraday patterns that repeat. For example, Uncle Ted from Forex Family suggests examining previou
    VIDYA Enhanced
    David Ben Svaiter
    The VIDYA-ENHANCED indicator (Variable Index Dynamic Average) is a technical analysis tool used to identify trends and sideways movements. It dynamically adjusts its sensitivity based on market volatility, using the Chande Momentum Oscillator as a volatility index. This feature allows VIDYA-ENHANCED to be more agile during periods of significant price movements, while remaining more stable during less volatile phases.  Features: - Select the price from 12 options - 5 more than the Metatrader
    Chart Walker Analysis Engine
    Dushshantha Rajkumar Jayaraman
    Chart Walker X Engine | Machine-led instincts Powerful MT5 chart analysis engine equipped with a sophisticated neural network algorithm. This cutting-edge technology enables traders to perform comprehensive chart analysis effortlessly on any financial chart. With its advanced capabilities, Chart Walker streamlines the trading process by providing highly accurate trading entries based on the neural network's insights. Its high-speed calculations ensure swift and efficient analysis, empowering tra
    Special
    Ivan Simonika
    The indicator monitors the market trend, ignoring sharp fluctuations in the market and noise around the average price. Shows points for entering the market, points of potential market reversal. The indicator implements a kind of technical analysis based on the idea that the market is cyclical in nature. The indicator can be used both for pipsing on small periods, and for long-term trading.
    Linear Trend Predictor — 结合切入点和方向支撑线的趋势指标。按照突破高/低价通道的原理运作。该指标算法过滤市场噪音,考虑波动性和市场动态。 指示器功能  使用平滑方法,显示市场趋势和开立买入或卖出订单的切入点。  适合通过分析任何时间范围内的图表来确定短期和长期的市场走势。  输入参数可适应任何市场和时间范围,允许交易者独立定制指标。  设定的指示信号不会消失,也不会重新绘制——它是在蜡烛收盘时确定的。  几种类型的通知以箭头组合。  该指标既可以作为独立的交易系统使用,也可以作为其他交易系统的补充。  可供任何经验水平的交易者使用。 主要参数 Volatility Smoothing Level - 指标的主要参数,允许您配置指标以实现舒适的操作。 它的数字范围是 1 到 100,从而增加了您可以获得更长趋势运动的平滑度。 通过少量的数字,您可以获得短期走势并快速退出交易。 使用指标进行交易的时刻:  红线和箭头表示下降趋势和卖出开盘信号。止损应根据前一个上分形来设置。  黄线和箭头表示上升趋势和买入开盘信号。止损应根据前一个下分形来设置。
    Chart Navigator Pro
    ELITE FOREX TRADERS LLC
    Introducing the   Elite Chart Navigator   — your ultimate MetaTrader 5 Expert Advisor designed to revolutionize multi-symbol trading with seamless chart navigation and superior usability. Product Overview The   Elite Chart Navigator EA   is a sophisticated trading utility enabling rapid switching between multiple trading pairs through an intuitive on-chart button interface. Built for professional traders managing numerous instruments, this EA dramatically improves workflow efficiency, ensuring
    Premium Risk is an intelligent risk-management and trade-execution tool designed especially for scalpers. It automatically calculates your risk-reward ratio (R:R) and capital-based risk amount , helping you determine accurate lot size and position volume. With the POS module , you can automatically monitor and manage your trades. The magnet feature detects current market price instantly, allowing fast and precise order execution. In short, Premium Risk is a professional, risk-focused trading ass
    Glider
    Vitalii Zakharuk
    The Glider indicator gives accurate and timely signals to enter and exit the transaction that appear on the current candle. Using the indicator is very simple. When a dot and a blue line appear, open a buy deal. When a dot and a red line appear, open a sell deal. The main purpose of this indicator is to determine the moments of entry and exit from transactions, therefore the Glider indicator will display only the trend line and entry points, i.e. displays displays the entry points to the marke
    Expert Market Edge
    SASA MIJIN
    5 (7)
    Expert Market Edge is scalping, trending, reversal indicator, with alerts . You can use it all and fit with your strategy whatever it fits you. My recommendation is to combine with my Colored RSI , and when 2 signals are matched, and pointing same direction (for example buy on this indicator, and green on RSI, you can take a long position, stop loss should be last local low, if you want to be more conservative, add ATR. ) you can take position. If you using moving averages, that's even better i
    aka 20pips challenge but dynamic. Precision meets performance. Pips Velocity  is an semi-automated trading system designed to exploit . By measuring the "velocity" of price action relative to a moving average, the EA identifies high-probability entry points for quick pip captures . Logic:  Manually Enters trades when the price reaches a specific point aording to your strategy. Dual-Directional Strategy: Easily switch between Buy and Sell signals based on price positioning relative to the trend .
    Divergent Stochastic Filter II Catch Reversals Early, Filter Noise, Trade with Confidence The Edge: Why This Stochastic is Different  Every trader knows the Stochastic oscillator. But knowing when to trust its signals, that's the real challenge. The Divergent Stochastic Filter II transforms this classic indicator into a precision reversal detection system by adding critical elements: divergence intelligence, signal filtering and exhaustion detection.  While standard Stochastic oscillators fire s
    Chat Ai MT5
    Indra Maulana
    3 (2)
    Friends, this tool does not work in backtesting and you must run it live. Chat Ai assistant a versatile and intelligent AI assistant Talk to the AI, get advice from it, give it orders Can be used in all charts, time frames, symbols, markets and... With a very simple interface This tool is an artificial intelligence assistant that you can chat with. You can give him different commands. for example: Tell him to open a buy order for you. Or tell him to close your sales deals Or tell it to change
    ️ KP Stability Engine – Professional Risk Infrastructure for MT5 KP Stability Engine is not a trading robot. It is a professional-grade account protection and risk control engine. Designed for traders and developers running one or multiple Expert Advisors, KP Stability Engine acts as a central risk governor that continuously monitors your account and dynamically limits exposure, drawdown, and floating losses in real time. It publishes live risk permissions using MT5 Global Variables, allowing
    这个多时间框架和多符号供需区仪表板指示器在价格达到供需区时发送警报。也可以使用它来提醒常规的双顶/双底而不是区域。它可以用于从 M1 到 MN 的所有时间范围。     仪表板中最多可同时显示 9 个时间范围。 可以使用 RSI、背离(MACD、RSI 或 Awesome)和蜡烛图过滤器(pin bar、吞没、镊子和晨星/夜星)来仅过滤掉最强的设置。结合您自己的规则和技术,该指标将允许您创建(或增强)您自己的强大系统。 在产品博客 的末尾,您将能够下载示例智能交易系统 (EA) 的源代码,该示例使用 iCustom() 函数从指标获取交易信号。尽管 EA 功能齐全,但主要目的是使用代码并将其粘贴到您自己开发的 EA 中或将您自己的额外进入/退出逻辑添加到此 EA 中。鉴于我的时间有限,我将无法提供任何编程支持。我很抱歉。 特征 这 足以放置一个指标图表上,你会出现在仪表板的任何新的信号接收警报。支持所有 Metatrader 本地警报类型。 在仪表板内持续执行排名排序。可以禁用此排序,以便更轻松地找到特定符号。然后,交易品种将按照它们在交易品种参数中输入的相同顺序显示,或者按照它们在
    The utility is designed to display on the chart the margin zones built on the basis of margin requirements for futures of the Chicago Mercantile exchange (CME). These margin zones are good levels of resistance and support, as seen in the screenshots. How to use To trade on margin zones, use the following rules: buy after the day has closed above one of the zones to the next zone; sell after the day has closed below one of the zones to the next zone; after opening a sell trade, place limit sell
    HalfTrend trendline with ATR pullback zones — built for trend traders. Spot the trend direction instantly, use ATR bands to judge “normal” pullbacks vs extended moves, and get alerts on trend flips and optional trendline touches .  HalfTrend ATR Bands & Alerts (MT5) is a trend-following indicator that plots a clean HalfTrend trendline together with ATR-based bands/zones . It provides trend change arrows , optional touch alerts (price touches the trendline), and EA/iCustom signal buffers for au
    FREE
    Automated Supply and Demand Tracker MT5. The following videos demonstrate how we use the system for trade setups and analysis.US PPI, Fed Interest Rates, and FOMC Trade Setup Time Lapse: U.S. dollar(DXY) and Australian dollar vs U.S. dollar(AUD/USD)  https://youtu.be/XVJqdEWfv6s  The EUR/USD Trade Setup time lapse 8/6/23.  https://youtu.be/UDrBAbOqkMY . US 500 Cash Trade Setup time lapse 8/6/23  https://youtu.be/jpQ6h9qjVcU .  https://youtu.be/JJanqcNzLGM ,  https://youtu.be/MnuStQGjMyg,&nbsp ;
    Just $10 for six months!!!. This will draw Order Blocks just by clicking on a candle. It will use the body or the wicks. It can also draw the mean threshold of the candle open/close or high/low. As a drawing tool, it is not active all the time after adding it to the chart. Activate by pressing 'b' twice on the keyboard within a second. If activated but then decided not to draw, deactivate by pressing 'b' once.  Box color depends if candle is above or below current price. Settings/Inputs: Number
    DrawTrade MT5
    Benjamin Daniel Suarez Luque
    Enhance Your Manual Trading Workflow in MetaTrader DrawTrade is a total reimagining of how you interact with MetaTrader by introducing a flexible and intuitive interface designed specifically for manual traders. It enhances chart navigation, improves drawing responsiveness, and streamlines trade execution — all with tools that feel natural to use and quick to master.   Core Navigation Improvements Mouse Flick Navigation Quickly pan across charts with a flick of the mouse, improving chart expl
    本指标是实践实战交易完善的波浪自动分析的指标 !  案例... 注: 波浪分级用西方叫法不习惯,因受到缠论(缠中说禅)命名方式习惯的影响,我是将基础波浪命名为 笔 ,将二级波段命名为 段 ,同时具有趋势方向的段命名为 主趋段 (以后笔记中都是这种命名方式,先告知大家),但是算法上和缠论关系不大切勿混淆.反映的是本人分析盘面总结的 千变万化纷繁复杂的运行规律 . 对波段进行了标准化定义,不再是不同人不同的浪  ,   对人为干扰的画法进行了排除,在严格分析进场起到了关键的作用 . 使用这个指标,等于将交易界面提升美感,抛弃最原始的K线交易带你进入新的交易层次.如果不是为了交易,在宣传上也将使客户观感提升层次. 指标内容: 1.   基础波浪 (笔) : 首先我们找出了价格波动过程中的基础波动拐点,当然他的有序性低,为下一步的计算提供基础. 2.   二级波段( 段 ) :在基础波浪的基础上,通过算法分析得到层级更明显的二级波段,二级波段为波浪提供了分析基础 3.   波浪( 浪 ): 有着更清晰的趋势,更清晰直观的方向.分析一个波浪是否延续,需要看二级波段的形态,分析二级的构成,
    GRID for MT5
    Volodymyr Hrybachov
    GRID for MT5 是一種方便的工具,適用於那些使用訂單網格進行交易的人,專為在外匯金融市場上進行快速而舒適的交易而設計。 MT5 的 GRID 有一個可定制的面板,其中包含所有必要的參數。適合有經驗的交易者和初學者。與任何經紀商合作,包括有 FIFO 要求的美國經紀商 - 首先,關閉之前打開的交易。訂單網格可以是固定的——訂單以固定的步長開倉,或者有動態的開倉水平——以更好的價格開倉,它只適用於市價單。 GRID for MT5 交易面板具備開倉、平倉和追踪訂單功能。訂單由一籃子關閉,可以是單向 - 僅買入或賣出,或雙向買入和賣出。要平倉,可以使用止損、止盈、盈虧平衡和追踪止損功能。止損和止盈可以設置為餘額的百分比。具有最短持倉時間和新訂單開倉最小間隔(秒)功能。 MT4 版本: https://www.mql5.com/en/market/product/46234 選項: MULTIDIRECTIONAL_MODE - 同時關閉雙向訂單,如果為 true - 關閉一籃子訂單,如果為 false - 買入和賣出訂單分別關閉; MIN_HOLDING_SEC - 最小持
    Didi Index
    Flavio Javier Jarabeck
    4.8 (25)
    The famous brazilian trader and analyst Didi Aguiar created years ago a study with the crossing of 3 Simple Moving Averages called "Agulhada do Didi", then later was also named Didi Index, as a separate indicator. The period of those SMAs are 3, 8 and 20. As simple as that, this approach and vision bring an easy analysis of market momentum and trend reversal to those traders looking for objective (and visual) information on their charts. Of course, as always, no indicator alone could be used wit
    FREE
    If you are unsure how to use this indicator, please feel free to reach out to me. I will explain it to you and provide reading materials to help you make the most of it. TD Sequential Scanner: An Overview The TD Sequential scanner is a powerful technical analysis tool designed to identify potential price exhaustion points and trend reversals in financial markets. Developed by Tom DeMark, this method is widely used by traders to gauge market cycles and potential turning points with precision. Ho
    该产品的买家也购买
    Trade Assistant MT5
    Evgeniy Kravchenko
    4.42 (207)
    它有助于计算每笔交易的风险,容易安装新的订单,具有部分关闭功能的订单管理, 7 种类型的追踪止损和其他有用的功能。   附加材料和说明 安装说明   -   应用程序说明   -   模拟账户应用程序的试用版 线条功能  - 在图表上显示开仓线、止损线、止盈线。 有了这个功能,就可以很容易地设置一个新的订单,并在开仓前看到它的附加特性。   风险管理  - 风险计算功能在考虑到设定的风险和止损单的大小的情况下,计算新订单的成交量。它允许你设置任何大小的止损,同时观察设定的风险。 批量计算按钮 - 启用 / 禁用风险计算。 在 " 风险 " 一栏中设置必要的风险值,从 0 到 100 的百分比或存款的货币。 在 " 设置 " 选项卡上选择风险计算的变量: $ 货币, % 余额, % 资产, % 自由保证金, % 自定义, %AB 前一天, %AB 前一周, %AB 前一个月。   R/TP 和 R/SL - 设置止盈和止损的关系。 这允许你设置相对于损失的利润大小。 例如, 1 : 1 - 这决定了 TP = SL 的大小。 2 : 1 - 这意味着 TP 是 SL 的两倍。 RR -
    欢迎来到 Trade Manager EA——这是一个终极风险管理工具,旨在使交易变得更直观、精准和高效。它不仅仅是一个下单工具,而是一个用于无缝交易计划、仓位管理和风险控制的全面解决方案。不论您是新手交易员、资深交易员,还是需要快速执行的剥头皮交易员,Trade Manager EA 都可以满足您的需求,适用于外汇、指数、大宗商品、加密货币等各种市场。 借助 Trade Manager EA,复杂的计算已成过去。只需分析市场,在图表上用水平线标记入场、止损和止盈,设置您的风险水平,Trade Manager 就会立即计算出理想的头寸规模,并实时显示以点、账户货币计价的止损和止盈。每笔交易都得以轻松管理。 主要功能: 头寸规模计算器 :根据定义的风险瞬间确定交易规模。 简单的交易计划 :在图表上用可拖动的水平线直接计划交易,设置入场、止损和止盈。 实时显示 SL 和 TP :以账户货币、点或分显示止损和止盈,便于分析。 高级保护工具 盈亏平衡选项 : 基本盈亏平衡 :当您的交易达到设定水平时自动保护利润。 多级盈亏平衡 :设置多达 4 个级别以逐步保护利润。 尾随止损选项 : 基本尾随
    Local Trade Copier EA MT5
    Juvenille Emperor Limited
    4.96 (133)
    通过 Local Trade Copier EA MT5 获得非常快速的交易复制体验。它的简单1分钟设置,使您可以在同一台Windows计算机或Windows VPS上在多个MetaTrader终端之间复制交易,具有闪电般快速的复制速度,低于0.5秒。 无论您是初学者还是专业交易者, Local Trade Copier EA MT5 都提供了广泛的选项,可根据您的特定需求进行自定义。对于任何希望增加利润潜力的人来说,这都是终极解决方案。 今天就尝试一下,看看为什么它是市场上最快、最简单的贸易复印机! 提示: 您可以在您的模拟账户中下载并试用 Local Trade Copier EA MT5 模拟版: 这里 将下载的免费演示文件粘贴到您的 MT5 >> 文件 >> 打开数据文件夹 >> MQL5 >> 专家文件夹并重新启动您的终端。  免费演示版本每次可在 4 小时内发挥全部功能,仅限演示帐户。 要重置试用期,请转至 MT5 >> 工具 >> 全局变量 >> Control + A >> 删除。 请仅在非关键模拟账户上执行此操作,不要在挑战道具公司账户中执行此操作。 如果您无法
    TradePanel MT5
    Alfiya Fazylova
    4.87 (149)
    交易面板是一款多功能交易助手。该应用包含超过50种手动交易功能,并允许您自动执行大多数交易任务。 在购买之前,您可以在演示账户上测试演示版本。下载用于演示账户的试用版应用程序: https://www.mql5.com/zh/blogs/post/762579 。 完整说明 这里 。 贸易. 只需单击一下即可执行交易操作: 打開掛單和頭寸,並自動計算風險。 一鍵打開多個訂單和頭寸。 打開訂單網格。 按組別關閉掛單和頭寸。 反轉頭寸方向(關閉買入>打開賣出,關閉賣出>打開買入)。 鎖定頭寸(通過開啟缺少的頭寸,使買入和賣出頭寸的數量相等)。 一鍵部分關閉所有頭寸。 將所有頭寸的止盈和止損設置在同一價格水平。 將所有頭寸的止損設置在盈虧平衡水平。 開倉時,可使用以下功能: 在多個訂單或倉位之間分配計算出的數量(在單擊一次時開啟多個訂單和倉位)。 在開啟訂單前在圖表上可視化交易水平。 僅在當前點差不超過設定值時才開啟倉位。 止盈和止損之間的自動比例。 虛擬止損和止盈。 自動將止損和止盈的大小增加為當前點差的大小。 基於ATR指標讀數計算止盈和止損。 設置掛單的到期日期。 為掛單設置追蹤(掛單
    测试版发布 Telegram to MT5 Signal Trader 即将进入正式的 Alpha 版本。一些功能仍在开发中,您可能会遇到一些小错误。如果您遇到问题,请反馈,您的意见将帮助我们改进软件。 Telegram to MT5 Signal Trader 是一款强大的工具,能够将 Telegram 频道或群组的交易信号自动复制到您的 MetaTrader 5 账户。 支持公开和私人频道,可将多个信号提供者连接至一个或多个 MT5 账户。软件优化、高效、稳定,精准控制每笔复制交易。 界面简洁,仪表盘美观,图表交互性佳,导航直观。您可以管理多个信号账户,自定义每个提供者的设置,并实时监控所有操作。 系统需求 由于 MQL 限制,EA 需要配合 PC 端应用与 Telegram 通信。 安装程序可通过官方 安装指南 获取。 核心功能 多提供者支持: 从多渠道复制信号至多个 MT5 帐户 高级信号识别: 关键词、模式和标签全面自定义 逐提供者控制: 可启用/禁用特定信号类型、平仓策略等 灵活风险管理: 固定手数、固定金额、余额/权益百分比、部分平仓设置 可定制 SL/TP: 覆盖信号
    Trade Dashboard MT5
    Fatemeh Ameri
    4.94 (120)
    疲于复杂的订单下达和手动计算?Trade Dashboard 是您的解决方案。凭借其用户友好的界面,订单下达变得轻而易举,只需点击一下,您就可以开设交易、设置止损和止盈水平、管理交易手数,并计算风险回报比,让您只需专注于您的策略。告别手动计算,使用 Trade Dashboard 简化您的交易体验。 立即下载演示版本 。 您可以在这里找到仪表盘功能和特性的详细信息 。 加入 Telegram 频道 。 购买后请给我发消息以获取支持。如果您需要添加更多功能,可以在产品的评论区留下您的想法,我愿意听取任何建议,希望您能在使用我的产品时获得最佳体验 。 这是 MT4 版本。 风险管理:使用 Trade Dashboard,可以将您的风险设置为账户余额或权益的百分比,或将风险设置为总金额。在图表上直观地定义您的止损,让工具准确计算每个货币对的适当手数。该工具还可以根据您期望的风险回报比自动设置止盈水平。它甚至可以在手数计算中涵盖佣金和点差费用。此外,您的止损和止盈可以转变为虚拟水平,隐藏于经纪商。通过 Trade Dashboard 的高级风险管理功能,掌控风险,保护您的资本。 交易线
    HINN Lazy Trader
    ALGOFLOW OÜ
    5 (2)
    The core idea: using the user interface, you configure the parameters the chart must meet before entering a position (or positions), choose which entry models to use, and set the rules for when trading and planning should end. Lazy Trader  handles the rest: it  takes over all the routine chart watching and execution! full description  :: 3 key videos [1] ->  [2]   ->  [3] What can it do? - Understands Larry Williams market structure - Understands swing market structure by Michael Huddleston
    MT5 to Telegram Signal Provider 是一个易于使用且完全可自定义的工具,它允许向 Telegram 的聊天室、频道或群组发送 指定 的信号,将您的账户变为一个 信号提供商 。 与大多数竞争产品不同,它不使用 DLL 导入。 [ 演示 ] [ 手册 ] [ MT4 版本 ] [ Discord 版本 ] [ Telegram 频道 ]  New: [ Telegram To MT5 ] 设置 提供了逐步的 用户指南 。 不需要了解 Telegram API;开发者提供了您所需的一切。 关键特性 能够自定义发送给订阅者的订单详情 您可以创建分层的订阅模型,例如铜、银、金。其中金订阅获得所有信号等。 通过 id、符号或评论过滤订单 包括执行订单的图表截图 在发送的截图上绘制已关闭的订单,以便额外核实 延迟发送新订单消息的可能性,以便在发送前对位置进行调整 订单详情完全透明: 新的市场订单*带截图 订单修改(止损、获利) 已关闭的订单*带截图 部分关闭的订单** 新的挂单 修改的挂单(进场价格) 挂单激活(作为新的市场订单附加) 已删除的挂单 历史订单报告
    Exp COPYLOT CLIENT for MT5
    Vladislav Andruschenko
    3.82 (34)
    MT5 交易复印机是 МetaТrader 5 平台的交易复印机 。 它复制外汇交易 之间   任何账户 MT5   -   MT5, MT4   -   MT5 对于 COPYLOT MT5 版本(或 MT4   - MT4 MT5   -   MT4 对于 COPYLOT MT4 版本) 值得信赖的复印机! MT4版本 详细描述   +DEMO +PDF 如何购买 如何安装     如何获取日志文件     如何测试和优化     Expforex 的所有产品 您还可以在 МТ4 终端 (   МТ4   -   МТ4, МТ5   -   МТ4   ) 中 复制交易: COPYLOT CLIENT for MT4 此版本包括在终端 МТ5   -   МТ5, МТ4   -   МТ5 之间 。 交易复制器用于在 2/3/10 终端之间复制交易/头寸。 支持从模拟账户和投资账户复制。 该程序可以在多个终端绑定上运行。 使用它作为您在一个账户上交易的各种投资者账户的交易的同步器, - COPYLOT 会将您的交易复制到其他终端。 从 多个 终端复制到一个; 从一个终端复
    VERIFIED TRADING RESULTS - Farmed Hedge Yield Axi Copy:  https://www.mql5.com/en/signals/2356376 - Farmed Hedge Yield Exn Copy:   https://www.mql5.com/en/signals/2356404 - Farmed Hedge Yield V Copy:  https://www.mql5.com/en/signals/2357156 Contact me via private message to receive the User Manual and Setup. * Thai Lauguage Support Available Farmed Hedge Yield Farming - Professional Pair Trading Dashboard (Manual - Hybrid - Semi/Automated EA) VERSION 3 - WILD HARVEST UPDATE Trading Approac
    Copy Cat More Trade Copier MT5 (复制猫MT5) 是一个本地跟单软件,也是一个完整的风险管理和执行框架,专为当今的交易挑战而设计。从资金管理公司挑战到个人投资组合管理,它能适应各种情况,结合了稳健的执行、资本保护、灵活配置和高级交易处理功能。 该跟单软件可在主端(发送方)和从端(接收方)模式下工作,实时同步市价单和挂单、交易修改、部分平仓和对冲平仓操作。它兼容模拟和实盘账户、交易或投资者登录,并通过持久的交易记忆系统确保恢复功能,即使EA、终端或VPS重启也不例外。可以同时管理多个主端和从端,使用唯一ID,并通过前缀/后缀调整或自定义品种映射自动处理跨经纪商差异。 手册/设置  | Copy Cat More MT4 | 频道  特色功能: 易于设置——快至30秒(见视频)。 快速、稳定、准确——Turbo模式下低延迟复制(见截图)。 高安全性——不使用潜在危险的DLL或WebRequest。 持久交易记忆,避免孤立、丢失或不准确的交易。 可从手动或EA复制,支持所有账户类型。 品种自动前缀/后缀,快速设置;支持MT4和MT5之间复制。 非常灵活的多主端
    Timeless Charts
    Samuel Manoel De Souza
    5 (3)
    Timeless Charts is an advanced charting solution designed for professional traders seeking for custom charts / custom timeframes , including seconds charts / seconds timeframe, renko charts / renko bars, cluster charts / footprint charts and advanced tools present in most of the popular platforms. Unlike traditional offline charts or simplistic custom indicators, this solution constructs fully custom bars with true timestamp accuracy , down to miliseconds, allowing for a powerful and precise tr
    HINN MagicEntry Extra
    ALGOFLOW OÜ
    4.71 (14)
    HINN MAGIC ENTRY – the ultimate tool for entry and position management! Place orders by selecting a level directly on the chart! full description   ::  demo-version  :: 60-sec-video-description Key features: - Market, limit, and pending orders - Automatic lot size calculation - Automatic spread and commission accounting - Unlimited partitial take-profits  - Breakeven and trailing stop-loss and take-profit  functions - Invalidation leves - Intuitive, adaptive, and customizable interface - Works
    交易面板一键交易。 处理仓位和订单! 通过 图表 或 键盘 进行交易 。 使用我们的交易面板,您只需单击一下即可直接从图表中执行交易,执行交易操作的速度比使用标准 MetaTrader 控件快 30 倍。 参数和函数的自动计算使交易者的交易更加快捷、方便。 图形提示、信息标签和有关贸易交易的完整信息均位于图表 MetaTrader 上。 MT4版本 详细描述   +DEMO +PDF 如何购买 如何安装     如何获取日志文件     如何测试和优化     Expforex 的所有产品 打开和关闭、反转和锁定、部分关闭/Autolot。虚拟/真实止损/止盈/追踪止损/盈亏平衡,订单网格... МetaТrader 5 中主要订单的交易控制面板 :买入、卖出、buystop、buylimit、sellstop、selllimit、平仓、删除、修改、追踪止损、止损、获利。 有 5 个选项卡 可用:头寸、挂单、账户信息、信号和总利润。 Description on English VirtualTradePad在“  MQL5语言最佳图形面板  ”竞赛中 获得二等奖 。 注意!如果
    The News Filter MT5
    Leolouiski Gan
    4.75 (20)
    这个产品在新闻时间过滤所有的专家顾问和手动图表,因此您不必担心突然的价格波动会破坏您的手动交易设置或其他专家顾问输入的交易。此产品还带有完整的订单管理系统,可在任何新闻发布前处理您的持仓和挂单。一旦您购买了   The News Filter ,您将不再需要依赖以后的专家顾问内置的新闻过滤器,因为这个产品可以从此过滤它们所有。 新闻选择 新闻来源于Forex Factory的经济日历。 选择可以基于任何一种货币,如USD,EUR,GBP,JPY,AUD,CAD,CHF,NZD和CNY等。 选择也可以基于关键识别,例如Non-Farm (NFP),FOMC,CPI等。 能够选择新闻影响级别的筛选,从低、中、到高影响。 自动模式只选择与图表相关的新闻。 新闻来源每小时自动刷新,以确保最新的新闻数据。 为每个新闻影响级别提供单独的输入,以确定您要过滤掉的新闻发布前后的分钟数。 订单管理选项 在新闻发布前关闭未平仓头寸的选项,并在新闻发布后恢复它们。 在新闻发布前删除挂单的选项,并在新闻发布后恢复它们。 在新闻发布前移除止损和止盈水平的选项,并在新闻发布后恢复它们。 在新闻发布前移动止损和
    Trade Manager DaneTrades
    Levi Dane Benjamin
    4.36 (28)
    交易管理器可帮助您快速进入和退出交易,同时自动计算风险。 包括帮助您防止过度交易、报复性交易和情绪化交易的功能。 交易可以自动管理,账户绩效指标可以在图表中可视化。 这些功能使该面板成为所有手动交易者的理想选择,并有助于增强 MetaTrader 5 平台。多语言支持。 MT4版本  |  用户指南+演示 交易经理在策略测试器中不起作用。 如需演示,请参阅用户指南 风险管理 根据%或$自动调整风险 可选择使用固定手数或根据交易量和点自动计算手数 使用 RR、点数或价格设置盈亏平衡止损 追踪止损设置 最大每日损失百分比,在达到目标时自动平仓所有交易。 保护账户免遭过多提款并阻止您过度交易 最大每日损失(以美元为单位)在达到目标时自动关闭所有交易。 保护账户免遭过多提款并阻止您过度交易 一键实现所有交易的盈亏平衡 自动计算从手机/电话发送的交易的风险 OCO 在设置中可用 交易和头寸管理 通过设置每月、每周、每天、每小时或每分钟的最大交易次数,停止过度交易和报复性交易。 高级挂单管理。 调整何时关闭挂单的规则 追踪挂单 支持市价订单和挂单 每日最大利润目标(以美元为单位)以确保头寸并停止
    Footprint Chart Pro — Professional OrderFlow EA for MetaTrader 5 Version 6.34 | Professional tool for real traders | Institutional-Grade Visualization DEMO USERS - PLEASE SELECT EVERY TICK / REAL TICK WHEN TESTING AND YOU HAVE DOWNLOADED HISTORICAL DATA. IF YOU SEE A WAITING SCREEN AND IT IS NOT DOWNLOADING, IT MEANS YOU HAVE LOW HISTORICAL DATA. TRY 1 MIN AND 5 MIN FIRST ON 1 DAY DATA. ONE DAY DATA SHOULD BE THE NEWEST AND MOST CURRENT DATE. PLEASE WAIT UNTIL THE MARKET HAS ROLLED OVER PERIOD.
    EasyTrade MT5
    Alain Verleyen
    5 (3)
    Easy Trade – 智能、简洁且强大的交易管理工具 Easy Trade 是为 MetaTrader 用户打造的一体化交易管理解决方案,帮助您轻松掌控风险,实现流畅交易执行。 它是根据交易者的反馈从零开始开发的,简化了多品种交易的执行、监控和管理流程,无需繁琐的操作。 无论您是手动短线交易者,还是管理多个交易设置的小型投资组合,Easy Trade 都能让您专注于明智决策和稳定盈利。 ⸻ 为什么选择 Easy Trade? 精准风险管理:可选择固定手数或按百分比定义每笔交易的风险。实时显示风险与潜在收益。 篮子式跟踪止盈:追踪多笔交易的总利润,目标达成时自动锁定部分收益,适用于组合交易。 交易截图记录:每笔交易都可截图保存,方便日记记录、回顾与绩效分析。 定时自动平仓:可设定具体日期和时间自动关闭持仓,适合日终或周末前平仓。 界面可自定义:可调整按钮排序与大小、线条样式与颜色、缩放比例等,满足个人使用习惯。 ⸻ 主要功能(版本 1.0) 魔术号与策略标签: 使用注释标记轻松区分不同策略的交易,便于统计与复盘。 手数设置: 支持固定手数或基于止损与账户资金百分比的动态手
    The product will copy all telegram signal to MT5 ( which you are member) , also it can work as remote copier.  Easy to set up, copy order instant, can work with almost signal formats, image signal,  s upport to translate other language to English Work with all type of channel or group, even channel have "Restrict Saving Content", work with  multi channel, multi MT5 Work as remote copier: with signal have ticket number, it will copy exactly via ticket number. Support to backtest signal. How to s
    实时扫描您的整个观察列表,发现极端K线。 Power Bar Scanner 同时监控您所有的交易品种,在出现极端价格K线的瞬间向您发出警报。无需再逐个翻看图表。在一个面板中查看所有机会。 适用于任何时间周期。Forex、指数、黄金、加密货币 - 全部集中在一个视图中。 工作原理 扫描器检查您 Market Watch 中的每个品种,寻找实体超过 N x ATR 的K线。当发现这样的K线时,该品种会亮起并显示方向(BUY/SELL)、ATR 比率以及信号出现在多少根K线之前。您可以一目了然地看到哪些品种当前处于活跃状态。 一键导航 点击扫描器中的任何品种名称,您的图表会立即切换到该品种。发现信号,点击它,分析它。无需手动切换品种,无需在图表标签中搜索。 可排序列 点击任何列标题,按品种、价格、信号、比率或时间排序。想先看最强的信号?按 Ratio 排序。想看最新的信号?按 Age 排序。再次点击可反转排序顺序。 与 Power Bar MT5 完美配合 扫描器发现机会。 Power Bar 指标 进行分析。两者结合使用:扫描器在您的观察列表中提醒您出现极端K线,然后点击该品种,让
    Entry In The Zone with SMC Multi Timeframe is a real-time market analysis tool developed based on Smart Money Concepts (SMC). It is designed to analyze market structure, price direction, reversal points, and key zones across multiple timeframes in a systematic way. The system displays Points of Interest (POI) and real-time No Repaint signals, with instant alerts when price reaches key zones or when signals occur within those zones. It functions as both an Indicator and a Signal System (2-in-1),
    Trade Manager DashPlus
    Henry Lyubomir Wallace
    5 (13)
    DashPlus 是一款先进的交易管理工具,旨在提升您在 MetaTrader 5 平台上的交易效率和效果。它提供一整套功能,包括风险计算、订单管理、先进的网格系统、基于图表的工具和绩效分析。 主要功能 1. 恢复网格 实施一个平均和灵活的网格系统,以在不利的市场条件下管理交易。 允许设置战略性进出点,以优化交易恢复。 2. 叠加网格 通过在强劲的市场波动中增加仓位,最大化有利交易的潜在回报。 帮助您通过扩展获利交易来利用趋势市场。 3. 盈亏线 在图表上直接提供潜在利润和损失场景的可视化表示。 调整设置并拖动盈亏线,以在执行之前评估各种交易结果。 4. 篮子模式 简化同一交易品种的多仓位管理,将它们合并为一个聚合仓位。 基于平均价格,便于监控和应用止损、止盈以及其他订单修改。 5. 图表上的新闻 将预定的经济新闻事件整合到您的交易图表中。 帮助您随时掌握可能影响市场波动的即将发生的事件,从而更好地规划交易。 6. 警报 设置基于时间或价格的警报,通知会显示在 MT5 中,或通过 MT5 应用发送到您的移动设备。 对监控关键价格水平或重要的交易时段非常有用。 7. 绩效统计 提供详细的
    The Expert Advisor is a comprehensive risk manager helping users to control their trading activities. With this tool being a safeguard you can easily configure various risk parameters. When any limit is exceeded, the risk manager can force close opened positions, close other EAs, and even close the terminal to prevent emotional trading that doesn't correspond to your trading strategy. Risk Manager Settings Account Protection Check min equity limit to close all (account currency) - check the min
    Crypto Charting
    Rajesh Kumar Nait
    5 (5)
    Crypto Charting for MT5 – MetaTrader 5 加密货币图表集成工具 概述 Crypto Charting for MT5 通过 WebSocket 提供实时 OHLC 图表数据。支持多家交易所,并可在 MT5 中自动更新历史数据。 功能 实时 WebSocket 数据传输 自动历史数据同步 网络中断后的计划更新 兼容所有 MT5 时间周期 支持 OHLCV 数据格式 支持策略测试器 自动重新连接 支持的交易所 Binance, Bybit, OKX, KuCoin, MEXC, Gate.io, Bitget, XT.com 补充说明 如需获取 Tick 数据和深度数据,可查看名为 Crypto Ticks 的相关产品。 注意事项 不使用 DLL,适用于 VPS 环境。 Strategy Tester 不支持 WebRequest 功能。 如需试用版本,请通过 MQL5 私信联系作者。 Full Documentation & Setup Guide : Click Here
    Equity Protect Pro:全方位账户保护专家,让您的交易更安心 如果您正在寻找账户保护、净值保护、投资组合保护、多策略保护、利润保护、利润收割、交易安全、风控程序、自动风控、自动清仓、条件清仓、定时清仓、动态清仓、跟踪止损、一键关闭、一键清仓、一键还原等功能,Equity Protect Pro 就是您要找的程序。 它配置简单,当到达预设条件时,可关闭所有图表,同时支持关闭信号订阅(这意味着所有交易程序也将停止运行)。此时,将不再有新订单产生,最后再关闭所有订单,有效防止意外损失,让您在交易过程中高枕无忧。 Equity Protect Pro (Technical Manual) Equity Protect Pro Demo Version for yo u to test   Equity Protect Pro MT4 Demo.ex4        Equity Protect Pro MT5 Demo.ex5 Equity Protect Pro 拥有 14 个核心功能,它们都是独立运行的。您可以根据您的交易策略,选择合适的功能组合使用。这些功能默认为关闭状态,
    YuClusters
    Yury Kulikov
    4.93 (43)
    Attention: You can view the program operation in the free version  YuClusters DEMO .  YuClusters is a professional market analysis system. The trader has unique opportunities to analyze the flow of orders, trade volumes, price movements using various charts, profiles, indicators, and graphical objects. YuClusters operates on data based on Time&Sales or ticks information, depending on what is available in the quotes of a financial instrument. YuClusters allows you to build graphs by combining da
    Telegram to MT5 Coppy
    Sergey Batudayev
    5 (8)
    Telegram 到 MT5: 终极信号复制解决方案 使用 Telegram 到 MT5 简化您的交易,这款现代化工具可直接从 Telegram 频道和聊天室复制交易信号到您的 MetaTrader 5 平台,无需 DLL 文件。这款强大的解决方案可确保精准的信号执行、丰富的自定义选项,节省时间并提高您的效率。 [ Instructions and DEMO ] 主要特点 直接 Telegram API 集成 通过电话号码和安全码进行身份验证。 通过用户友好的 EXE 桥轻松管理聊天 ID。 添加、删除和刷新多个频道/聊天以同时复制信号。 使用高级过滤器进行信号解析 跳过包含异常词(例如“报告”、“结果”)的不需要的信号。 支持灵活的 SL 和 TP 格式:价格、点数或点数。 自动计算指定点而不是价格的信号的切入点。 订单定制和灵活性 使用多种模式配置订单大小:固定手数、动态手数(% 风险)或特定符号手数。 使用信号数据或自定义参数调整 SL/TP。 设置滑点限制、挂单到期时间和重试参数,以实现无缝执行。 综合符号管理 排除特定符号或映射到特定经纪人的符号。 自定义信号和经纪商符号之间
    Advanced Dashboard Ultra
    Mirel Daniel Gheonu
    5 (1)
    MT5 统计仪表板 & 交易日志 ULTRA (Stats Dashboard & Journal ULTRA) 完整的交易指挥中心:分析、自动化与新闻情报。 Stats Dashboard ULTRA 是 Pro 分析工具的终极进化版。它将 MetaTrader 5 转化为专业的交易工作站,结合了机构级的绩效分析、自动新闻保护和高级心理指标。专为需要全面掌控的手动交易者和 EA 组合经理设计。 ULTRA 版本新功能 新闻情报引擎 (News Intelligence Engine): 不仅是看新闻——而是分析它。仪表板会模拟过去的新闻事件如何影响您的未平仓交易,告诉您是应该持有还是平仓。 EA 机器人卫士 (Bot Guard): 在高影响力新闻期间自动暂停您的其他智能交易系统 (EA),并在市场平静后重新启动它们。 真实权益回撤 (True Equity Drawdown): 基于日内浮动亏损 (MAE) 计算风险,而不仅仅是已结余额,为您提供真实的风险图景。 心理与效率评分: 游戏化的指标,衡量您的纪律性、交易效率 (MFE 捕获率) 和错误成本。 魔术编号 (Magic Nu
    Seconds Chart MT5
    Boris Sedov
    4.59 (17)
    秒级图表 (Seconds Chart) - 一款专为 MetaTrader 5 设计的独特工具,用于创建秒级时间框架的图表。 通过 秒级图表 ,您可以构建以秒为单位的时间框架图表,获得标准分钟或小时图表无法提供的极致灵活性和分析精度。例如,时间框架 S15 表示每根蜡烛图持续15秒。您可以使用任何支持自定义交易品种的指标和EA交易系统。操作它们就像在标准图表上交易一样方便。 与标准工具不同, 秒级图表 让您能够在超短时间框架下进行高精度交易,无延迟干扰。 秒级图表的优势 支持 1至900秒 的时间框架图表。 基于内置的实时报价数据库, 即时加载 历史数据。 数据实时更新, 无延迟或滞后 。 可同时创建 多个秒级图表 。 秒级图表的理想应用场景 剥头皮交易 和高频交易。 精确的入场和出场时机。 在短时间框架下测试交易策略。 时间框架设置 默认设置包含以下时间框架: S1、S2、S3、S4、S5、S6、S10、S12、S15、S20、S30 。 您可轻松自定义时间框架组合,只需按升序列出 1至900秒 的数值且避免重复即可。 其他免费工具 快速交易管理器 ( Quick Trade Ma
    Risk Manager for MT5
    Sergey Batudayev
    4.35 (17)
    MT5 的 Expert Advisor 风险管理器是一个非常重要的程序,我认为对每个交易者来说都是必要的程序。 使用此 EA 交易,您将能够控制您交易账户中的风险。风险和利润控制可以以货币形式和百分比形式进行。 要让智能交易系统工作,只需将其附加到货币对图表并以存款货币或当前余额的百分比设置可接受的风险值。 PROMO BUY 1 GET 2 FREE -   https://www.mql5.com/en/blogs/post/754725 顾问功能 该风险经理将帮助您控制风险: - 交易 - 每天 - 一个星期 - 一个月 你也可以控制 1) 交易时允许的最大手数 2) 每天最大订单数 3) 每天最大利润 4) 设置 Equity 的获利了结 不仅如此,如果您在设置中指定自动设置,顾问还可以为您设置默认的止损和止盈。 顾问会在每个事件中附上警报,并向您解释删除订单的原因。比如你开了,你开了第6个订单,按照你的规则你每天只允许开5个订单,顾问会立即删除6个并说明原因。 例如,您开仓的手数比您最初向自己指示的手数大,顾问将删除订单并解释原因。例如,您每天赚取 5
    作者的更多信息
    TS Market Sessions
    Aurelio Manuel Peral Garcia
    5 (2)
    Indicador gratuito para Metatrader 5 que muestra en pantalla una caja rectangular para cada una de las sesiones de mercado "Londres, New York y Tokio". Se puede establecer la zona horaria de forma automática o mediante un valor de offset. Parámetros de configuración para cada una de las sesiones. Visible / No visible Hora Inicial Hora Final Caja sólida o transparente. Estilo del borde de la caja. Grosor del borde de la caja. Color.
    FREE
    TS Time Remaining
    Aurelio Manuel Peral Garcia
    TS Time Remaining - Indicador de Cuenta Regresiva para Velas en MetaTrader 5 El TS Time Remaining es un indicador gratuito diseñado para la plataforma MetaTrader 5 que permite a los traders visualizar en tiempo real el tiempo restante de la vela actual. Esta herramienta es especialmente útil para aquellos operadores que trabajan con estrategias basadas en la acción del precio y patrones de velas japonesas, ya que les permite anticiparse al cierre de la vela y tomar decisiones con mayor precisión
    FREE
    TS PerfectDays MT5
    Aurelio Manuel Peral Garcia
    Perfect Days: El Robot de Trading Inteligente para el Oro (XAUUSD) Perfect Days es un avanzado robot de trading automático desarrollado específicamente para operar con alta eficiencia en el par XAUUSD (oro frente al dólar estadounidense) dentro de la plataforma MetaTrader 5 . Diseñado tanto para traders profesionales como para quienes buscan una solución robusta y segura, este experto asesor (EA) combina tecnología de vanguardia con una operativa responsable y personalizable. Características Pri
    筛选:
    无评论
    回复评论