Session Standard Deviation Date Range Analyzer

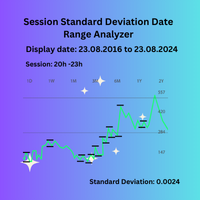
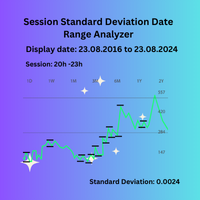
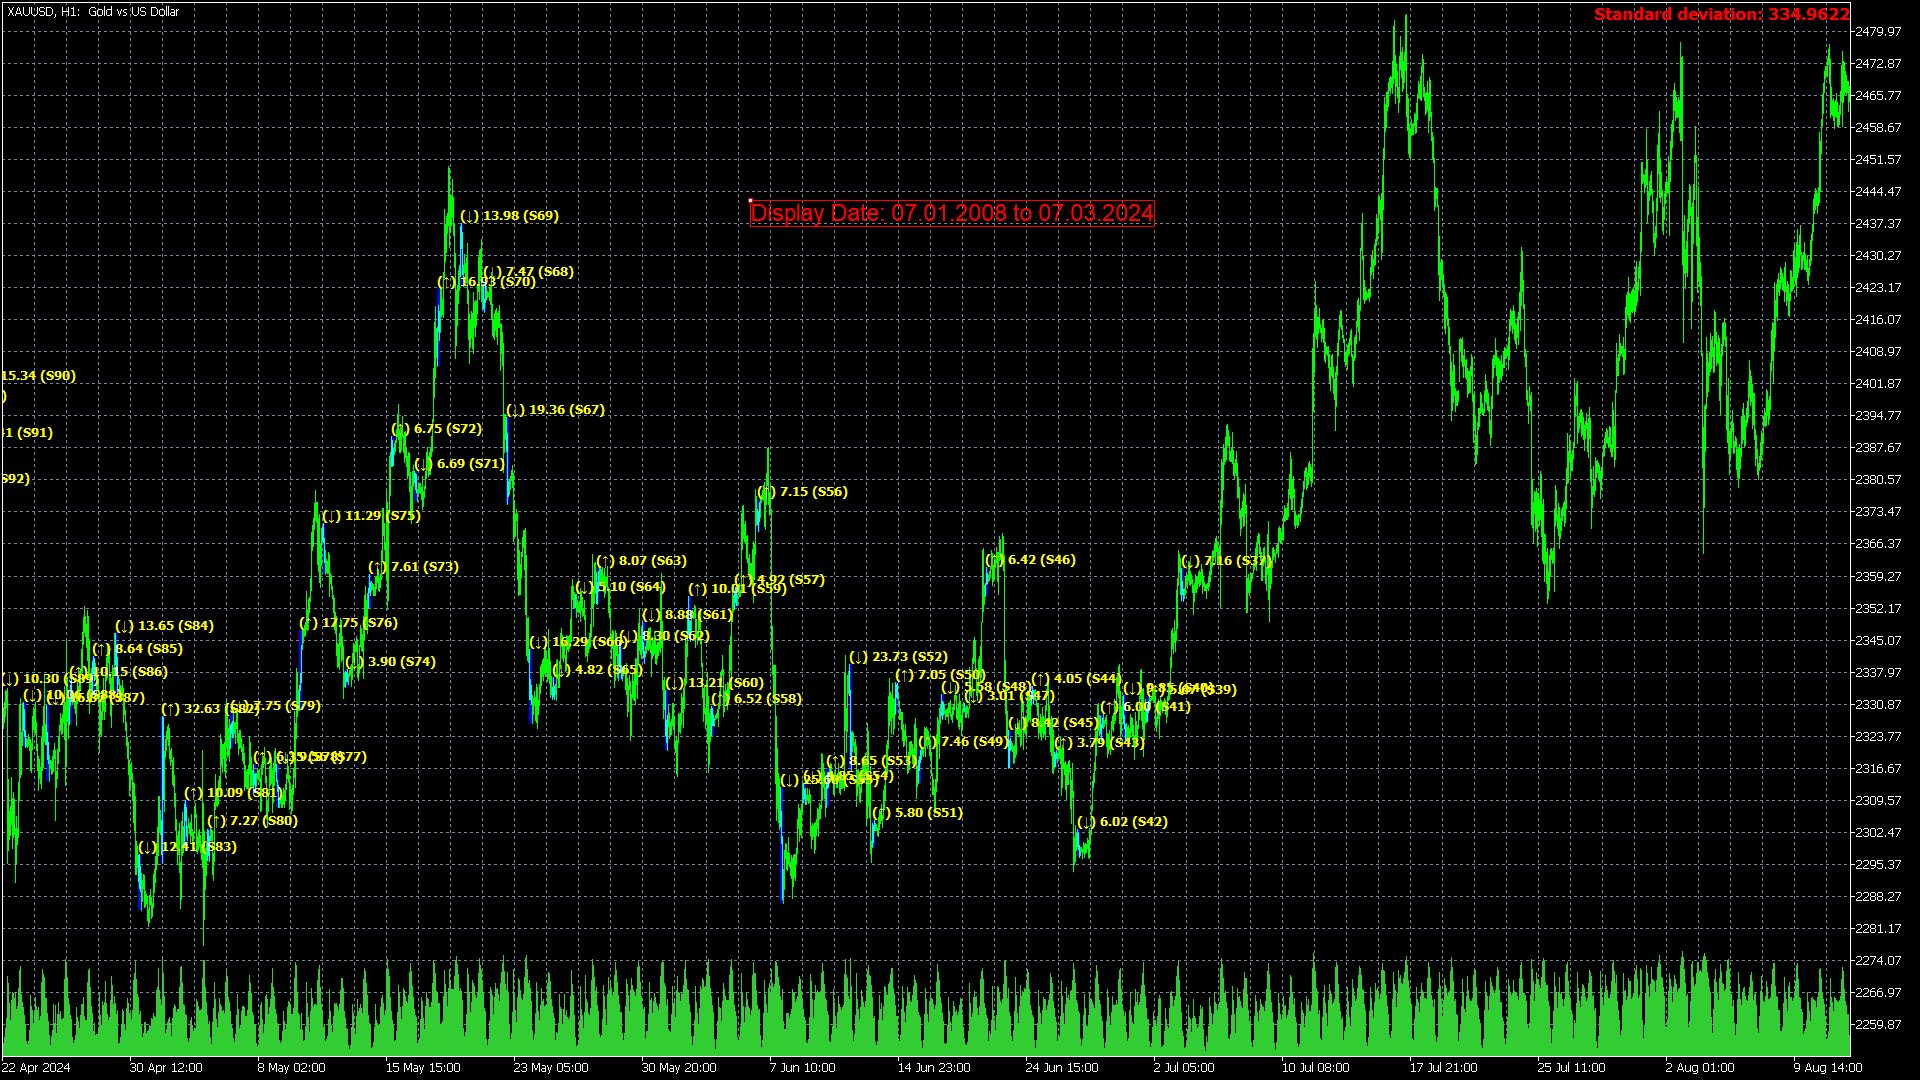
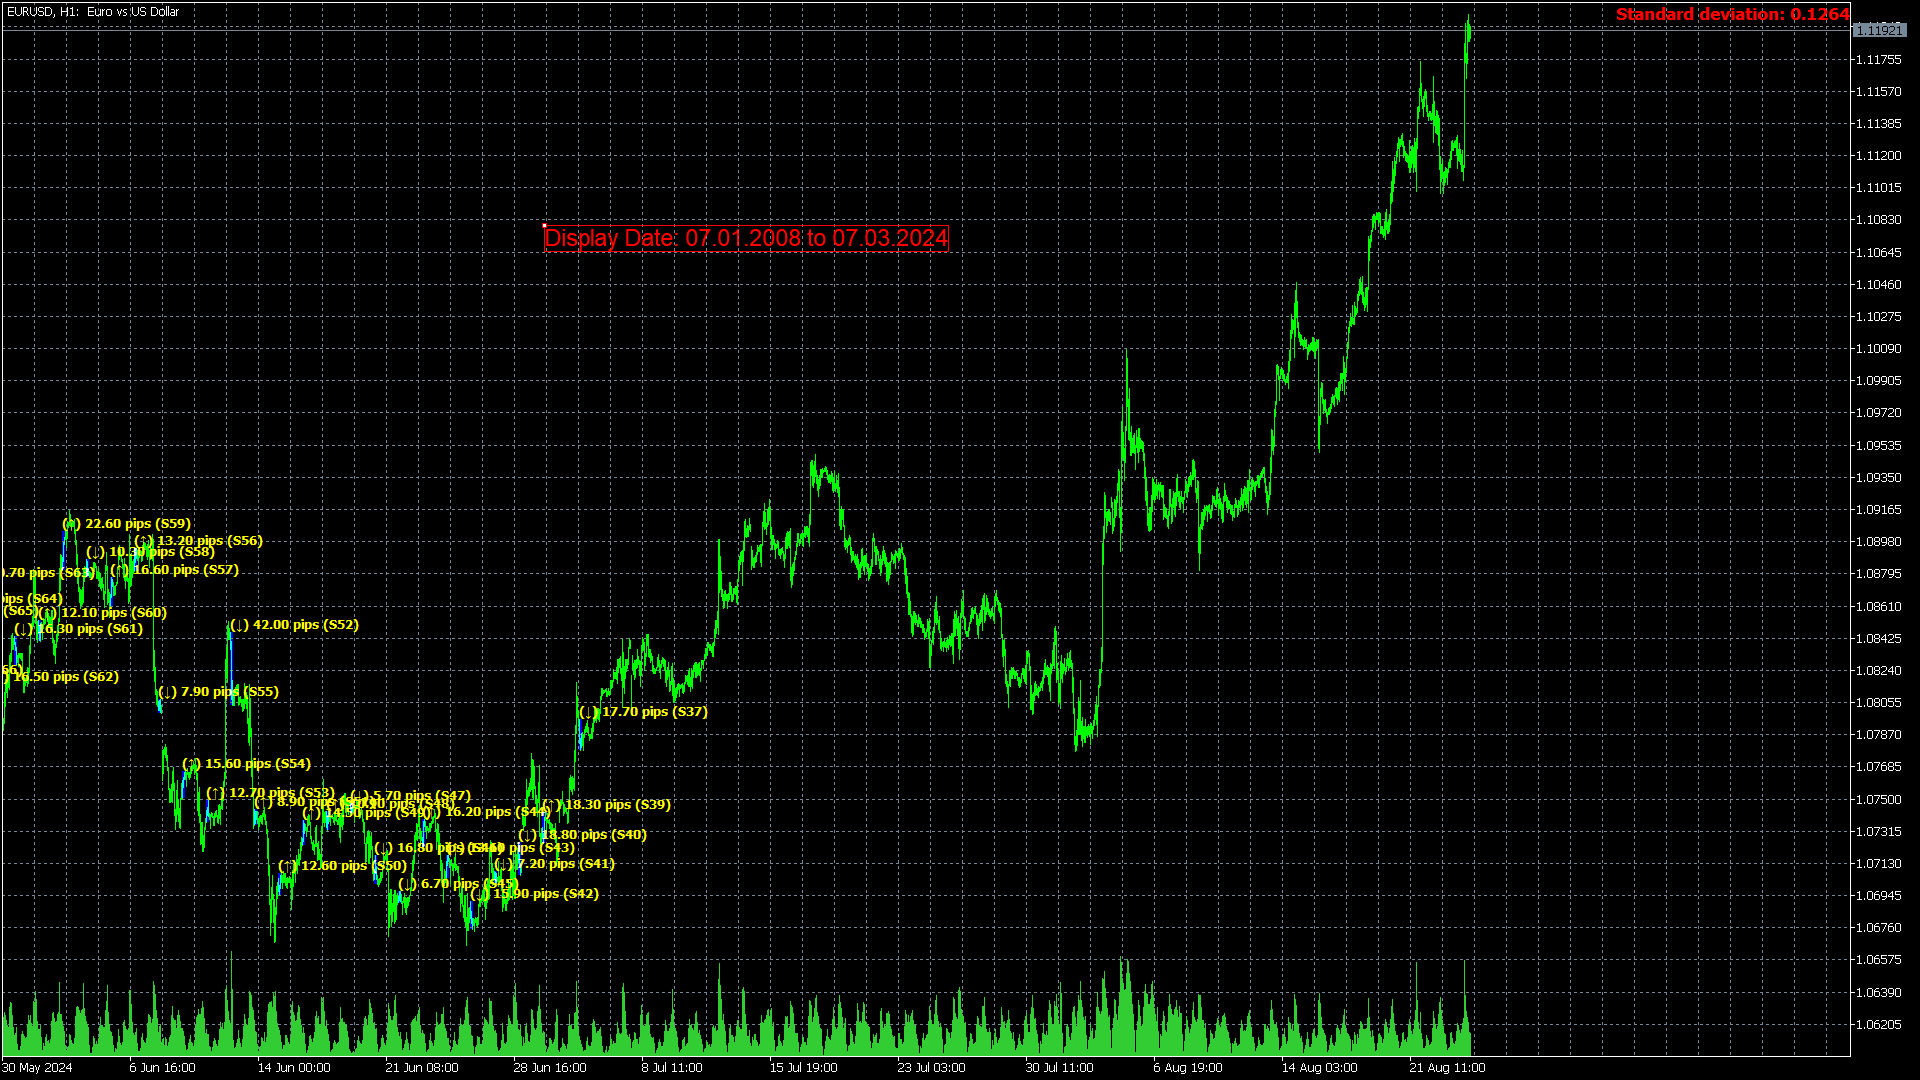
Session Standard Deviation Date Range Analyzer: Evaluate the standard deviation of each bar's price (high, low, close, open, weighted, median, and typical) within defined trading sessions and date ranges, providing detailed insights into price volatility and market behavior.

**Note:** When the trading platform is closed, the indicator may not load correctly. To ensure it works, you may need to load the indicator, unload it, and then load it again.

**Note:** : This indicator can only be used with historical data. It does not support real-time data analysis.

**Note:**  When switching to a different timeframe, it's recommended to switch back and forth between timeframes to ensure that all data loads properly. This process helps to fetch the necessary historical data, ensuring that calculations based on this data are accurate.
Description:

The "Session Standard Deviation Date Range Analyzer" is a sophisticated analytical tool crafted for traders and analysts seeking to evaluate price volatility across specific trading sessions within a user-defined date range. Unlike traditional indicators that focus solely on high and low prices, this tool provides a comprehensive analysis based on each bar’s price, including high, low, close, open, weighted, median, and typical prices. This detailed approach helps in understanding the standard deviation of price movements, offering deeper insights into market volatility and behavior over selected periods.

Key Features:

1. Customizable Time and Date Input:
   - Start Time and End Time: Users can specify the exact start and end times of the trading session they wish to analyze. This allows for precise examination of specific market hours, such as the New York session, or any other relevant time frame.
   - Start Date and End Date: Define the range of dates for analysis, enabling users to focus on particular periods, such as historical economic events or periods of significant market fluctuations.

2. Bar-Based Analysis:
   - The tool calculates standard deviation based on various bar prices, including high, low, close, open, weighted, median, and typical prices. This approach provides a nuanced view of price volatility by examining how each bar’s price contributes to the overall standard deviation within the selected session and date range.

3. Enhanced Volatility Insights:
   - By leveraging detailed price data, users can gain a deeper understanding of market volatility during specific sessions. This feature is particularly valuable for backtesting trading strategies or studying price behavior during critical historical periods.

4. Historical Data Analysis:
   - Users can analyze how price volatility has evolved over time by examining historical data. This is essential for understanding market dynamics and assessing the impact of significant events on trading sessions.

5. Application for Detailed Studies:
   - The tool supports both short-term and long-term analysis, making it suitable for users looking to study price volatility over various periods. Whether evaluating daily market movements or extended historical trends, the Session Standard Deviation Date Range Analyzer provides valuable insights.

Practical Use Case:

For a trader aiming to assess the volatility of the New York trading session during the financial crisis of 2007-2009, the Session Standard Deviation Date Range Analyzer can be utilized to input the exact start and end times for the New York session and set the relevant date range. The tool will then calculate and provide the standard deviation of prices based on each bar's price data, offering a detailed view of how market volatility behaved during these turbulent times.

This tool is designed for a wide range of users, from academic researchers to professional traders, by offering a detailed and customizable view of price volatility across specific sessions and date ranges. Its advanced analysis capabilities make it a valuable asset for anyone involved in price analysis and volatility assessment.

Note: The indicator is optimized for timeframes of H4 and below.

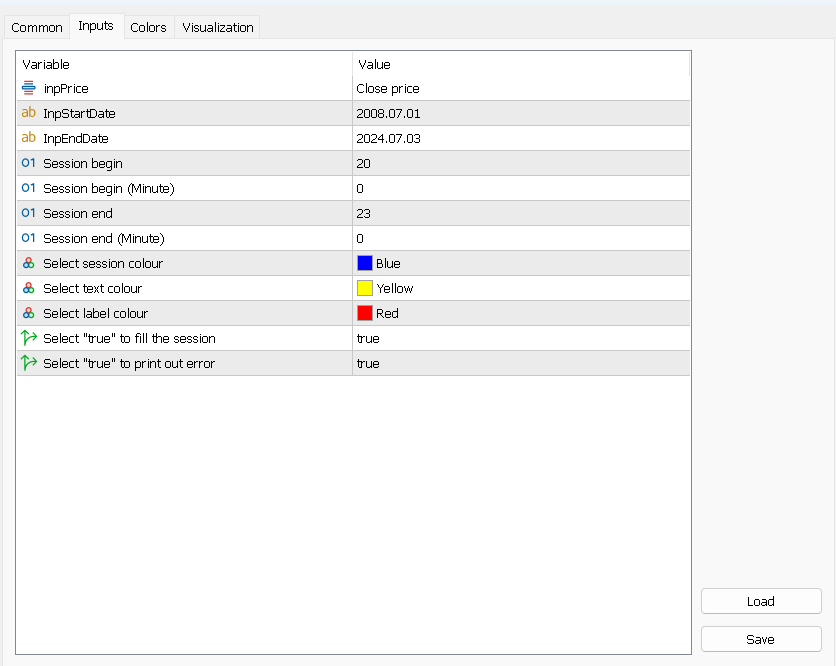
Main Inputs:

- InpPrice: Specifies the type of price used for standard deviation calculation within the selected session and date range. Options include:

  • High: Use the highest price of each bar.
  • Low: Use the lowest price of each bar.
  • Close: Use the closing price of each bar.
  • Open: Use the opening price of each bar.
  • Weighted: Use the weighted price of each bar.
  • Median: Use the median price of each bar.
  • Typical: Use the typical price of each bar.

- InpStartDate:Specify the starting date for the analysis period.
- InpEndDate: Define the ending date for the analysis period.
- SBegin (Broker time): Sets the starting hour of the session in 24-hour format.
- SBeginMinute (Broker time): Defines the starting minute of the session.
- SEnd (Broker time): Determines the ending hour of the session in 24-hour format.
- SEndMinute (Broker time): Specifies the ending minute of the session.
- SColor: Chooses the color for displaying the session on the chart.
- InpTextColor: Sets the color for the text displayed by the indicator.
- InpLabelColor: Defines the color for labels within the indicator.
- InpFill: Selects whether to fill the session area with color.
- InpPrint: Determines whether to print error messages to the log.
推荐产品
This indicator displays two important pieces of information on the MT5 chart: Current Spread - Trading cost measured in points, helping traders assess optimal entry timing when spread is low. Time Countdown - Remaining time (minutes:seconds) until the current candle closes and a new candle forms, supporting candle-based trading strategies. Information is displayed as compact text in a chart corner (default top-right), with customizable position, color, and font size. The indicator updates in rea
FREE
TerminalBridge Account Analytics 是一款直接顯示於圖表上的 MetaTrader 5 帳戶統計指標。 它可將已平倉的交易活動整理為日、週、月、季度及年度檢視。全帳戶統計預設包含所有交易品種。 主要功能 - 顯示即時浮動盈虧 - 記錄每日最大浮動虧損 - 顯示浮虧百分比、發生時間及資料狀態 - 提供今日、全部、最近 1 個月、最近 3 個月及自訂歷史範圍 - 內建月曆,可用於選擇自訂日期 - 可依交易品種、Magic Number 及成交註解進行篩選 - 統計總手數、最小與最大交易手數、交易次數及淨盈虧 - 統計入金、出金及帳戶餘額 - 支援較長交易歷史的分頁瀏覽 - 採用固定且可直接使用的面板配置,不提供可調整的 Inputs 參數 - 不會開倉、修改或平倉任何交易 風險記錄 記錄器會在收到新 Tick 時,以及透過毫秒計時器,持續取樣帳戶餘額與權益。當偵測到新的每日最低浮動盈虧時,紀錄會立即儲存。 若要持續記錄浮動虧損,指標與交易終端必須保持運行。對於安裝指標之前、終端關閉期間或連線中斷期間的浮動虧損,無法事後重建。 資料品質會顯示為完
FREE
Spread Monitor Pro
Simon Draxler
5 (1)
DRX SPREAD MONITOR 是一款专业实用工具,旨在实时可视化和分析经纪商的点差。它帮助交易者识别因新闻事件、隔夜利息结算或低流动性时段导致的点差扩大所带来的隐性成本。 对于需要确保执行质量并在交易成本统计过高时避免入场的剥头皮交易者(Scalpers)和黄金交易者来说,此工具至关重要。 主要功能 实时直方图: 在单独的窗口中显示点差历史记录,并对正常、高和极端水平进行颜色编码。 动态移动平均线 (MA): 计算平均点差趋势,帮助您区分暂时性的峰值和结构性的点差增加。 可视化“均衡器”模式: 一种独特的柱状图可视化,可在不干扰图表的情况下提供有关市场流动性状况的即时反馈。 实时数据面板: 图表上的紧凑仪表板显示: 当前点差 平均点差(基于时间) 最小/最大记录 声音警告系统: 当点差超过您定义的“高”或“极端”阈值时,触发可自定义的声音警报。 应用场景 新闻交易: 检测重大新闻发布后点差何时恢复正常。 经纪商比较: 监控不同的经纪商,查看谁在波动阶段提供更好的条件。 降低成本: 在市场成本昂贵的时段过滤掉交易。
FREE
Introduction The Parabolic SAR (Stop and Reverse) indicator is a technical analysis tool designed to identify potential trend reversals and provide trailing stop-loss levels. This enhanced version of the standard Parabolic SAR for MetaTrader 5 offers improved visual clarity, customizable alerts, and an optional trend confirmation filter to assist traders in their analysis. Features Enhanced Visualization: Displays Parabolic SAR dots in two distinct colors (Lime for uptrends, Red for downtrends)
FREE
AZ ATR indicator (with volume correlation bonus) Standard ATR indicator, you can enable ignoring abnormally large candles. It is possible to change the location of the displayed text in 4 corners of the chart. You can change the calculation period (days ago). Bonus - the indicator has a correlation with volumes. Can be enabled to display a possible priority at the current moment in the market. What do the values ​​mean: Positive correlation (0.3 - 1.0): 0.3-0.7 - moderate connection
FREE
MT5 All Icons
Danny Giovanni Romero Lozano
MT5 All Icons is a high-utility developer tool designed to simplify the visual customization of indicators and Expert Advisors. It provides a comprehensive, interactive reference table of all 255 Wingdings symbols directly within a separate chart subwindow. Instead of guessing character codes or looking up external charts, this tool allows you to see every available icon, its visual representation, and its corresponding ID number in real-time. Key Features: Full Library Access: Displays the com
FREE
SMC Price Action Patterns - MT5 Indicator Product Description MetaTrader 5 custom indicator SMC Price Action Patterns A chart overlay indicator for traders who want a structured view of Smart Money Concepts, market structure shifts, order block patterns, fair value gaps, equal highs and lows, and key multi-timeframe price levels directly inside MetaTrader 5. BOS and CHoCH Internal and Swing Structure Order Block Finder Input-Controlled FVG Colors EQH and EQL Premium and Discount Zones Product Ov
FREE
Candle Timer and Spread and Session  in a smart way displays the remaining time before the current bar closes and a new bar forms and also the Current Session in place. It can be used for time management and at the same time you keep an eye on Spread changes and Session Change. Real-Time Edge in Your Trading: Candle Timer & Spread Overlay – FREE for a Limited Time! Smart Display of  Candle Timer and Spread and Session in a single place Lightning-Fast Candle Countdown Timer Instant Spread Monito
FREE
Stamina HUD
Michele Todesco
STAMINA HUD – Advanced Market & Trend Dashboard (MT5) STAMINA HUD   is a professional   market information panel   designed for traders who want   clarity, speed, and control   directly on the chart. It provides a   clean heads-up display (HUD)   with essential market data and   multi-timeframe trend direction , without cluttering the chart or generating trading signals. What STAMINA HUD Shows   Current Price   Spread (in real pips)   Today High–Low range (pips)   Average D
FREE
SmartWaterMark Essential
Rodolpho Miguel Sales Bueno
SmartWaterMark Essential 是一款适用于 MetaTrader 5 的轻量级水印指标。 它可以在图表中央显示清晰、简洁的交易品种水印,帮助您快速识别当前图表正在查看的交易品种。对于同时使用多个图表、多个品种或多个时间周期的交易者来说,这可以让工作区更加整洁,也能减少切换图表时的识别错误。 功能: - 居中的交易品种水印 - 可在基于时间的图表上选择显示时间周期 - 支持显示交易品种描述 - 提供基本的文字颜色、透明度和字体自定义 SmartWaterMark Essential 专为日常图表管理而设计,设置简单,视觉风格低调,不会干扰价格走势阅读,同时让图表信息更加清楚。 简洁、清晰,并且适合日常图表整理。适合日常使用。
FREE
Smart Grid MT5
Dmitry Kotov
5 (5)
Smart Grid MT5 automatically recognizes any symbol, period and scale of the chart and marks it up accordingly. It is possible to mark up the chart by trading sessions. The grid consists of the two main line types. Vertical lines There are two visualization methods: Standard - the lines are divided into three types, separating: Small time period. Medium time period. Large time period. Trading Session - the lines are divided into groups (a total of ten). Each group has two lines: the first is res
FREE
Chart Symbol Changer for MT5
Juvenille Emperor Limited
5 (11)
MT5 的图表符号更改器是一个指标/实用程序,它为您提供更改当前图表符号的选项,该选项通过单击其面板上的符号按钮来更改。 MT5 的图表符号转换器让您可以选择根据个人喜好配置 32 个符号按钮,方法是添加您想要密切关注和交易最多的货币对。这样您就不会错过任何机会,因为只需点击几下,您就可以在图表上更快地查看市场。 MT5 安装/用户指南的图表符号转换器     |      更新购买的产品 特征 面板上有 32 个可自定义的符号,让您可以在同一图表上监控您喜欢的工具 在任何交易品种/工具、账户类型或经纪商上顺利运行 MT5 的图表符号转换器也以交易面板的形式出现,以帮助您进行交易和风险管理以及一般的手动交易。 手动交易面板 MT5: https://www.mql5.com/en/market/product/72965 如果您对购买感到满意,我将不胜感激。 如果您不是, 请与我联系以找到解决方案 。 检查我所有的产品: https://www.mql5.com/en/users/eleanna74/seller 联系我以获得支持: https://www.mq
FREE
ZigZag Profile
Nguyen Thanh Cong
Introducing the ZigZag Profile — a powerful tool designed to identify high-probability pivot zones where price action frequently reverses. This indicator analyzes historical price data to pinpoint key areas where price has pivoted multiple times, providing traders with actionable insights into potential support and resistance levels. The ZigZal Profile  indicator continuously scans for zones where price has reversed direction the most, highlighting these critical areas on your chart. By focusing
FREE
Panel Indicator For MT5 Panel Indicator For MT5 是一款专为 MetaTrader 5 设计的可视化指标,将价差和市场交易时段的所有核心信息整合在一个紧凑的面板中。面板直接显示在图表上,为交易者提供实时更新的即时读数,无需打开额外窗口或查阅外部资源。 实时价差监控 面板持续显示当前图表所加载品种的价差值。除即时值外,指标还自动计算当前活跃交易时段内累积的平均价差,以及同一时间段内记录的最大值。交易时段一旦切换,计数器立即清零并重新开始计算,确保统计数据始终与当前操作环境相关。 价差值采用颜色编码:绿色表示价差处于相对计算平均值的正常范围内,黄色表示价差略有升高,红色则突出显示异常或超出范围的价差。该系统使交易者在执行订单前能够一目了然地评估市场状况。 自动识别市场交易时段 指标自动识别东京、伦敦和纽约三大市场中当前活跃的交易时段。每个时段的开始和结束时间均可由用户通过输入参数完全自定义,时间以经纪商服务器时间表示。这种方式使面板能够适应任何经纪商和时区,无需手动修改代码。 当两个或多个交易时段重叠时,面板会明确显示所有活跃时段的名称。指标还
FREE
SM Zones
Arvydas Zukauskas
4.5 (2)
Developed according to the principles of smart money management strategies, the SM Zones indicator is a very convenient tool for traders on the MetaTrader 5 (MT5) platform. It graphically displays on the chart all the significant zones used in the SM strategy: market structure, price levels of increased liquidity, "price magnet" zones - imbalances, order blocks, fvg, breaker blocks and mitigation blocks - towards which the instrument's price moves. The zones influencing the bull market are high
FREE
USDJPY Keltner Range M15 Strategy is a fully automated MetaTrader 5 strategy designed to capture structured breakout opportunities on USDJPY using daily directional confirmation, Keltner Channel reference levels, volatility-buffered pending STOP entries and simple fixed-risk management. The strategy is designed for USDJPY on the M15 timeframe. Its goal is to participate when the market shows directional intent through daily high or daily low behavior, while using Keltner Channel structure and
FREE
Multi Currency Strength Dashboard Mini (FREE) – Currency Strength Meter for MetaTrader 5 Multi Currency Strength Dashboard Mini 是一款适用于 MetaTrader 5 的免费指标,以清晰快读的仪表板形式实时显示 8 大主要货币 (USD、EUR、GBP、JPY、CHF、CAD、AUD、NZD)的相对强弱。 目标:在几秒内识别强势和弱势货币,帮助您构建有针对性的关注列表(例如,选择强势货币对弱势货币的交易对)。 2.00 版本新功能 全新视觉刷新 – TradingTips UI(深蓝面板、霓虹边框、蓝色标题栏)。 分区方框内的彩色强度条(绿 / 金 / 红)。 8 个货币每行显示趋势箭头(上 / 下 / 中性)。 面板拖放 – 抓取标题栏即可在图表上移动。 最小化按钮 – 紧凑模式不占用图表空间。 面板位置在 MT5 重启后自动保存。 主要功能 在单个面板中分析 8 大主要货币。 自动实时更新。 适用于所有时间周期(在所选时间周期上计算)。 兼容大多数经纪商(
FREE
Time Session OHLC Mt5
Hiren Parekh
5 (11)
Time Session OPEN-HIGH-LOW-CLOSE This Indicator Will Draw Lines Of OHLC Levels Of Time Session Defined By User. It Will Plot Floating Lines On Current Day Chart. Time Session Can Of Current Day Or Previous Day. You Can Plot Multiple Session Lines By Giving Unique ID To Each Session. It Can Even Show Historical Levels Of Time Session Selected By User On Chart To Do Backdating Test. You Can Write Text To Describe The Lines.
FREE
Basic Theme Builder MT5
Mehran Sepah Mansoor
5 (2)
基本主题构建器:简化您的图表自定义 通过 基本主题构建器 指标,彻底改变您的交易体验。这款多功能工具旨在简化您在MetaTrader 5 平台上自定义图表外观的过程。该指标提供了一个用户友好的面板,您可以轻松切换不同的主题和配色方案,提升交易环境的视觉吸引力和功能性。 Free MT4 version 基本主题构建器 指标是那些希望轻松个性化MetaTrader 5图表的交易者的终极工具。通过其简单的面板界面和各种主题预设,您可以迅速调整图表的外观,以匹配您的交易风格或心情。无论您偏爱经典外观还是现代美学,基本主题构建器提供了一系列选项,以增强您的视觉体验并提高专注度。立即优化您的交易设置,体验这款实用且易于使用的指标。 主要特点: 轻松管理主题: 使用便捷的面板界面,单击即可快速更改图表主题。 预定义预设: 从几种预配置的主题和配色方案中进行选择,包括经典、深色、浅色等,以适应您的交易偏好。 可自定义选项: 调整颜色和样式,按您的喜好定制图表外观。 用户友好界面: 享受简单直观的设计,无需复杂设置或配置。 提升交易专注度: 通过视觉吸引力强且无干扰的图表环境,改善您的交易体验。
FREE
Trading Sessions by Mahefa R is an indicator for MetaTrader 5 that visually identifies the four main trading sessions: New York, London, Tokyo, and Sydney . Designed to provide a clean, intuitive, and professional market view, it highlights the most active periods of the Forex market using smart visualization of session ranges , session-specific candle colors , and daily separators . Main Features: Automatic detection of the 4 major sessions New York London Tokyo Sydney Each session is fully c
FREE
Daily POC
Felipe Monteiro Rodrigues
5 (1)
Daily POC 是一款高性能的成交量分布(Volume Profile)指标,专门用于提取每日交易时段(D1)的数据。它非常轻量级,可以在多个资产上同时运行而不会导致 MetaTrader 5 卡顿,并且在更改时间周期或应用模板时,绝不会在图表上留下“幽灵”对象或框。 它用于通过数学方法识别当天最大的机构流动性区域。该指标会自动绘制: POC(控制点):交易量最大的价格水平(实线)。 VAH(价值区域高点)和 VAL(价值区域低点):集中了当天70%成交量的极端位置(虚线)。 会话框:一个低调的视觉背景,界定了交易日的开始和结束。 这些水平可作为日内交易和波段交易的强大支撑、阻力和磁性目标。 该指标专为“即插即用”理念而设计,专注于保持图表尽可能整洁: 键盘控制(快捷键):该指标默认配置在“B”键上。只需在键盘上按下字母“B”,POC 和会话框就会立即显示。再次按下“B”即可隐藏所有内容并清理屏幕。 历史限制器:在参数中,您可以定义想要查看过去多少天的数据。这将您的分析集中在近期价格上,并节省 CPU 资源。
FREE
Dynamic Killzones
Nawal Kishor Yadav
ICT Dynamic Killzones — Custom Timezone Edition 此指标在图表上绘制 ICT 风格的 Killzone 会话框,同时显示前一日高点(Previous Day High)和前一日低点(Previous Day Low)水平。专为 M1、M5 和 M15 时间框架设计。 支持的会话 指标支持以下交易会话,每种会话均可自定义颜色和标签: Asia Session(亚洲会话) London Session(伦敦会话) New York Session(纽约会话) London Close Session(伦敦收盘会话) One optional Custom Session(可选自定义会话) 每个会话以彩色框显示(可填充或仅边框),会动态更新以反映当前活跃会话的价格范围。已结束的会话将在收盘后固定。 时区配置 指标使用两个独立的偏移输入:您的本地时区 UTC 偏移和经纪商服务器 UTC 偏移。这样无论经纪商时钟如何,都能准确定位会话。 前一日高点和低点 PDH 和 PDL 线会自动从前一天的日蜡烛绘制。线的颜色、宽度、样式和射线方向均可自定义。 视
FREE
My Risk Management MT5
Ahmad Aan Isnain Shofwan
5 (1)
My Risk Management The Risk Management Dashboard is a visual tool designed to help traders monitor risk exposure in real time. With a clear and compact layout, it provides an instant overview of trading activity, enabling more disciplined and informed decision-making. Key Features Active Symbol Summary Displays all traded symbols with the number of trades, total buy/sell lots, and current profit/loss. Per-Symbol Risk Analysis Calculates and shows the risk percentage of each symbol relative to
FREE
Directional Impulse
Ebuka Francis Obiakor
Directional Impulse 一个公式。每根K线。瞬间可读。 大多数指标告诉你价格在哪里或移动速度有多快。Directional Impulse 告诉你的是另一回事:这根K线谁赢了,赢了多少。 基于原创公式 — X = (2C − H − L) × (H − L) 与 X = (C − O) × (H − L) — 它将方向性偏差乘以K线的完整波幅,而不是像该谱系中所有先前指标那样将其归一化消除。结果是每根K线的有符号能量度量,同时捕捉了信念与波动性。有符号平方根变换将输出缩放到线性价格单位,使K线的完整分布变得可读,而非被一两个异常走势主导。 Combo 版本同时绘制两层: 中点锚定(宽柱)—— 当内部压力转变时最先翻转。最先发现看涨或看跌K线内部正在形成的拉锯。 开盘锚定(窄柱)—— 仅当K线实体反转时才翻转。确认完全接管。 共识模式 —— 将两个锚定叠加为单柱,在一致时放大,在 contested K线时压缩至接近零。 你以前看不到、现在能看到的: 一根带有长上影线的看涨K线显示为看跌 —— 因为卖方在收盘前将价格推回至波幅中点下方 衰减的脉冲柱(同方向、缩小尺寸
FREE
Double Correlation indicator (free) plots two windowed correlations in a separate window.  the size of window is taken as input before the two symbols to correlate to. Two symbols are taken as an input parameters as well as period length. and the two correlations are computed with the currently shown symbol ex: input GBPJPY and AUDNZD.  current symbol EURUSD then the following will be computed corr(EURUSD,GBPJPY) and corr(EURUSD,AUDNZD) The indicator can be useful to run a multi-symbol pair trad
FREE
The Analytical cover trend indicator is a revolutionary trend trading and filtering solution with all the important features of a trend tool built into one tool! The Analytical cover indicator is good for any trader, suitable for any trader for both forex and binary options. You don’t need to configure anything, everything is perfected by time and experience, it works great during a flat and in a trend. The Analytical cover trend indicator is a tool for technical analysis of financial markets
PnFxo
Stanislav Korotky
This is a bufferless indicator which can display classical X and O columns if applied on custom symbol charts built by Point-And-Figure-like generator PointFigureKagiCharts or its DEMO . The indicator will enforce a fixed price-scale on the chart to make sure the marks keep correct aspect ratio. The marks are shown only if the chart time-scale is large enough to hold them in the space allocated per bar (if the horizontal scale is one of 3 smallest ones, the indicator draws nothing and outputs a
FREE
Session Volatility Map
Strifor (Mauritius) Ltd
5 (6)
Session Volatility Map — 是一个在图表上显示主要交易时段(亚洲、欧洲、美国)的指标。 自动显示交易时段边界及其交汇区,这些区域通常波动性较高。 绘制每个时段的 High–Low 范围,帮助确定支撑和阻力位。 高亮显示当前活跃交易时段。 自动考虑夏令时/冬令时切换(欧洲/美国)。 适用人群 短线交易者 — 寻找高波动时段。 日内交易者 — 筛选“安静”和活跃时段。 新闻交易者 — 了解事件发生时对应的交易时段阶段。 使用 Session Volatility Map,你总能知道:市场是在区间内,还是准备启动冲击性行情。 设置 Time model (Platform/MT4/MT5) — 时间模式选择 Auto DST adjustment (market aware) — 自动夏令时调整 How many days to back (0 = today) — 显示天数 Color A — low volatility — 低波动颜色 Color B — high volatility — 高波动颜色 Font size
FREE
Pfg Risk Meter
Komlan Prosper Kouassi
PFG Risk Meter The PFG Risk Meter is a free companion indicator for the PropFirmGuardian EA Suite . It displays real-time daily and total drawdown as visual gauge panels on your chart, giving you instant visual feedback on your prop firm rule status. Features Live daily drawdown gauge Live total drawdown gauge Color-coded warning and danger zones Works on any symbol and timeframe Designed to run alongside the PropFirmGuardian EA Requirements This indicator is part of the PropFirmGuardian EA Suit
FREE
TSD-47 Hologram Dancer – Little FanieLizer Bring your charts to life with a futuristic holographic companion for MetaTrader 5. Animated hologram dancer Beat-aware sound system ️ Voice-enabled feedback Smart symbol & timeframe awareness Lightweight and fun to use TSD-47 futuristic interface styling Little FanieLizer is not just another indicator — it’s a holographic MT5 experience designed to add personality, immersion, and sci-fi vibes to your trading environment. The assist
FREE
该产品的买家也购买
本产品已针对 2026 年市场进行更新,并针对最新 MT5 版本进行了优化。 价格更新通知: Smart Trend Trading System 目前价格为 $99 。 接下来的 30 次购买 后,价格将上涨至 $199 。 特别优惠: 购买 Smart Trend Trading System 后,请发送私信给我,即可免费领取 Smart Universal EA ,并将您的 Smart Trend 信号转换为自动交易。 Smart Trend Trading System 是一套完整的交易系统,具备不重绘、不回绘、不延迟的特点,专为希望获得更清晰信号、更准确趋势方向以及更有组织交易方式的交易者打造。 Online course , manual and [download presets] . 它将 10 多种交易工具 整合到一个系统中,包括趋势检测、反转区域、Smart Cloud、移动止损逻辑、支撑与阻力、K线着色、提醒以及多周期分析。 该系统旨在帮助您应对不同的市场环境: 趋势市场: 识别主要趋势,发现回调,跟随动能,并通过止损指导和移动止损选项寻找更清晰的入场机会。
Trend Sniper X
Sarvarbek Abduvoxobov
5 (8)
Trend Sniper X 是一款适用于 MetaTrader 5 的多时间周期趋势跟踪指标,帮助交易者以清晰、精确的方式识别趋势方向和潜在的反转点。 价格信息: 当前价格为促销价,随着未来更新和新功能的发布,价格可能会有所变动。 Code2Profit 频道 通过多时间框架分析掌握市场! 技术规格 平台 MetaTrader 5 指标类型 多时间周期趋势指标 运行时间周期 任何图表时间周期,可独立选择更高的时间周期 (M1–MN1) 主要交易品种 外汇、黄金 (XAUUSD) 及其他差价合约 (CFD) 推荐账户 任何账户类型 可视化 彩色趋势蜡烛 (买入/卖出/微弱/变化) + 买入/卖出箭头 附加模块 交易时段方框 (悉尼、东京、伦敦、纽约) 主要功能 多时间周期趋势分析: 直接在当前图表上投射更高时间周期的趋势方向,提供清晰的宏观视角。 弱势/不确定柱检测: 高亮显示趋势条件不明朗的柱线,让交易者避开震荡区域。 买入/卖出信号箭头: 在确认趋势变化后的柱线上自动绘制箭头,支持警报、推送和电子邮件通知。 一键开启/关闭面板: 图表上的按钮可切换指标,下拉菜单可立即切换分析时间周
SMC Intraday Formula
Kareem Abbas
5 (20)
让我们先坦诚一点。 没有任何一个指标可以单独让你实现盈利。如果有人告诉你可以,那他是在向你兜售一个梦想。任何显示完美买卖箭头的指标都可以被做得看起来毫无瑕疵——只需要放大历史中的某一段并截取成功交易的截图。我们不会这样做。 SMC Intraday Formula 是一个工具。 它为你读取市场结构,标记出概率最高的价格区域,并用简单直白的语言准确告诉你当前智能资金的行为轨迹。你仍然需要做决定。你仍然需要执行交易。但现在,你是带着精确性执行,而不是靠希望。 我们已经在黄金(XAUUSD)以及主要外汇货币对的日内剥头皮交易中使用该指标将近三年。这是我们在 M1、M5、M15 和 M30 上的日常主力工具。它之所以有效,是因为它不试图预测未来——它展示的是当前正在形成的高概率交易机会,并解释 为什么 。 它与其他所有指标有什么不同? 大多数交易指标只做一件事。移动平均线交叉。振荡指标触及某个水平。出现一个箭头。你进场交易。你亏损。你责怪指标。重复。 SMC Intraday Formula 将多个机构级概念整合为一个统一的市场解读: - 斐波那契共振引擎 不只是普通的斐波那契水平——该指标
Welcome to ENTRY IN THE ZONE AND SMC MULTI TIMEFRAME Entry In The Zone and SMC Multi Timeframe is a professional trading indicator built on Smart Money Concepts (SMC) , combining market structure analysis with a No Repaint BUY / SELL signal system in a single indicator. It helps traders understand market structure more clearly, identify key price zones, and focus on higher-quality trading opportunities. By combining Multi-Timeframe Analysis , Points of Interest (POIs) , and real-time signals, th
SuperScalp Pro
Van Minh Nguyen
4.69 (29)
SuperScalp Pro – 专业多层共振剥头皮交易系统 SuperScalp Pro 是一款专业的多重共振剥头皮交易系统,旨在帮助交易者识别更高概率的交易机会,提供更清晰的入场确认、基于 ATR 的止损(Stop Loss)和止盈(Take Profit)水平,以及适用于 XAUUSD、BTCUSD 和主要外汇货币对的灵活信号过滤功能。 完整使用文档可在产品博客查看: [User Guide] 支持通过 SuperScalp Pro Auto Trader EA 进行自动交易: [Auto Trader] 基于 SuperScalp Pro 交易逻辑开发的黄金自动剥头皮 EA: [SuperScalp Gold] SuperScalp Pro 集成了 Supertrend、VWAP、EMA、RSI、ADX、成交量分析、布林带(Bollinger Bands)以及 MACD 背离分析,用于过滤低质量交易机会,减少虚假突破信号,并提高入场精准度。 SuperScalp Pro 专为 XAUUSD、BTCUSD 以及主要外汇货币对优化设计,通过基于 ATR 的波动率逻辑和规则化信
Entry Points Pro for MT5
Yury Orlov
4.5 (147)
传奇回归:Entry Points Pro 10。 这款传奇指标曾 3 年稳居 MQL5 Market 前三,如今全面重启。 数百条热情好评(两个版本合计 589 条),每天有数千名交易者用它交易,演示版下载 31,000+   MT4+MT5  次。 五年来我读过你们的每一条评价——在第 10 版里,我没有给出许诺,而是把答案直接做进了产品。指标作者自 1999 年入市, 珍视诚信、自己的声誉和自己的客户 。 Entry Points Pro 给出的入场信号严格不重绘。 而且这一次不再只是作者的一面之词,而是可验证的事实:确认信号只在 K 线收盘后标出,自动化测试记录到 零重绘 (在 EURUSD、XAUUSD 和 BTCUSD 上共 2,486,568 次不变量检查——0 次违规)。测试方法完全公开——您可以在策略测试器中自行复现。 购买后请务必第一时间给我发私信。 我会发给您 扩展版说明书《交易者圣经》 ——使用本指标交易的完整指南——并告诉您如何免费获得 赠品:市场扫描器 ,它能同时分析多个品种和多个时间周期,并在一个界面上显示 Entry Points Pro 此刻在哪里表现
Gold Entry Sniper
Tahir Mehmood
5 (16)
Gold Entry Sniper – 专业多周期ATR黄金交易仪表盘,适合黄金剥头皮与波段交易 Gold Entry Sniper 是一款先进的 MetaTrader 5 指标,旨在为 XAUUSD 及其他品种提供精准的 买/卖信号 。基于 ATR 移动止损逻辑 和 多周期分析仪表盘 ,适合剥头皮交易者与波段交易者,帮助识别 高概率黄金入场点 。 主要功能与优势 多周期信号分析 – 同时显示 M1、M5、M15 趋势方向。 基于ATR的动态止损 – 根据波动性自动调整。 专业图表仪表盘 – 展示信号状态、ATR水平、线性回归中线和交易方向。 清晰买卖标记 – 自动箭头与文字标签提示。 离场提示与交易管理 – 自动检测离场信号锁定利润。 全面自定义 – 调整仪表盘位置、颜色、字体及参数。 专为黄金优化 – 适用于 M1至M15 黄金剥头皮 ,也适合外汇、指数与加密货币。 为什么选择 Gold Entry Sniper? 为追求 快速、精准、可视化交易决策 的交易者打造,ATR 与多周期确认结合,帮助你抓住 最佳黄金入场点
Neuro Poseidon MT5
Daria Rezueva
4.73 (55)
Neuro Poseidon is a new indicator by Daria Rezueva. It combines precise trading signals with adaptive TP/SL levels - creating best possible trades as a result! Message me and get  Neuro Poseidon Assistant  as a gift to automize your trading process! What makes it stand out? 1. Proven profitability on all assets and timeframes 2. Only confirmed BUY and SELL signals present on the chart 3. Adaptive TP & SL levels generated by the software for each trade 4. Easy to understand - suitable for al
M1 Quantum MT5
Hamed Dehgani
4.6 (10)
使用 M1 Quantum 的实盘交易信号 : 信号 (交易由 Quantum Trade Assistant 自动 执行,并作为本产品 免费 提供。) 价格计划: 当前价格: $169 (早期用户优惠) 下一阶段计划价格: $189 计划零售价: $299 开发者提示: 购买后请联系我,以获取 最新推荐的参数设置文件(Set File) 、交易建议,以及加入 VIP 支持群组 ,与其他 M1 Quantum 用户交流经验。 常见问题 - 设置文件 - 安装指南 M1 Quantum 是一款专业的 M1 交易系统,提供快速且精准的交易信号,并内置止损(Stop Loss)、止盈(Take Profit)以及智能资金管理功能。 M1 Quantum 包含专业的资金管理系统,通过专注于 连续盈利交易 ,帮助交易者更快地增长账户资金。 M1 Quantum 指标 的主要特点 专为 M1 时间周期 和所有 主要货币对 设计 所有交易均配备止损和止盈 内置 资金管理功能 ,并指导交易者轻松执行交易计划 高胜率,高比例的 连续盈利交易 无重绘,无延迟 适合各种类型的交易者,简单易懂 要使用 M
Divergence Bomber
Ihor Otkydach
4.9 (92)
购买该指标的每位用户将额外免费获得以下内容: 原创工具“Bomber Utility”,该工具会自动跟踪每一笔交易,设置止损和止盈点,并根据策略规则自动平仓; 适用于不同交易品种的指标设置文件(Set 文件); 三种不同风险模式下的 Bomber Utility 设置文件:“最低风险”、“平衡风险” 和 “观望策略”; 一套详细的 视频操作手册,帮助您快速完成安装、配置并开始使用本交易系统。 注意: 要获取以上所有赠品,请通过 MQL5 的私人消息系统联系卖家。 我为您介绍原创的自定义指标 “Divergence Bomber”(背离轰炸机),它是一套基于 MACD 背离交易策略 的“全功能”交易系统。 该技术指标的主要任务是识别 价格与 MACD 指标之间的背离,并发出交易信号(包括推送通知),指示未来价格可能的运动方向。平均而言,这些信号的准确率超过 98%。有关该指标如何工作的详细说明,请观看本页面上的视频演示。 该系统使用 止损订单 和 动态回撤平仓机制 来管理交易。 Divergence Bomber 指标的主要特点: 支持交易的品种: AUDCAD、AUDCHF、AUDSG
Atomic Analyst MT5
Issam Kassas
4.37 (46)
本产品已针对 2026 年市场进行更新,并针对最新 MT5 版本进行了优化。 价格更新通知: Atomic Analyst 目前价格为 $99 。 接下来的 30 次购买 后,价格将上涨至 $199 。 特别优惠: 购买 Atomic Analyst 后,请发送私信给我,即可免费领取 Smart Universal EA ,并将您的 Atomic Analyst 信号转换为自动交易。 Atomic Analyst 是一款不重绘、不回绘、不延迟的 Price Action 交易指标,专为手动交易、清晰信号和 EA 自动化而设计。 User manual: settings, inputs and strategy.   &   User Manual PDF . 它分析价格行为、强度、动能、多周期方向和高级过滤器,帮助交易者减少噪音,避免弱势交易机会,并做出更有结构的交易决策。 该指标将复杂的市场计算转换为简单的视觉信号、彩色K线、趋势读数、止损水平和多个止盈区域,使交易者能够快速理解并应用于真实市场环境。 主要交易用途: 剥头皮和日内交易: 专为快速决策、清晰箭头、提醒、K线颜色和
Gann Made Easy MT5
Oleg Rodin
5 (8)
Gann Made Easy   是一个专业且易于使用的外汇交易系统,它基于使用先生理论的最佳交易原则。 W.D.江恩。该指标提供准确的买入和卖出信号,包括止损和获利水平。您甚至可以使用推送通知在旅途中进行交易。 购买后请联系我,即可免费获得交易指导和超棒的额外指标! 您可能已经多次听说过江恩交易方法。通常 Gann 的理论不仅对于新手交易者而且对于那些已经有一定交易经验的人来说都是非常复杂的东西。这是因为江恩的交易方法在理论上并不那么容易应用。我花了几年时间来完善这些知识,并将最好的原则应用到我的外汇指标中。 该指标非常易于应用。您所需要的只是将其附加到您的图表并遵循简单的交易建议。该指标不断进行市场分析工作并寻找交易机会。当它检测到一个好的入口点时,它会为您提供一个箭头信号。该指标还显示止损和获利水平。 换句话说,当您像先生一样进行交易时,该指标会为您提供最佳江恩建议。江恩亲自告诉你此时此刻该做什么。但最好的部分是您不需要了解任何有关江恩交易原则的知识,因为该指标会为您完成整个市场分析工作。
GoldenX Entry MT5
Kareem Abbas
5 (14)
GoldenX Entry 是一款用于 MT5 的指标,包含自适应 Smart Entry Trend 算法、信号评分系统、市场状态识别器以及波动率过滤器。每个信号都包含计算得出的入场位、三个止盈位(TP1、TP2、TP3)以及止损位。它基于多个分析层构建,旨在适应不同市场条件,将多层分析系统与内置优化器及统计跟踪系统相结合。该指标基于风险收益比(RR)指标和历史交易行为提供量化分析。 开始使用非常简单——在所选时间周期上运行优化器,然后在图表上开始使用该指标。 核心功能 GoldenX Entry 将信号引擎与内置交易管理及历史统计跟踪整合在同一图表中: - 内置优化器: 优化器可在图表上单击运行。它通过两阶段搜索流程测试200种参数组合——先进行探索,再进行优化——并在完成后自动应用选定配置。结果会按时间周期缓存,因此当返回已优化的周期时,会立即恢复相同设置。 - 黄金品种自动周期识别: 将指标加载到任何 XAUUSD 图表(M1 到月线)。系统会自动识别当前周期并加载对应预设。共包含9个时间周期配置文件,专为黄金在标准周期上优化设计。切换周期时,参数会自动调整。 - 资金参考面
Power Candles MT5
Daniel Stein
5 (9)
Power Candles V3 - 自我优化的强度指标 Power Candles V3 把货币与品种的强度直接转化为图表上可执行的交易方案。指标不再仅根据强度给K线着色,而是在后台持续运行实时自动优化,为您正面对的品种给出最佳 Stop Loss、Take Profit 与信号阈值。一键采用,Entry、Stop Loss、Take Profit 线就以精确价格绘制在图表上,提醒消息中直接包含方向。 本工具是 Stein Investments 生态系统的一部分 - 18+ 款工具,加上 Max,您的一对一 AI 交易导师。  随时在线,深入了解每一款指标,在您需要梳理思路的那一刻就在那里。  立即认识他: https://stein.investments 每根收盘K线运行 3,000+ 次交易模拟。9 种强度状态。2 种策略并行测试。一键采用最优配置。 为什么需要这个 大多数强度指标只给您一个数值,然后留下三个问题:相信哪个阈值、用哪个 Stop Loss、走哪个交易方向。Power Candles V3 在每根收盘K线上自动回答这些问题。结果就是一个完整的交易方案 -
Crystal Heikin Ashi Signals
Muhammad Jawad Shabir
5 (2)
Crystal Heikin Ashi Signals - Professional Trend & Signal Detection Indicator Advanced Heikin Ashi Visualization with Intelligent Signal System for Manual & Automated Trading Final Price: $149 ---------> Price goes up $10 after every 10 sales . Limited slots available — act fast . Overview Crystal Heikin Ashi Signals is a professional-grade MetaTrader 5 indicator that combines pure Heikin Ashi candle visualization with an advanced momentum-shift detection system. Designed for both manual traders
UZFX {SSS} 超短线智能信号 v4.0 MT5 是一款无重绘的高性能交易指标,专为在快速波动的市场中需要精准、实时信号的超短线交易者、日内交易者和波段交易者设计。该指标由 (UZFX-LABS) 开发,融合了价格行为分析、趋势确认和智能过滤技术,可在所有货币对和时间周期内生成高概率的买卖信号、预警信号以及趋势延续机会。 别再对交易犹豫不决了,开始遵循这一专为追求清晰、精准和纪律性市场执行的交易者设计的结构化信号系统吧。 我的建议* 最佳时间周期:15分钟及以上。 {H1} 是我的最爱。而且效果令人惊叹……!! 更新后的主要功能 • 自动买入和卖出信号检测 • 先进的反转识别逻辑 • 潜在市场反转前的早期预警信号 • 趋势延续确认信号 • 内置风险管理功能,包含入场点、止损点、TP1、TP2和TP3水平 • 完全可自定义的风险回报比 • 实时警报、声音提醒和移动端推送通知 • 带交易建议的专业信息面板 • 适用于所有MT5交易品种和时间周期 • 界面简洁、轻量且用户友好 为什么交易者选择 UZFX SSS? 大多数交易者亏损的原因在于入场过晚、平仓过早,或者缺乏明确的交
Trend Catcher ind mt5
Ramil Minniakhmetov
5 (16)
趨勢捕捉指標 趨勢捕捉指標結合了作者獨有的客製化自適應趨勢分析指標,用於分析市場價格趨勢。它透過過濾掉短期噪音,並專注於潛在的動能強度、波動性擴張和價格結構行為,來識別真實的市場方向。此外,它還結合了平滑和趨勢過濾等客製化指標,例如移動平均線、相對強弱指標 (RSI) 和波動率過濾器。 您可以在這裡查看實際運行情況以及我的其他產品: https://www.mql5.com/en/users/mechanic/seller 請注意,我不會在 Telegram 上出售 EA 或任何設置,那是騙局。所有設定都可以在我的部落格上免費取得。 重要提示!購買後請立即聯繫我,以獲取使用說明和額外獎勵! 請注意,我不會在 Telegram 上出售 EA 或任何設置,那是騙局。所有設定都可以在我的部落格上免費取得。
Zoryk Gold
Reda El Koutbane
5 (3)
ZORYK — MetaTrader 5 专用高级 XAUUSD 黄金信号系统 你一定熟悉这种感觉。 你花了很多时间分析黄金,等待合适的入场机会。终于开仓后,价格却立刻朝相反方向移动。你过早平仓、移动止损,或者只犹豫了几秒钟。随后,市场却在没有你的情况下到达了你原本预期的目标。 问题并不总是方向判断错误。 真正的问题是缺乏确定性。 你不知道准确的入场位置在哪里。 你不知道什么时候交易逻辑已经失效。 你不知道应该先锁定较近的利润,还是继续等待更大的行情。 你也不知道当前信号是否足够强,还是自己只是在强行寻找交易机会。 黄金市场变化非常快。一个没有明确计划的好想法,可能在几秒钟内变成错误的交易决定。 ZORYK 正是为了解决这个问题而开发。 什么是 ZORYK ZORYK 是一套完整的 XAUUSD 黄金信号与交易计划系统,专门为 MetaTrader 5  和 M5 时间周期 开发。 它不是一个只显示 BUY 或 SELL 箭头,然后让你独自决定其余所有内容的简单指标。 每个确认后的信号都可以在图表上显示完整的可视化交易计划,包括: 入场位置 止损位置 第一止盈 主要止盈 延续目标 风险
ARIPoint
Temirlan Kdyrkhan
1 (1)
ARIPoint is a powerful trading companion designed to generate high-probability entry signals with dynamic TP/SL/DP levels based on volatility. Built-in performance tracking shows win/loss stats, PP1/PP2 hits, and success rates all updated live. Key Features: Buy/Sell signals with adaptive volatility bands Real-time TP/SL/DP levels based on ATR Built-in MA Filter with optional ATR/StdDev volatility Performance stats panel (Success, Profit/Loss, PP1/PP2) Alerts via popup, sound, push, or email Cu
Quantum TrendPulse
Bogdan Ion Puscasu
5 (25)
介绍 Quantum TrendPulse   ,这是一款终极交易工具,它将 SuperTrend   、   RSI 和 Stochastic 的强大功能整合到一个综合指标中,以最大限度地发挥您的交易潜力。该指标专为追求精准和效率的交易者而设计,可帮助您自信地识别市场趋势、动量变化以及最佳进入和退出点。 主要特点: 超级趋势整合: 轻松跟随当前的市场趋势并乘上盈利浪潮。 RSI 精度: 检测超买和超卖水平,非常适合把握市场逆转时机,可用作 SuperTrend 的过滤器 随机精度: 利用随机振荡在波动的市场中寻找隐藏的机会, 用作超级趋势的过滤器 多时间范围分析: 从 M5 到 H1 或 H4,在不同时间范围内关注市场动态。 可定制的警报: 当您的自定义交易条件得到满足时收到通知,这样您就不会错过任何交易。 无论您是新手还是经验丰富的交易员,   Quantum TrendPulse 都能为您提供所需的优势,帮助您增强策略并自信地进行交易。借助这一强大的指标,将洞察力转化为利润 — 掌控您的交易! ***购买 Quantum TrendPulse,即可免费获得 Quantum Tr
Gem SIGNAL
Shengzu Zhong
5 (1)
GEM Signal Pro GEM Signal Pro 是一款適用於 MetaTrader 5 的趨勢跟隨指標,專為希望在圖表上獲得更清晰訊號、更有結構的交易設定,以及更實用風險管理的交易者而設計。 它不僅僅顯示一個簡單的箭頭,GEM Signal Pro 還能以更清晰、更易讀的方式呈現完整的交易思路。當條件確認完成後,指標可在圖表上顯示進場價、止損價與止盈目標,幫助交易者更有效率地評估交易設定。 運作方式 該指標首先根據其內部邏輯識別有效的初始訊號。 當確認條件滿足後,GEM Signal Pro 會在圖表上顯示完整的交易設定。這讓交易者可以更清楚地看到交易結構,並減少手動分析與計算的工作量。 圖表上的交易價位 對於已確認的訊號,GEM Signal Pro 可顯示: 進場價 止損價 止盈 1 止盈 2 止盈 3 風險報酬比 這讓交易設定更容易理解,也有助於讓圖表分析更有條理。 內建風險管理 風險管理是此指標設計的重要部分。 止損位基於近期市場結構,結合附近的擺動高低點與可選的 ATR 緩衝距離。這能讓交易價位更貼近當前市場條件,而不只是依賴固定距離。 圖表資訊面板 GEM Si
The Oracle Pro
Ottaviano De Cicco
5 (1)
The Oracle Pro:用于 MT5 的合成多周期偏向引擎 ️ 夏季上市优惠 — 早期买家可以 199 USD 获得 The Oracle Pro。价格将随关注度上升;最终价格 399 USD。 The Oracle Pro 是一款面向高要求与专业交易者的 MetaTrader 5 高级多周期 偏向引擎 。它以纪律回答一个问题:当前每个周期的方向偏向是什么、强度如何、各周期之间的一致程度如何?一切仅在已收盘的 K 线上计算——绝不重绘。 The Oracle Pro 是一套多因子共识系统。它将专有指标与优化算法整合为单一而精密的共识向量,并在单个指标实例内,跨当前周期与更高周期的堆栈进行读取——而不是在多个图表上堆叠互不相关的工具。 它是 Oracle 共识方法的专业进化版:完整重建为高级操作控制台,面向希望在一个纪律化工作流中获得深度、多周期背景与背离洞察的交易者。 是偏向引擎,而非信号生成器 The Oracle Pro 明确自身定位。它是一款提供纪律化方向背景的 多周期多因子偏向指标 。它 不是 信号生成器:不承诺入场、出场或盈利。偏向是背景——你在其方向上交易自己的设置
介绍     Quantum Breakout PRO   ,突破性的 MQL5 指标,正在改变您交易突破区域的方式!由拥有超过13年交易经验的资深交易员团队开发,     量子突破 PRO     旨在通过其创新和动态的突破区域策略将您的交易之旅推向新的高度。 量子突破指标将为您提供带有 5 个利润目标区域的突破区域的信号箭头,以及基于突破框的止损建议。 它既适合新手交易者,也适合专业交易者。 量子 EA 通道:       点击这里 重要的!购买后请私信我领取安装手册。 建议: 时间范围:M15 货币对:GBPJPY、EURJPY、USDJPY、NZDUSD、XAUUSD 账户类型:ECN、Raw 或 Razor,点差极低 经纪商时间:GMT +3 经纪商:IC Markets、Pepperstone with Raw 和 Razor 的点差最低 规格: 不重漆! 最多 5 个建议利润目标区域 建议止损水平 可定制的盒子。您可以设置自己的 Box Time Start 和 Box Time End。 接触 如果您有任何疑问或需要帮助,请通过私人消息与我联系。
DayTrader PRO
Davit Beridze
5 (2)
DayTrader PRO DayTrader PRO 是一款先进的交易指标,它结合了约翰·埃勒斯 (John Ehlers) 的 Laguerre 滤波器与强大的自动优化引擎。该指标不依赖固定的参数,而是根据最新的市场状况自动搜寻最佳设置,帮助您在无需手动调整的情况下适应不断变化的市场波动。 该指标可生成清晰的买入 (BUY) 和卖出 (SELL) 信号,并提供根据当前市场波动率计算得出的自适应止损 (Stop Loss) 和止盈 (Take Profit) 水平。内置的趋势、效率系数 (Efficiency Ratio)、波动率和蜡烛图过滤功能,有助于剔除低质量的交易设置,从而提高信号的准确性。 实时性能面板会显示当前已优化的设置、利润因子 (Profit Factor)、胜率 (Win Rate)、回撤 (Drawdown) 以及其他交易统计数据。DayTrader PRO 还支持弹出窗口、推送、邮件和声音提醒,确保您不会错过任何交易机会。 主要功能 全自动参数优化 自适应买入与卖出信号 基于 ATR 的动态止损与止盈 支持每日、每周或每月重新优化 内置趋势与市场过滤功能 性能统
M1 Sniper MT5
Oleg Rodin
5 (4)
M1 SNIPER   是一款易于使用的交易指标系统。它是一个专为 M1 时间框架设计的箭头指标。该指标可以作为独立的系统在 M1 时间框架下进行剥头皮交易,也可以作为您现有交易系统的一部分使用。虽然该交易系统专为 M1 时间框架交易而设计,但它也可以用于其他时间框架。我最初设计此方法是为了交易 XAUUSD 和 BTCUSD。但我发现这种方法在其他市场交易中也同样有用。 指标信号既可以顺势交易,也可以逆势交易。我教授一种特殊的交易技巧,帮助您利用指标信号进行双向交易。该方法基于使用特殊的动态支撑位和阻力位区域。 购买后,您可以立即下载 M1 SNIPER 箭头指标。此外,我还为所有 M1 SNIPER 工具用户免费提供下方屏幕截图所示的 Apollo Dynamic SR 指标!这两个指标的组合可以帮助您更轻松、更准确地利用 M1 时间框架进行交易。 购买后请联系我,免费获取交易提示和奖励指标! 祝您交易成功!
本产品已针对 2026 年市场进行更新,并针对最新 MT5 版本进行了优化。 价格更新通知: Smart Price Action Concepts 目前价格为 $200 。 接下来的 30 次购买 后,价格将上涨至 $299 。 特别优惠: 购买后,请发送私信给我,即可领取 免费赠品 + 礼物 。 首先需要强调的是,这款交易工具是不重绘、不回绘、不延迟的指标,因此非常适合专业交易使用。 Online course , and manual Smart Price Action Concepts 指标是一款非常强大的工具,适合新手和有经验的交易者使用。它将 20 多个实用指标整合到一个系统中,结合了 Inner Circle Trader Analysis 和 Smart Money Concepts Trading Strategies 等高级交易理念。该指标专注于 Smart Money Concepts,帮助交易者理解大型机构如何交易,并辅助预测其市场行为。 它特别擅长流动性分析,使交易者更容易理解机构交易逻辑。它也非常适合预测市场趋势并仔细分析价格走势。通过让交易与机构策略保
FX Power MT5 NG
Daniel Stein
5 (33)
FX Power:分析货币强度,助您做出更明智的交易决策 概述 FX Power 是一款专业工具,帮助您全面了解主要货币和黄金在任何市场条件下的真实强度。通过识别强势货币用于买入,弱势货币用于卖出, FX Power 简化了交易决策,并帮助您发现高概率的交易机会。不论您是想跟随趋势还是通过极端的 Delta 值预测反转,这款工具都能完美适应您的交易风格。别再盲目交易——用 FX Power 让您的交易更加智慧。 1. 为什么 FX Power 对交易者极具价值 实时货币和黄金强度分析 • FX Power 实时计算并显示主要货币和黄金的相对强度,助您全面了解市场动态。 • 监控领先或落后资产,轻松识别值得交易的货币对。 全面的多时间框架视图 • 跟踪短期、中期和长期时间框架的货币和黄金强度,以便将您的交易策略与市场趋势保持一致。 • 无论是快进快出的短线交易还是更长期的投资策略, FX Power 都能为您提供所需的信息。 Delta 动态分析用于趋势和反转 • 极端 Delta 值常常预示反转机会,而平缓的 Delta 变化则确认趋势延续。 • 使用 Delta 分析,轻
Smc Pro ToolKit
Talal N Z Aljarusha
5 (3)
SMC Pro ToolKit  is a professional chart-based Smart Money Concepts indicator for MetaTrader 5. It helps traders read market structure, identify key liquidity areas, organize trade context, and plan setups directly from the chart. This is not a simple buy/sell arrow indicator. It is a complete visual trading toolkit that combines Smart Money Concepts, multi-timeframe analysis, session context, setup planning, risk assistance, and professional dashboard tools in one clean workspace. Watch setup
Btmm state engine pro
Garry James Goodchild
5 (4)
BTMM State Engine Pro is a MetaTrader 5 indicator for traders who use the Beat The Market Maker approach: Asian session context, kill zone timing, level progression, peak formation detection, and a multi-pair scanner from a single chart. It combines cycle state logic with a built-in scanner dashboard so you do not need the same tool on many charts at once. What it does Draws the Asian session range; session times can follow broker server offset or be set in inputs. Tracks level progression (L
SkyHammer Signal Pro Professional No-Repaint Trend Signal Indicator with Locked Entry, SL and TP Levels SkyHammer Signal Pro is a structured trend and momentum signal indicator designed for traders who want clear, fixed, and verifiable trading signals. It works best on lower timeframes such as M1 and M5 . The indicator does not try to predict tops or bottoms. Instead, it waits for confirmed market structure, trend direction, momentum strength, volatility quality, and target space before generati
作者的更多信息
Average Session Range: Calculate and Average the Sessions High-Low Range of Specific Time Sessions Over Multiple Days. The Session Average Range is a sophisticated and precise tool designed to calculate the volatility of specific time sessions within the trading day. By meticulously analyzing the range between the high and low prices of a defined trading session over multiple days, this tool provides traders with a clear and actionable average range. **Note:** When the trading platform is closed
FREE
Average Session Range MT4: Calculate and Average the Sessions High-Low Range of Specific Time Sessions Over Multiple Days. The Session Average Range is a sophisticated and precise tool designed to calculate the volatility of specific time sessions within the trading day. By meticulously analyzing the range between the high and low prices of a defined trading session over multiple days, this tool provides traders with a clear and actionable average range. **Note:** When the trading platform is cl
FREE
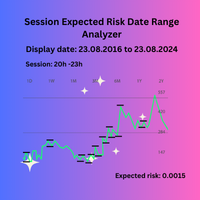
Session Expected Risk Date Range Analyzer:  Analyzes price data across specified date ranges to provide detailed insights into financial risk and volatility, using each bar's price metrics for accurate risk assessment. The Session Expected Risk Date Range Analyzer is a sophisticated tool designed to offer traders and analysts detailed insights into the expected financial risk across specific date ranges. Unlike traditional session-based analysis, this indicator focuses on calculating risk metr
FREE
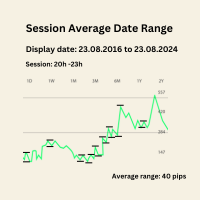
Session Average Date Range: Analyze and average the low - high of specific trading sessions within custom date ranges, offering insights into price movements and market behavior over selected periods. The "Session Average Date Range" tool is an advanced analytical utility designed to empower traders and analysts by allowing them to dissect and evaluate the high and low range of specific trading sessions within a user-defined date range. This tool provides a flexible and precise approach to analy
FREE
Session Average Date Range: Analyze and average the low - high of specific trading sessions within custom date ranges, offering insights into price movements and market behavior over selected periods. The "Session Average Date Range" tool is an advanced analytical utility designed to empower traders and analysts by allowing them to dissect and evaluate the high and low range of specific trading sessions within a user-defined date range. This tool provides a flexible and precise approach to analy
FREE
Session Expected Risk Date Range Analyzer:  Analyzes price data across specified date ranges to provide detailed insights into financial risk and volatility, using each bar's price metrics for accurate risk assessment. The Session Expected Risk Date Range Analyzer is a sophisticated tool designed to offer traders and analysts detailed insights into the expected financial risk across specific date ranges. Unlike traditional session-based analysis, this indicator focuses on calculating risk metr
FREE
Session Standard Deviation Date Range Analyzer: Evaluate the standard deviation of each bar's price (high, low, close, open, weighted, median, and typical) within defined trading sessions and date ranges, providing detailed insights into price volatility and market behavior. **Note:** When the trading platform is closed, the indicator may not load correctly. To ensure it works, you may need to load the indicator, unload it, and then load it again. **Note:** This indicator can only be used with
FREE
Symbol Swap Panel: Effortlessly switch the active symbol on your chart while simultaneously adding the new symbol to Market Watch. This tool ensures seamless integration and access to real-time market data, optimizing your trading workflow. **Note:**    When switching to a different symbol, it's recommended to switch back and forth between timeframes to ensure that the panel loads properly.   Description: The "Symbol Swap Panel" is a versatile utility designed for traders seeking to manage the
FREE
Symbol Swap Panel: Effortlessly switch the active symbol on your chart while simultaneously adding the new symbol to Market Watch. This tool ensures seamless integration and access to real-time market data, optimizing your trading workflow. Description: The "Symbol Swap Panel" is a versatile utility designed for traders seeking to manage their chart symbols and Market Watch more efficiently. This tool allows you to easily swap the current symbol on your chart while automatically adding the se
FREE
筛选:
无评论
回复评论