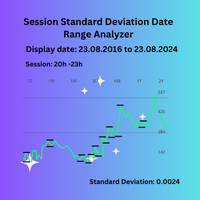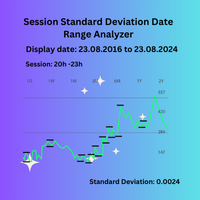
Session Standard Deviation Date Range Analyzer

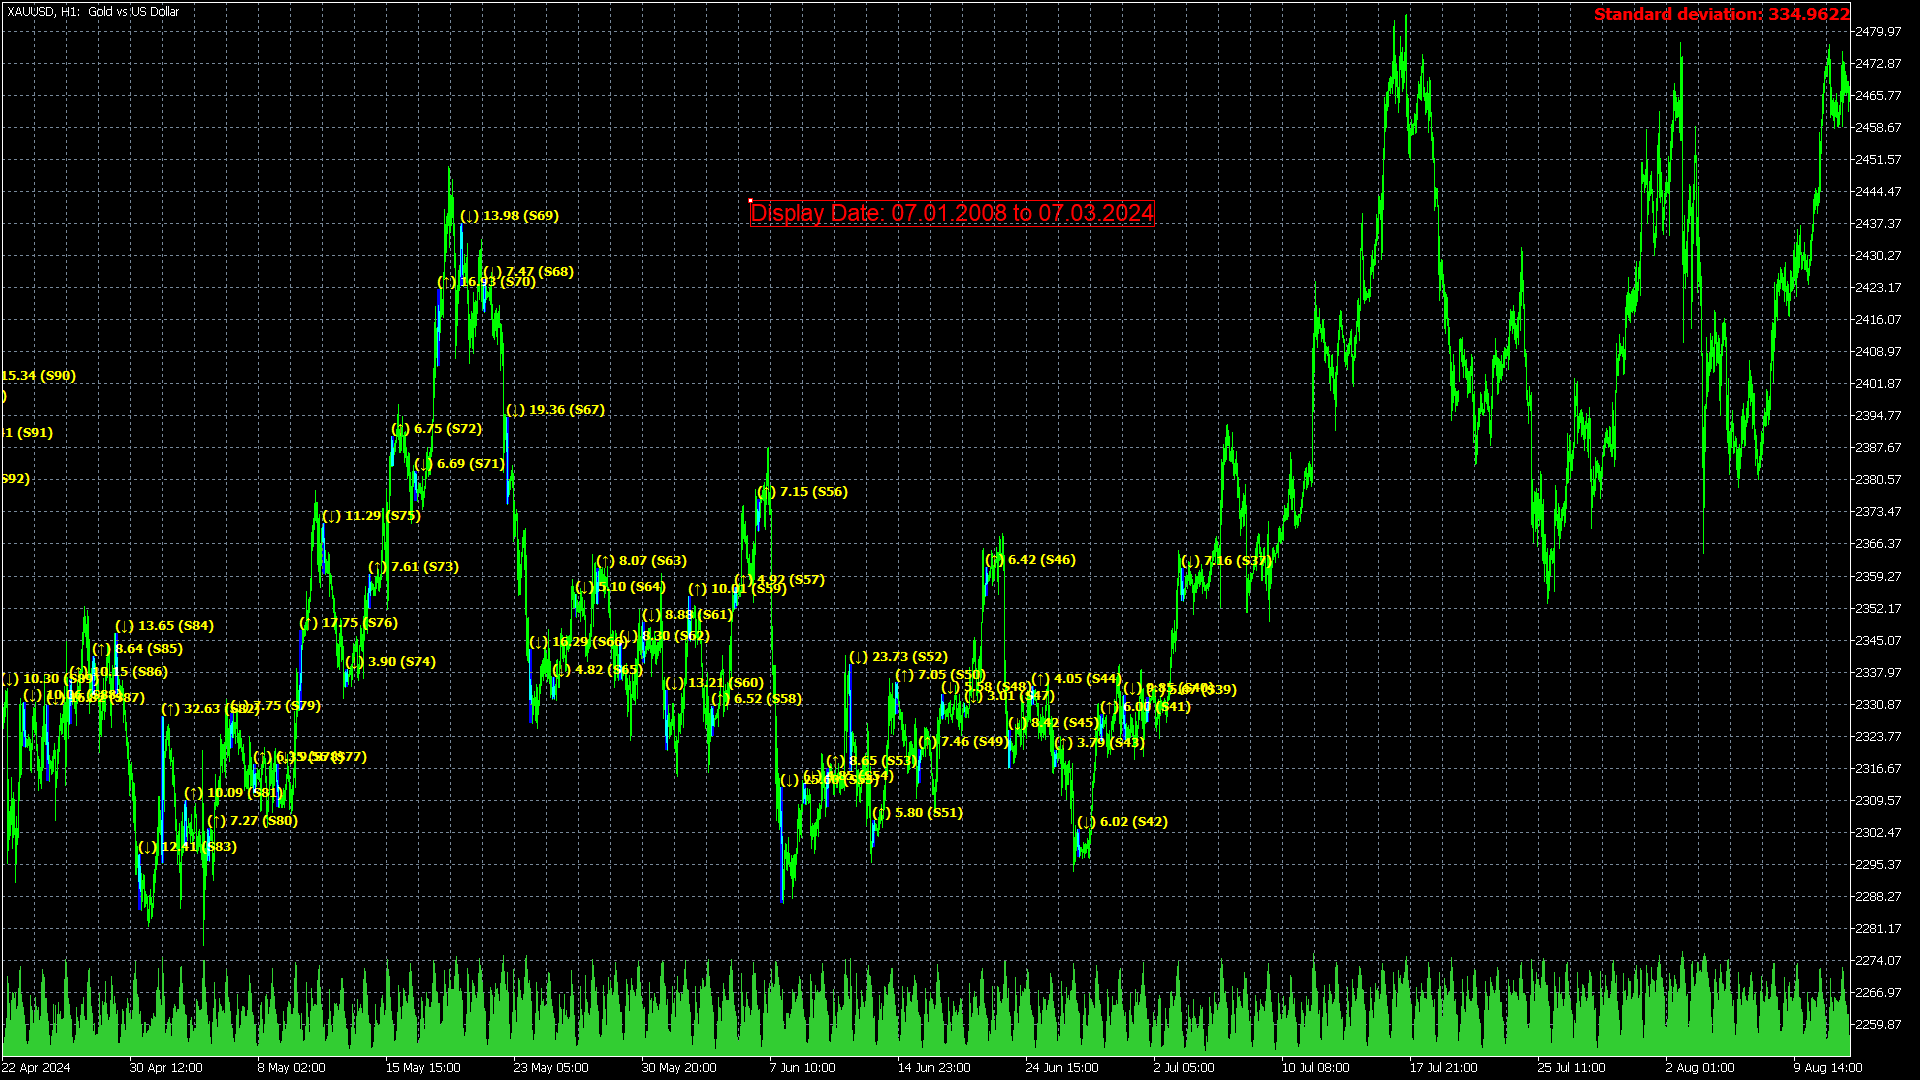
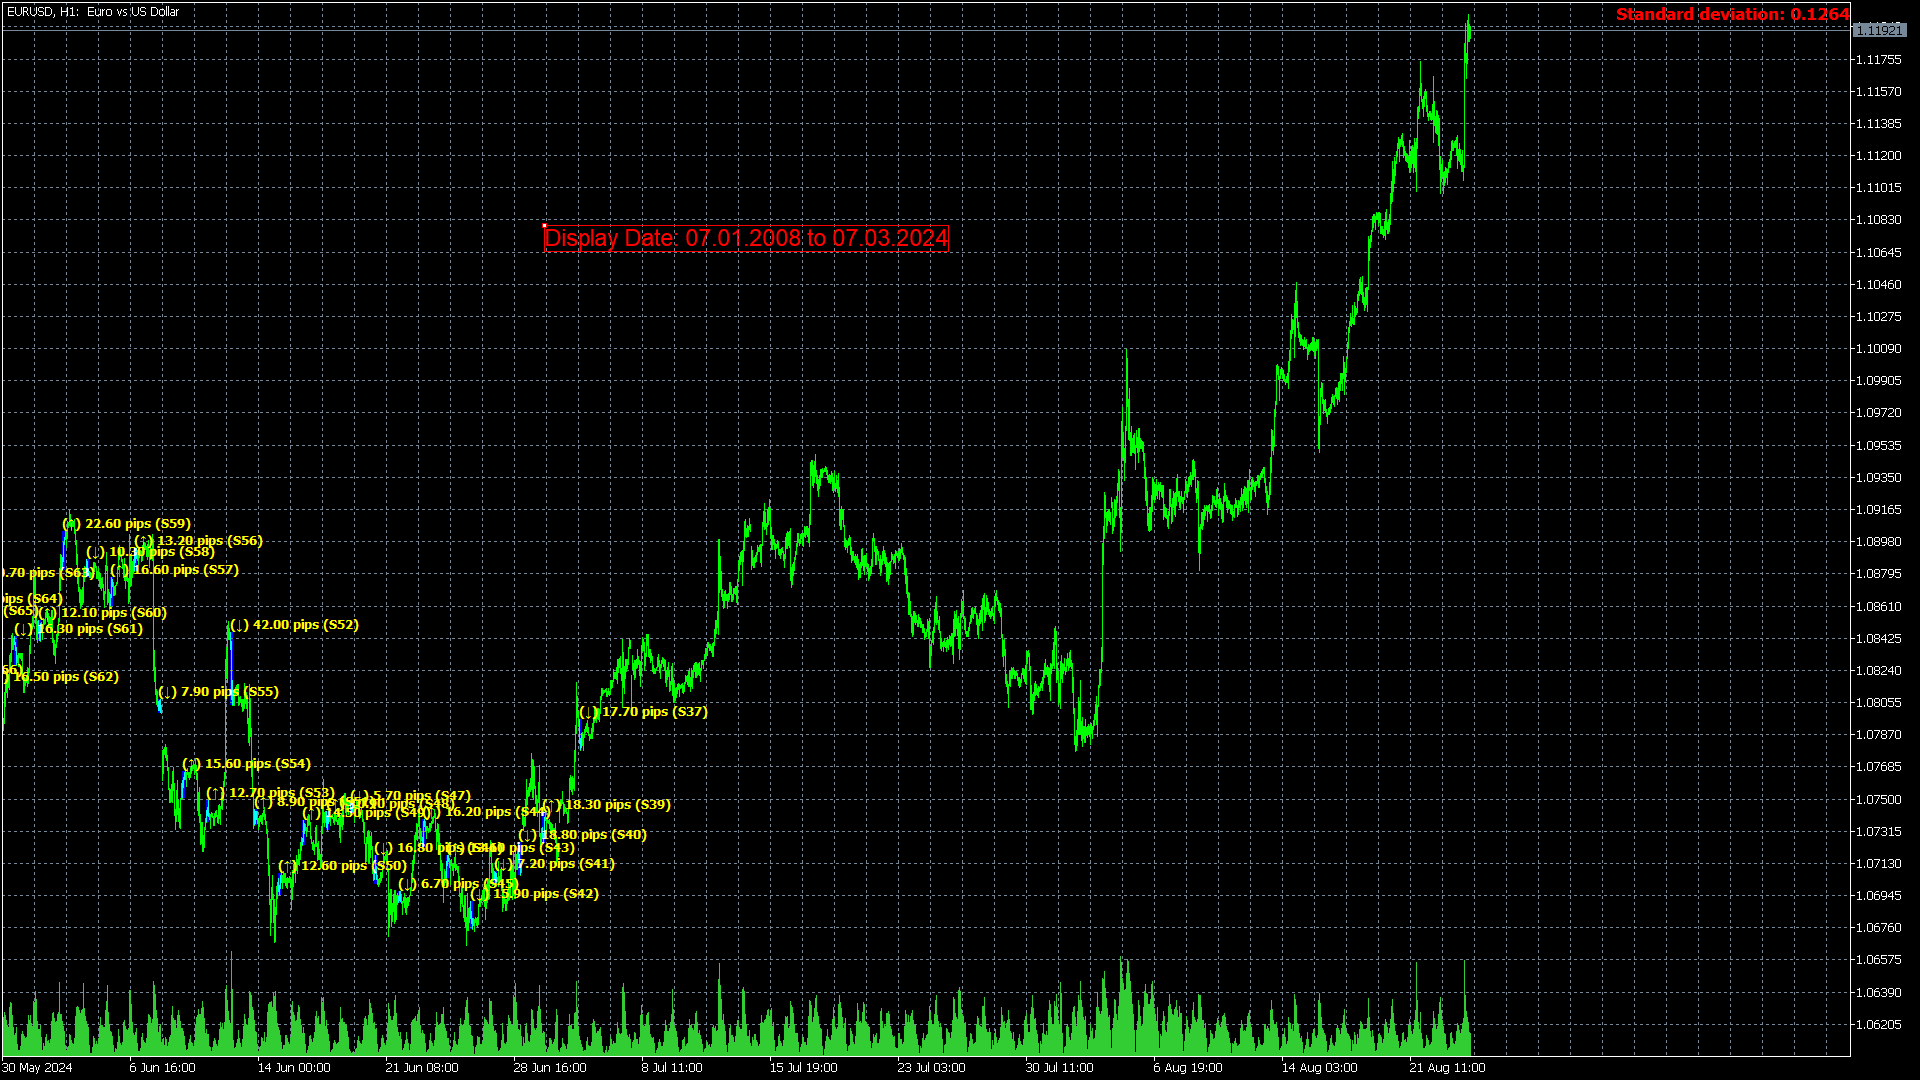
Session Standard Deviation Date Range Analyzer: Evaluate the standard deviation of each bar's price (high, low, close, open, weighted, median, and typical) within defined trading sessions and date ranges, providing detailed insights into price volatility and market behavior.

**Note:** When the trading platform is closed, the indicator may not load correctly. To ensure it works, you may need to load the indicator, unload it, and then load it again.

**Note:** : This indicator can only be used with historical data. It does not support real-time data analysis.

**Note:**  When switching to a different timeframe, it's recommended to switch back and forth between timeframes to ensure that all data loads properly. This process helps to fetch the necessary historical data, ensuring that calculations based on this data are accurate.
Description:

The "Session Standard Deviation Date Range Analyzer" is a sophisticated analytical tool crafted for traders and analysts seeking to evaluate price volatility across specific trading sessions within a user-defined date range. Unlike traditional indicators that focus solely on high and low prices, this tool provides a comprehensive analysis based on each bar’s price, including high, low, close, open, weighted, median, and typical prices. This detailed approach helps in understanding the standard deviation of price movements, offering deeper insights into market volatility and behavior over selected periods.

Key Features:

1. Customizable Time and Date Input:
   - Start Time and End Time: Users can specify the exact start and end times of the trading session they wish to analyze. This allows for precise examination of specific market hours, such as the New York session, or any other relevant time frame.
   - Start Date and End Date: Define the range of dates for analysis, enabling users to focus on particular periods, such as historical economic events or periods of significant market fluctuations.

2. Bar-Based Analysis:
   - The tool calculates standard deviation based on various bar prices, including high, low, close, open, weighted, median, and typical prices. This approach provides a nuanced view of price volatility by examining how each bar’s price contributes to the overall standard deviation within the selected session and date range.

3. Enhanced Volatility Insights:
   - By leveraging detailed price data, users can gain a deeper understanding of market volatility during specific sessions. This feature is particularly valuable for backtesting trading strategies or studying price behavior during critical historical periods.

4. Historical Data Analysis:
   - Users can analyze how price volatility has evolved over time by examining historical data. This is essential for understanding market dynamics and assessing the impact of significant events on trading sessions.

5. Application for Detailed Studies:
   - The tool supports both short-term and long-term analysis, making it suitable for users looking to study price volatility over various periods. Whether evaluating daily market movements or extended historical trends, the Session Standard Deviation Date Range Analyzer provides valuable insights.

Practical Use Case:

For a trader aiming to assess the volatility of the New York trading session during the financial crisis of 2007-2009, the Session Standard Deviation Date Range Analyzer can be utilized to input the exact start and end times for the New York session and set the relevant date range. The tool will then calculate and provide the standard deviation of prices based on each bar's price data, offering a detailed view of how market volatility behaved during these turbulent times.

This tool is designed for a wide range of users, from academic researchers to professional traders, by offering a detailed and customizable view of price volatility across specific sessions and date ranges. Its advanced analysis capabilities make it a valuable asset for anyone involved in price analysis and volatility assessment.

Note: The indicator is optimized for timeframes of H4 and below.

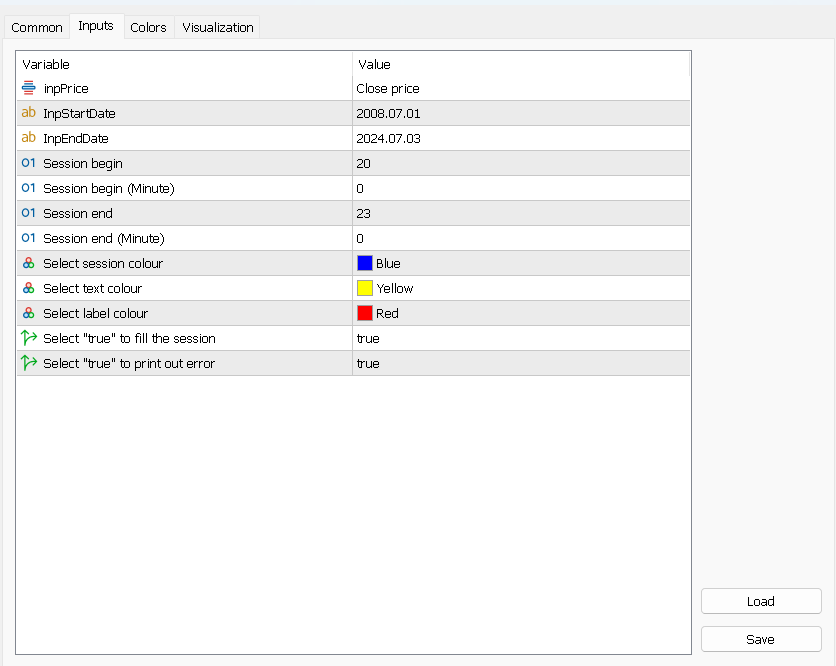
Main Inputs:

- InpPrice: Specifies the type of price used for standard deviation calculation within the selected session and date range. Options include:

  • High: Use the highest price of each bar.
  • Low: Use the lowest price of each bar.
  • Close: Use the closing price of each bar.
  • Open: Use the opening price of each bar.
  • Weighted: Use the weighted price of each bar.
  • Median: Use the median price of each bar.
  • Typical: Use the typical price of each bar.

- InpStartDate:Specify the starting date for the analysis period.
- InpEndDate: Define the ending date for the analysis period.
- SBegin (Broker time): Sets the starting hour of the session in 24-hour format.
- SBeginMinute (Broker time): Defines the starting minute of the session.
- SEnd (Broker time): Determines the ending hour of the session in 24-hour format.
- SEndMinute (Broker time): Specifies the ending minute of the session.
- SColor: Chooses the color for displaying the session on the chart.
- InpTextColor: Sets the color for the text displayed by the indicator.
- InpLabelColor: Defines the color for labels within the indicator.
- InpFill: Selects whether to fill the session area with color.
- InpPrint: Determines whether to print error messages to the log.
Produits recommandés
This indicator displays two important pieces of information on the MT5 chart: Current Spread - Trading cost measured in points, helping traders assess optimal entry timing when spread is low. Time Countdown - Remaining time (minutes:seconds) until the current candle closes and a new candle forms, supporting candle-based trading strategies. Information is displayed as compact text in a chart corner (default top-right), with customizable position, color, and font size. The indicator updates in rea
FREE
Pair it with the free Aurum Trade Planner to plan your trade at the session open, or Aurum Risk Manager Trade Panel for one-click orders. See the Asia, London and New York sessions at a glance: range boxes with their size in pips or points, optional ICT killzones and a live session panel that shows what is open now, how far it has moved and when the next session starts. Clean, automatic and correct for every broker time zone. SESSIONS - Asia, London and New York drawn as range boxes from the
FREE
TerminalBridge Account Analytics is an on-chart account statistics indicator for MetaTrader 5. It organizes closed trading activity into day, week, month, quarter and year views. Account-wide records include all symbols by default. Main features - Live floating profit or loss - Recorded daily maximum floating loss - Floating-loss percentage, occurrence time and data status - Today, All, Last 1 Month, Last 3 Months and Custom history ranges - Built-in calendar for custom date selection - Filt
FREE
Spread Monitor Pro
Simon Draxler
5 (1)
DRX SPREAD MONITOR est un utilitaire professionnel conçu pour visualiser et analyser les spreads des courtiers en temps réel. Il aide les traders à identifier les coûts cachés causés par l'élargissement des spreads lors d'événements d'actualité, de rollovers ou de sessions à faible liquidité. Cet outil est essentiel pour les Scalpers et les traders d'Or qui doivent assurer la qualité d'exécution et éviter d'entrer en position lorsque les coûts de trading sont statistiquement trop élevés. Fonctio
FREE
Introduction The Parabolic SAR (Stop and Reverse) indicator is a technical analysis tool designed to identify potential trend reversals and provide trailing stop-loss levels. This enhanced version of the standard Parabolic SAR for MetaTrader 5 offers improved visual clarity, customizable alerts, and an optional trend confirmation filter to assist traders in their analysis. Features Enhanced Visualization: Displays Parabolic SAR dots in two distinct colors (Lime for uptrends, Red for downtrends)
FREE
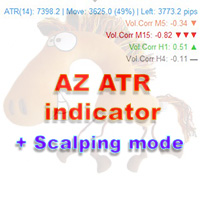
AZ ATR indicator (with volume correlation bonus) Standard ATR indicator, you can enable ignoring abnormally large candles. It is possible to change the location of the displayed text in 4 corners of the chart. You can change the calculation period (days ago). Bonus - the indicator has a correlation with volumes. Can be enabled to display a possible priority at the current moment in the market. What do the values ​​mean: Positive correlation (0.3 - 1.0): 0.3-0.7 - moderate connection
FREE
MT5 All Icons
Danny Giovanni Romero Lozano
MT5 All Icons is a high-utility developer tool designed to simplify the visual customization of indicators and Expert Advisors. It provides a comprehensive, interactive reference table of all 255 Wingdings symbols directly within a separate chart subwindow. Instead of guessing character codes or looking up external charts, this tool allows you to see every available icon, its visual representation, and its corresponding ID number in real-time. Key Features: Full Library Access: Displays the com
FREE
STO indicator
Murodil Eminjonov
STO & Système ZeroMax : Un algorithme révolutionnaire pour des sorties précises et des profits maximaux Vous en avez assez de perdre vos profits lors des fortes corrections du marché ? Vous en avez assez de deviner où clôturer une position pour profiter au maximum de la dynamique au lieu de sortir prématurément ? Découvrez STO, un oscillateur de phase et de momentum ultra-précis, intégré au système de trading professionnel ZeroMax. Cet outil analytique nouvelle génération est conçu pour le
FREE
Percent Change Dashboard
Strifor (Mauritius) Ltd
5 (4)
Percent Change Dashboard Percent Change Dashboard est un indicateur compact et intuitif pour MetaTrader 5 affichant en temps réel la variation en pourcentage du prix d’un instrument financier sur plusieurs unités de temps. ️ Fonctionnalités principales Variation horaire (%) Variation quotidienne (%) Variation hebdomadaire (%) Variation mensuelle (%) Avantages Compréhension immédiate de la force et de la direction du marché Utile pour les stratégies de tendance et de momentum C
FREE
WONNFX INFOLINE   MT5   is a lightweight informational indicator that displays key trading data directly on your chart. In a single line, it shows your current floating profit/loss in pips, deposit currency, and percentages, as well as the spread and time remaining until the current bar closes. This indicator is ideal for traders who need a concise yet comprehensive snapshot of their open positions in real-time, without cluttering the chart. Key Features Display of Floating Profit/Loss: In   pip
FREE
A chart overlay indicator for traders who want a structured view of Smart Money Concepts, market structure shifts, order block patterns, fair value gaps, equal highs and lows, and key multi-timeframe price levels directly inside MetaTrader 5. BOS and CHoCH · Internal and Swing Structure · Order Block Finder · Input-Controlled FVG Colors · EQH and EQL · Premium and Discount Zones Product Overview SMC Price Action Patterns is designed to convert raw price action into a clear, visual market map. T
FREE
Candle Timer and Spread and Session  in a smart way displays the remaining time before the current bar closes and a new bar forms and also the Current Session in place. It can be used for time management and at the same time you keep an eye on Spread changes and Session Change. Real-Time Edge in Your Trading: Candle Timer & Spread Overlay – FREE for a Limited Time! Smart Display of  Candle Timer and Spread and Session in a single place Lightning-Fast Candle Countdown Timer Instant Spread Monito
FREE
Stochastic   +   RSI   Multi-Timeframe   Dashboard   with   Momentum   Strength Need Trade Assistant? Trade Panel Pro MT 5 Please leave a review, if you like this.   OVERVIEW A   professional   multi-timeframe   dashboard   indicator   that   displays   Stochastic   Oscillator   and   RSI   (Relative   Strength   Index)   values   from   7   different   timeframes   simultaneously   on   a   single   compact   panel.   Perfect   for   scalpers   and   day   traders   who   need   quick   m
FREE
Stamina HUD
Michele Todesco
STAMINA HUD – Advanced Market & Trend Dashboard (MT5) STAMINA HUD   is a professional   market information panel   designed for traders who want   clarity, speed, and control   directly on the chart. It provides a   clean heads-up display (HUD)   with essential market data and   multi-timeframe trend direction , without cluttering the chart or generating trading signals. What STAMINA HUD Shows   Current Price   Spread (in real pips)   Today High–Low range (pips)   Average D
FREE
SmartWaterMark Essential
Rodolpho Miguel Sales Bueno
SmartWaterMark Essential est un indicateur de filigrane léger pour MetaTrader 5. Il ajoute un filigrane de symbole propre et centré sur votre graphique, ce qui permet d'identifier rapidement l'instrument actif. C'est particulièrement utile lorsque vous travaillez avec plusieurs graphiques, symboles ou unités de temps et que vous souhaitez garder un espace de travail plus organisé. Fonctionnalités: - Filigrane de symbole centré - Affichage optionnel de l'unité de temps sur les graphiques basés
FREE
Smart Grid MT5
Dmitry Kotov
5 (5)
Smart Grid MT5 automatically recognizes any symbol, period and scale of the chart and marks it up accordingly. It is possible to mark up the chart by trading sessions. The grid consists of the two main line types. Vertical lines There are two visualization methods: Standard - the lines are divided into three types, separating: Small time period. Medium time period. Large time period. Trading Session - the lines are divided into groups (a total of ten). Each group has two lines: the first is res
FREE
Chart Dashboard – Countdown, Symbol Info, Watchlist & Timeframe Switcher Chart Dashboard puts the things you check all day in one clean panel set on your chart: how long until the candle closes, the spread, bid/ask, today's change, server time and whether the market is open. It also adds a one-click watchlist and timeframe switcher. Everything is set up from a settings window right on the chart, so you never have to open the indicator's properties again. It is a utility. It does not open trade
FREE
Laguerre RSI Advanced Suite for MetaTrader 5 Take your technical analysis beyond standard oscillators with the Laguerre RSI Advanced Suite . Based on the work of John F. Ehlers, the Laguerre Relative Strength Index (RSI) is designed to provide superior smoothness and faster response times compared to the conventional Welles Wilder RSI. While the standard Laguerre RSI is a powerful tool, our Advanced Suite transforms it into a complete trading cockpit. It equips traders with a precision calcul
FREE
RM Sync Master
Mohammadreza Mahdi Mavaddat
5 (1)
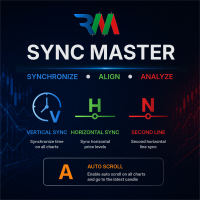
RM Sync Master - Multi-Chart and Multi-Timeframe Synchronization RM Sync Master is a free utility for MetaTrader 5 that synchronizes multiple open charts to the same market time and price reference. It is designed for traders who work with multiple timeframes or multiple symbols and need to examine the same market moment across several charts without manually scrolling and positioning each chart. How It Works RM Sync Master uses a synchronized vertical time line as a common reference between cha
FREE
Chart Symbol Changer for MT5
Juvenille Emperor Limited
5 (11)
Chart Symbol Changer pour MT5   est un indicateur/utilitaire qui vous offre la possibilité de changer le symbole graphique actuel qui est attaché en cliquant sur un bouton de symbole sur son panneau.   Chart Symbol Changer pour MT5   vous donne la possibilité de configurer les 32 boutons de symboles selon vos préférences personnelles, en ajoutant les paires que vous souhaitez surveiller et échanger le plus. De cette façon, vous ne manquerez jamais une opportunité, car vous pouvez avoir une vue
FREE
ZigZag Profile
Nguyen Thanh Cong
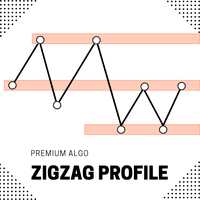
Introducing the ZigZag Profile — a powerful tool designed to identify high-probability pivot zones where price action frequently reverses. This indicator analyzes historical price data to pinpoint key areas where price has pivoted multiple times, providing traders with actionable insights into potential support and resistance levels. The ZigZal Profile  indicator continuously scans for zones where price has reversed direction the most, highlighting these critical areas on your chart. By focusing
FREE
Panel Indicator For MT5 Panel Indicator For MT5 est un indicateur visuel conçu pour MetaTrader 5 qui intègre toutes les informations essentielles sur le spread et les sessions de marché dans un panneau unique et compact. Positionné directement sur le graphique, il fournit au trader une lecture immédiate et actualisée en temps réel sans nécessiter l'ouverture de fenêtres supplémentaires ni la consultation de sources externes. Surveillance du spread en temps réel Le panneau affiche en continu la v
FREE
SM Zones
Arvydas Zukauskas
4.5 (2)
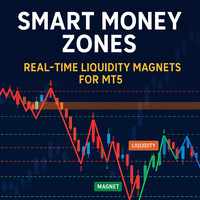
Developed according to the principles of smart money management strategies, the SM Zones indicator is a very convenient tool for traders on the MetaTrader 5 (MT5) platform. It graphically displays on the chart all the significant zones used in the SM strategy: market structure, price levels of increased liquidity, "price magnet" zones - imbalances, order blocks, fvg, breaker blocks and mitigation blocks - towards which the instrument's price moves. The zones influencing the bull market are high
FREE
The band on nearly every channel indicator you can download is sized by an ATR, while the line running down the middle of it comes from something else entirely. Two filters, two different lags, stapled together. The join is where the false signals live. This one runs the true range through the same Gaussian filter as the price, at the same pole count and the same period. The band and the centre line turn on the same delay, because they are the same filter fed different data. Where the usual vers
Funded Risk Console — read-only account monitor A compact, always-visible panel that shows exactly where you stand against your funded-account limits — before you open the next trade, not after. It does not place, modify, or close any trade. It only reads account and position data your terminal already has. What it shows Daily loss and maximum drawdown, in both dollars and percent of limit used Profit target progress in dollars and percent Per-position stop-loss and take-profit projection in dol
Rating Meter : une évaluation consolidée de 26 indicateurs Rating Meter calcule pour vous les signaux de 26 indicateurs populaires et les regroupe en une évaluation simple « vendre / neutre / acheter ». Inutile d'ouvrir les fenêtres de chaque indicateur et de comparer les valeurs à la main. Un seul coup d'œil au panneau montre vers quel côté le marché penche sur l'unité de temps sélectionnée. Our products: https://www.mql5.com/en/users/trendhunter/seller Ce qu'affiche le panneau Jauge Oscillator
FREE
USDJPY Keltner Range M15 Strategy is a fully automated MetaTrader 5 strategy designed to capture structured breakout opportunities on USDJPY using daily directional confirmation, Keltner Channel reference levels, volatility-buffered pending STOP entries and simple fixed-risk management. The strategy is designed for USDJPY on the M15 timeframe. Its goal is to participate when the market shows directional intent through daily high or daily low behavior, while using Keltner Channel structure and
FREE
High Time Candlestick Chart Visualize the current higher-timeframe candle directly on your lower-timeframe chart. This indicator projects the OHLC data of a selected higher timeframe ​ (M15, H1, H4, D1, or W1) onto your current chart as a graphical candlestick, offset to the right of the live price area. It helps you keep the bigger-picture candle structure in view without switching timeframes. Features Graphical HTF candle : Body, upper wick, and lower wick drawn as chart objects, colored by bu
FREE
Multi Currency Strength Dashboard Mini (FREE) – Currency Strength Meter for MetaTrader 5 Multi Currency Strength Dashboard Mini est un indicateur gratuit pour MetaTrader 5 qui affiche en temps réel la force relative des 8 devises majeures (USD, EUR, GBP, JPY, CHF, CAD, AUD, NZD) sous forme de tableau de bord clair et rapide à lire. Objectif : repérer en quelques secondes les devises fortes et faibles afin d'orienter votre watchlist (par exemple, sélectionner des paires où une devise forte fait f
FREE
Time Session OHLC Mt5
Hiren Parekh
4.92 (12)
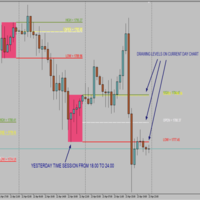
Time Session OPEN-HIGH-LOW-CLOSE This Indicator Will Draw Lines Of OHLC Levels Of Time Session Defined By User. It Will Plot Floating Lines On Current Day Chart. Time Session Can Of Current Day Or Previous Day. You Can Plot Multiple Session Lines By Giving Unique ID To Each Session. It Can Even Show Historical Levels Of Time Session Selected By User On Chart To Do Backdating Test. You Can Write Text To Describe The Lines.
FREE
Les acheteurs de ce produit ont également acheté
Trend Sniper X
Sarvarbek Abduvoxobov
4.9 (42)
Trend Sniper X est un indicateur de suivi de tendance multi-unités de temps pour MetaTrader 5 qui aide les traders à identifier la direction de la tendance et les points d'inversion potentiels avec clarté et précision. pour MT4: https://www.mql5.com/en/market/product/193245 Informations sur le prix : Le prix actuel est un prix promotionnel et est susceptible de changer lors des prochaines mises à jour et nouvelles fonctionnalités. Offre bonus : Pour obtenir GRATUITEMENT l'Auto-Trade Assistant E
Smart Trend Trading System — MetaTrader 5 Après votre achat, envoyez-moi un message sur MQL5 pour recevoir GRATUITEMENT Smart Universal Expert Advisor, ainsi que le cours en ligne, le manuel PDF et l’accès au groupe privé. STTS réunit la direction de la tendance, les signaux d’entrée et de sortie, les zones de retournement et les niveaux de prix importants directement sur votre graphique. Suivez le système manuellement ou connectez un EA compatible distinct pour une exécution automatique selon l
Zoryk Gold
Reda El Koutbane
4.76 (17)
ZORYK — Système avancé de signaux XAUUSD pour MetaTrader 5 Vous connaissez certainement cette sensation. Vous passez du temps à analyser l’or. Vous attendez le bon point d’entrée. Vous ouvrez enfin la position, puis le prix commence immédiatement à évoluer contre vous. Vous fermez trop tôt, déplacez le Stop Loss ou hésitez pendant quelques secondes. Ensuite, le marché atteint exactement l’objectif que vous aviez initialement prévu, mais sans vous dans la position. Le problème n’était pas toujour
SuperScalp Pro
Van Minh Nguyen
4.56 (36)
SuperScalp Pro - Professional Multi-Layer Confluence Scalping System SuperScalp Pro est un indicateur avancé de scalping qui améliore le Supertrend classique grâce à plusieurs filtres intelligents de confirmation. Il aide à identifier des opportunités de Buy/Sell présentant une probabilité plus élevée, tout en réduisant considérablement les faux signaux. Des flèches Buy et Sell claires apparaissent directement sur le graphique, tandis que les niveaux de Stop Loss et Take Profit basés sur l’ATR s
SMC Intraday Formula
VividMind Digital Solutions
5 (26)
Commençons par être honnêtes. Aucun indicateur ne vous rendra rentable à lui seul. Si quelqu’un vous dit le contraire, il vous vend un rêve. Tout indicateur qui affiche des flèches parfaites d’achat/vente peut être rendu impeccable — il suffit de zoomer sur la bonne partie de l’historique et de capturer uniquement les trades gagnants. Nous ne faisons pas cela.  SMC Intraday Formula est un outil. Il lit la structure du marché pour vous, identifie les zones de prix à la probabilité la plus élevée
Un nouveau Roi en ville - Indicateur + Gestion des ordres (TP1 + TP2 + TP3) + Envoi optionnel de signaux Telegram INCLUS (GRATUIT) (SYSTÈME COMPLET DE TRADING et DE SIGNAUX) Notre meilleur EA pour l’Or : Gold Slayer Cet indicateur inclut une stratégie avancée, un système de trading avec gestion des ordres personnalisable ainsi qu’un système de retour à la moyenne combinant des extensions d’enveloppes, soutenu par plusieurs filtres intelligents de confirmation comme le RSI afin de détecter des en
GoldenX Entry MT5
VividMind Digital Solutions
5 (16)
GoldenX Entry est un indicateur MT5 doté d’un algorithme adaptatif Smart Entry Trend, d’un système de scoring des signaux, d’un détecteur de régime de marché et d’un filtre de volatilité. Chaque signal inclut un niveau d’entrée calculé, trois niveaux de Take-Profit (TP1, TP2, TP3) ainsi qu’un niveau de Stop-Loss. Il est construit sur plusieurs couches analytiques conçues pour s’adapter à différentes conditions de marché, combinant un système analytique multicouche avec un optimiseur intégré et u
M1 Sniper MT5
Oleg Rodin
5 (7)
M1 SNIPER   est un système d'indicateurs de trading facile à utiliser. Il s'agit d'un indicateur à flèche conçu pour l'unité de temps M1. Cet indicateur peut être utilisé seul pour le scalping sur l'unité de temps M1 ou intégré à votre système de trading existant. Bien que conçu spécifiquement pour le trading sur l'unité de temps M1, ce système peut également être utilisé avec d'autres unités de temps. Initialement, j'avais conçu cette méthode pour le trading du XAUUSD et du BTCUSD. Cependant, j
La légende est de retour : Entry Points Pro 10. La relance de l'indicateur légendaire qui s'est maintenu 3 ans dans le Top-3 du MQL5 Market. Des centaines d'avis enthousiastes (589 sur les deux versions), des milliers de traders l'utilisent chaque jour, 31 000+ téléchargements de la démo   MT4+MT5 . J'ai lu chacun de vos avis publiés en cinq ans — et au lieu de promettre, j'ai intégré les réponses directement dans la version 10. Par un auteur présent sur les marchés depuis 1999, qui tient à l'ho
Gardez votre avantage de trading dans votre ligne de mire ! M5 Sniper est un nouvel indicateur de MeanFX. Il combine des signaux de trading précis avec des niveaux de TP/SL adaptatifs — créant ainsi les meilleures opportunités de trading statistiques possibles ! Le prix augmente tous les 5 achats, le prochain prix est de 69$ Envoyez-moi un message après l’achat pour recevoir des conseils/un guide et un EA bonus Qu’est-ce qui le distingue ? Performance statistique éprouvée sur Gold XAUUSD ( fonct
Adaptive Price Action Engine Achetez un indicateur, obtenez l'EA gratuitement Analyse auto-optimisée des tendances et des figures de chandeliers Multi-Timeframe Les marchés évoluent constamment, et tous les modèles de Price Action n’ont pas la même valeur dans toutes les conditions de marché. Adaptive Price Action Engine a été conçu pour s’adapter aux changements du marché en combinant structure de tendance, analyse Multi-Timeframe, figures de chandeliers et optimisation statistique au sein d’un
Auto Optimized SpeedAngle est un système de vectorisation du momentum de niveau institutionnel qui élimine l'ajustement de courbe ( curve-fitting ) grâce à une optimisation continue par avancement ( Walk-Forward Optimization , WFO). Plutôt que de s'appuyer sur des entrées statiques qui se dégradent lorsque les régimes de marché changent, l'indicateur recalibre dynamiquement ses paramètres en utilisant une validation hors échantillon ( Out-of-Sample , OOS), garantissant ainsi que les signaux affi
Neuro Poseidon MT5
Daria Rezueva
4.75 (52)
Neuro Poseidon is a new indicator by Daria Rezueva. It combines precise trading signals with adaptive TP/SL levels - creating best possible trades as a result! Message me and get  Neuro Poseidon Assistant  as a gift to automize your trading process! What makes it stand out? 1. Proven profitability on all assets and timeframes 2. Only confirmed BUY and SELL signals present on the chart 3. Adaptive TP & SL levels generated by the software for each trade 4. Easy to understand - suitable for al
Gold Trend Coach MT5
Cristhian Alexander Gaibor Cuasquer
5 (1)
Gold Trend Coach est un indicateur de tendance pour l'or (XAUUSD) sur MetaTrader 5 avec des signaux d'achat et de vente, un stop loss et trois objectifs de take profit, confirmés à la clôture de la bougie, un tableau de bord coach multi-unités de temps et des alertes sur votre téléphone et sur Telegram. Conçu pour le scalping en M5 et l'intraday en M15 pendant les sessions de Londres et de New York. Gold Trend Coach : signaux de tendance sur l'or XAUUSD avec entrée, stop et trois objectifs. Prix
ARIPoint
Temirlan Kdyrkhan
1 (4)
ARIPoint is a powerful trading companion designed to generate high-probability entry signals with dynamic TP/SL/DP levels based on volatility. Built-in performance tracking shows win/loss stats, PP1/PP2 hits, and success rates all updated live. Key Features: Buy/Sell signals with adaptive volatility bands Real-time TP/SL/DP levels based on ATR Built-in MA Filter with optional ATR/StdDev volatility Performance stats panel (Success, Profit/Loss, PP1/PP2) Alerts via popup, sound, push, or email Cu
Scalper Vault est un système de trading puissant et complet, conçu pour les traders en quête de régularité dans le cadre du trading intrajournalier. Cet indicateur de haute précision constitue un système de trading autonome et exhaustif, offrant des analyses de qualité institutionnelle, aussi bien pour le Forex que pour les options binaires. VEUILLEZ ME CONTACTER APRÈS VOTRE ACHAT POUR OBTENIR MES CONSEILS DE TRADING AINSI QU'UN EXCELLENT BONUS ! En éliminant les incertitudes et les analyses man
Gann Made Easy   est un système de trading Forex professionnel et facile à utiliser qui est basé sur les meilleurs principes de trading en utilisant la théorie de mr. WD Gann. L'indicateur fournit des signaux d'ACHAT et de VENTE précis, y compris les niveaux Stop Loss et Take Profit. Vous pouvez échanger même en déplacement en utilisant les notifications PUSH. VEUILLEZ ME CONTACTER APRÈS L'ACHAT POUR RECEVOIR GRATUITEMENT DES INSTRUCTIONS DE TRADING ET D'EXCELLENTS INDICATEURS SUPPLÉMENTAIRES! V
Gold Entry Sniper
Tahir Mehmood
5 (21)
Gold Entry Sniper – Tableau de Bord ATR Multi-Unités de Temps pour Scalping et Swing Trading sur l'Or Gold Entry Sniper est un indicateur avancé pour MetaTrader 5 qui fournit des signaux d'achat/vente précis sur XAUUSD et autres actifs, basé sur la logique de Trailing Stop ATR et l' analyse multi-unités de temps . Caractéristiques et Avantages Clés Analyse Multi-Unités de Temps – Affiche les tendances en M1, M5, M15 sur un seul tableau. Trailing Stop Basé sur l'ATR – Ajuste automatiquement selon
Tokyo mt5 Indicator
Vasiliy Strukov
5 (10)
Le Tokyo Indicator offre une vue d'ensemble visuelle et claire de l'orientation de la tendance, des signaux de trading potentiels et des conditions du marché. Sa ligne de tendance en escalier, codée par couleur, distingue les phases haussières (en bleu) des phases baissières (en magenta). Des flèches directionnelles associées mettent en évidence les opportunités d'achat et de vente potentielles lors des changements de tendance. Un tableau de bord intégré regroupe le signal actuel, l'orientation
Trend Catcher ind mt5
Ramil Minniakhmetov
5 (18)
INDICATEUR DE DÉTECTEUR DE TENDANCE L'indicateur de détecteur de tendance analyse les mouvements de prix du marché grâce à une combinaison d'indicateurs d'analyse de tendance adaptatifs, propriétaires et personnalisés. Il identifie la véritable direction du marché en filtrant les fluctuations à court terme et en se concentrant sur la force de la dynamique sous-jacente, l'expansion de la volatilité et la structure des prix. Il utilise également une combinaison d'indicateurs personnalisés de lis
Bonjour à tous les traders ! De nombreux investisseurs individuels utilisent des scripts web lents. Une approche systématique est essentielle pour un trading rentable. L'indicateur Astro AI n'est pas un simple affichage sur un graphique. Il s'agit d'un réseau neuronal sophistiqué composé de deux agents fonctionnant directement dans le terminal. Détails techniques du système : 1. Agent 1 : Analyste (Réseau neuronal graphique – GNN) Le marché n'est pas constitué de barres de prix individuelle
Divergence Bomber
Ihor Otkydach
4.89 (94)
Chaque acheteur de cet indicateur reçoit également gratuitement : L’outil exclusif « Bomber Utility », qui accompagne automatiquement chaque opération de trading, fixe les niveaux de Stop Loss et de Take Profit, et clôture les positions selon les règles de la stratégie Des fichiers de configuration (set files) pour adapter l’indicateur à différents actifs Des set files pour configurer le Bomber Utility selon différents modes : « Risque Minimum », « Risque Équilibré » et « Stratégie d’Attente »
Entry In The Zone and SMC Multi Timeframe is a real-time market analysis tool based on Smart Money Concepts (SMC), designed to analyze market structure, price direction, and key trading zones. It supports both Single-Timeframe and Multi-Timeframe Analysis, providing a clearer view of overall market structure across multiple timeframes, with real-time BUY / SELL signals designed with a strict focus on No-Repaint principles. The signals are designed to help filter unclear setups and evaluate tradi
Break and Retest Hunter is a powerful MetaTrader 5 indicator designed to automatically identify support and resistance levels, breakout structures, and potential retest opportunities in real time. Bonus Indicator: After purchasing Break and Retest Hunter , contact me to receive Trade Indicator Assistant EA completely free as a bonus utility. $65 for the next 10 copies . Next price is $120.  Combining adaptive market analysis, clear BUY/SELL signals, Fibonacci-based profit targets, and a premiu
PainX GainX Blue Spike Fusion AI Advanced Synthetic Index Spike Detection Indicator for MetaTrader 5 Discover potential spike setups with a clear, organized, and professional trading interface. PainX GainX Blue Spike Fusion AI is a specialized indicator designed for traders who monitor synthetic indices and want a structured way to observe potential price spike opportunities. The indicator combines signal monitoring, market-condition analysis, visual alerts, and event tracking in one convenient
Volatility Master for MetaTrader is a real-time dashboard tool that scans up to  50 symbols  to identify high-volatility , trending markets instantly. With bullish/bearish signals, customizable alerts, and a user-friendly interface, it helps you avoid range-bound conditions and focus on high-probability trades. Clarity leads to confidence. Trade confidently and protect your capital effectively with this powerful dashboard. We don't offer free or bonus indicators in exchange of reviews from you.
Unix Scalper
Issam Kassas
4 (4)
Unix Scalper — MetaTrader 5 Après votre achat, envoyez-moi un message sur MQL5 pour recevoir GRATUITEMENT Smart Universal Expert Advisor, ainsi que le cours en ligne, le manuel PDF et l’accès au groupe privé. Repérez la configuration. Consultez le plan. Choisissez comment intervenir. UNIX Scalper réunit l’analyse du marché, les décisions BUY/SELL/WAIT et les niveaux Entry, Stop Loss, TP1 et TP2 dans un panneau organisé. VISUALISEZ LE SIGNAL ET LE PLAN • Des décisions claires : BUY, SELL ou WAIT.
Atomic Analyst MT5
Issam Kassas
4.48 (62)
Atomic Analyst — MetaTrader 5 Après votre achat, envoyez-moi un message sur MQL5 pour recevoir GRATUITEMENT Smart Universal Expert Advisor, ainsi que le cours en ligne, le manuel PDF et l’accès au groupe privé. Atomic Analyst réunit l’action des prix, la direction de la tendance, les signaux d’entrée et de sortie, le Stop Loss et plusieurs niveaux de Take Profit directement sur votre graphique. REPÉREZ LE SIGNAL. COMPRENEZ LA CONFIGURATION. Atomic Analyst présente son analyse sous forme d’inform
Market Structure Order Block Dashboard MT5 est un indicateur MT5 conçu pour les traders qui veulent lire la structure de marché et les principales zones de réaction du prix directement sur le graphique. Il combine BOS, ChoCH, Order Blocks, Fair Value Gaps (FVG), Liquidité, Kill Zones, Volume Profile, et un dashboard compact pour une analyse rapide. Cet indicateur s'adresse aux traders qui utilisent la structure de marché, les concepts ICT et Smart Money comme cadre de décision. Il peut aider à r
FiboSniper Pro
Van Minh Nguyen
5 (3)
FiboSniper Pro – Multi-Filter Fibonacci System with Auto SL/TP and Control Panel FiboSniper Pro est un indicateur technique qui combine des Fibonacci Envelopes dynamiques avec plusieurs filtres de confirmation afin de générer des signaux Buy et Sell sélectionnés. Les niveaux de Fibonacci sont calculés à partir de Moving Average et ATR, puis filtrés par ADX, EMA, RSI, ATR, Volume, Time et la structure des bougies. L’indicateur affiche directement sur le graphique les niveaux automatiques de Stop
Plus de l'auteur
Average Session Range: Calculate and Average the Sessions High-Low Range of Specific Time Sessions Over Multiple Days. The Session Average Range is a sophisticated and precise tool designed to calculate the volatility of specific time sessions within the trading day. By meticulously analyzing the range between the high and low prices of a defined trading session over multiple days, this tool provides traders with a clear and actionable average range. **Note:** When the trading platform is closed
FREE
Average Session Range MT4: Calculate and Average the Sessions High-Low Range of Specific Time Sessions Over Multiple Days. The Session Average Range is a sophisticated and precise tool designed to calculate the volatility of specific time sessions within the trading day. By meticulously analyzing the range between the high and low prices of a defined trading session over multiple days, this tool provides traders with a clear and actionable average range. **Note:** When the trading platform is cl
FREE
Session Standard Deviation Date Range Analyzer: Evaluate the standard deviation of each bar's price (high, low, close, open, weighted, median, and typical) within defined trading sessions and date ranges, providing detailed insights into price volatility and market behavior. **Note:** When the trading platform is closed, the indicator may not load correctly. To ensure it works, you may need to load the indicator, unload it, and then load it again. **Note:** This indicator can only be used with
FREE
Session Expected Risk Date Range Analyzer:  Analyzes price data across specified date ranges to provide detailed insights into financial risk and volatility, using each bar's price metrics for accurate risk assessment. The Session Expected Risk Date Range Analyzer is a sophisticated tool designed to offer traders and analysts detailed insights into the expected financial risk across specific date ranges. Unlike traditional session-based analysis, this indicator focuses on calculating risk metr
FREE
Session Average Date Range: Analyze and average the low - high of specific trading sessions within custom date ranges, offering insights into price movements and market behavior over selected periods. The "Session Average Date Range" tool is an advanced analytical utility designed to empower traders and analysts by allowing them to dissect and evaluate the high and low range of specific trading sessions within a user-defined date range. This tool provides a flexible and precise approach to analy
FREE
Session Expected Risk Date Range Analyzer:  Analyzes price data across specified date ranges to provide detailed insights into financial risk and volatility, using each bar's price metrics for accurate risk assessment. The Session Expected Risk Date Range Analyzer is a sophisticated tool designed to offer traders and analysts detailed insights into the expected financial risk across specific date ranges. Unlike traditional session-based analysis, this indicator focuses on calculating risk metr
FREE
Symbol Swap Panel: Effortlessly switch the active symbol on your chart while simultaneously adding the new symbol to Market Watch. This tool ensures seamless integration and access to real-time market data, optimizing your trading workflow. Description: The "Symbol Swap Panel" is a versatile utility designed for traders seeking to manage their chart symbols and Market Watch more efficiently. This tool allows you to easily swap the current symbol on your chart while automatically adding the se
FREE
Symbol Swap Panel: Effortlessly switch the active symbol on your chart while simultaneously adding the new symbol to Market Watch. This tool ensures seamless integration and access to real-time market data, optimizing your trading workflow. **Note:**    When switching to a different symbol, it's recommended to switch back and forth between timeframes to ensure that the panel loads properly.   Description: The "Symbol Swap Panel" is a versatile utility designed for traders seeking to manage the
FREE
Filtrer:
Aucun avis
Répondre à l'avis