Kinetic Compression Index

KCI (Kinetic Compression Index)

Advanced Volatility-Distance Engine & Probability Dashboard.

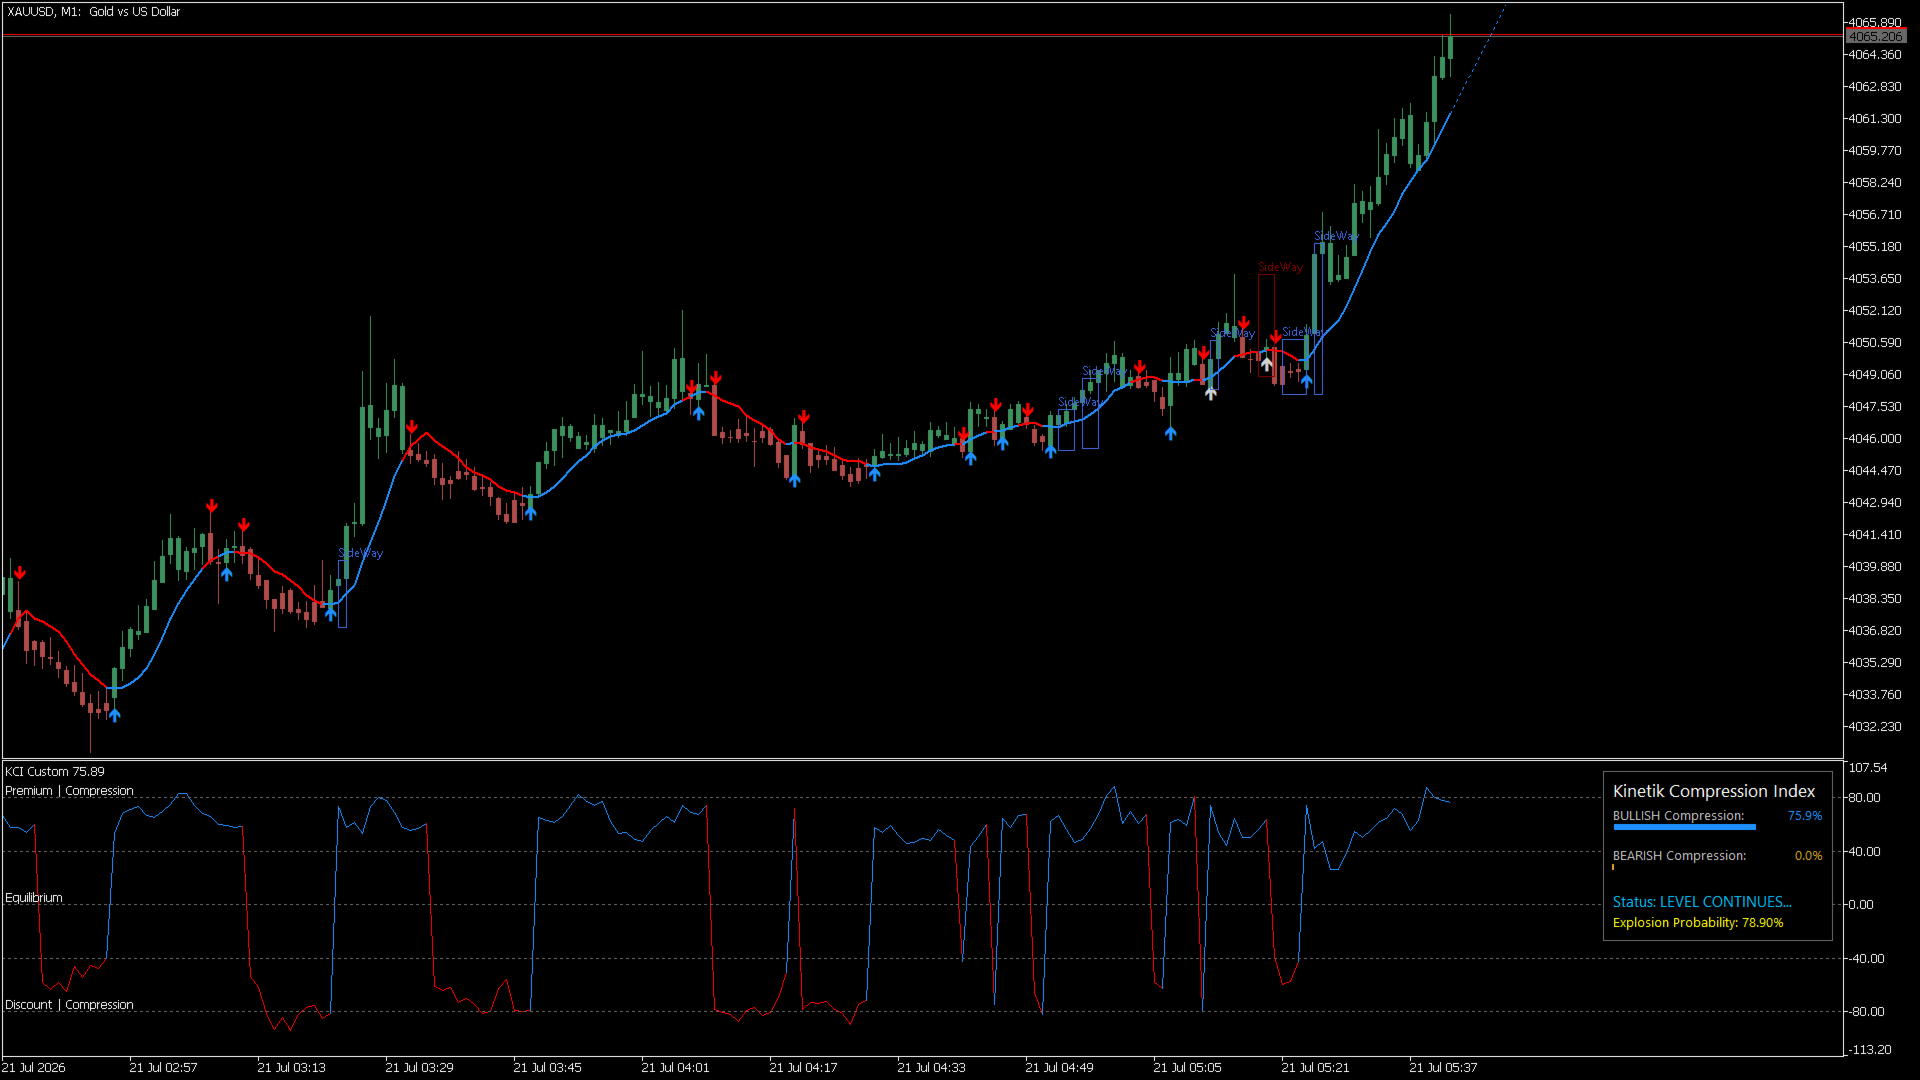
The KCI Custom Oscillator is not your typical price tracking tool. It is a quantitative analytical engine that dissects the market using pure kinematics principles. Instead of simply tracking where the price moves, KCI measures how it moves—calculating velocity, energy dispersion, and trajectory efficiency using dynamic Z-Score normalization.

The result is a polarized oscillator that precisely detects when the price is building pressure (compression) and when that pressure is primed to detonate into a new trend.

Core Advantages of the KCI Oscillator

  • Pure Kinematics Engine: Calculates the ratio between the "net distance" traveled by the price against its actual "path length." This detects inefficient price movements—a hallmark of the compression phase preceding a volatility explosion.
  • Independent Probability Algorithm (Sigmoid Curve): The dashboard does not merely mirror the oscillator values. The Explosion Probability metric is powered by a logistic regression function (Sigmoid) that independently calculates the mathematical probability from 0% to 100% based on raw data anomalies, providing an advanced predictive edge.
  • Cognitive Validation System: Capable of distinguishing between false breakouts and genuine energy depletion. The system internally evaluates tick volume and kinetic energy decay to ensure signals are only formed when opposing momentum has truly exhausted its strength.
  • Dynamic Visual UI/UX: Equipped with a solid, layered dashboard (isolated Z-order) that delivers instant telemetry. The horizontal level bars and colors respond dynamically to compression intensity, freeing traders from second-guessing momentum strength.

Utilizing Visuals for Accurate Entries

KCI provides highly structured visual signals. To achieve maximum accuracy, traders must combine Zone readings, Dashboard Status, and Sigmoid Probability.

1. Reading Zones and Status (Phase Identification)

  • "WEAK COMPRESSION" Phase (Line in the 0 to ±39 area): The market is choppy or lacks a clear direction. Action: Standby or avoid execution.
  • "LEVEL CONTINUES..." Phase (Line in the ±40 to ±79 area): The market is moving swiftly and directionally. Price is moving efficiently without significant counter-pressure. Action: This is not a reversal area. Do not attempt to fade the move. If you are already in a directional position, let your profits run.
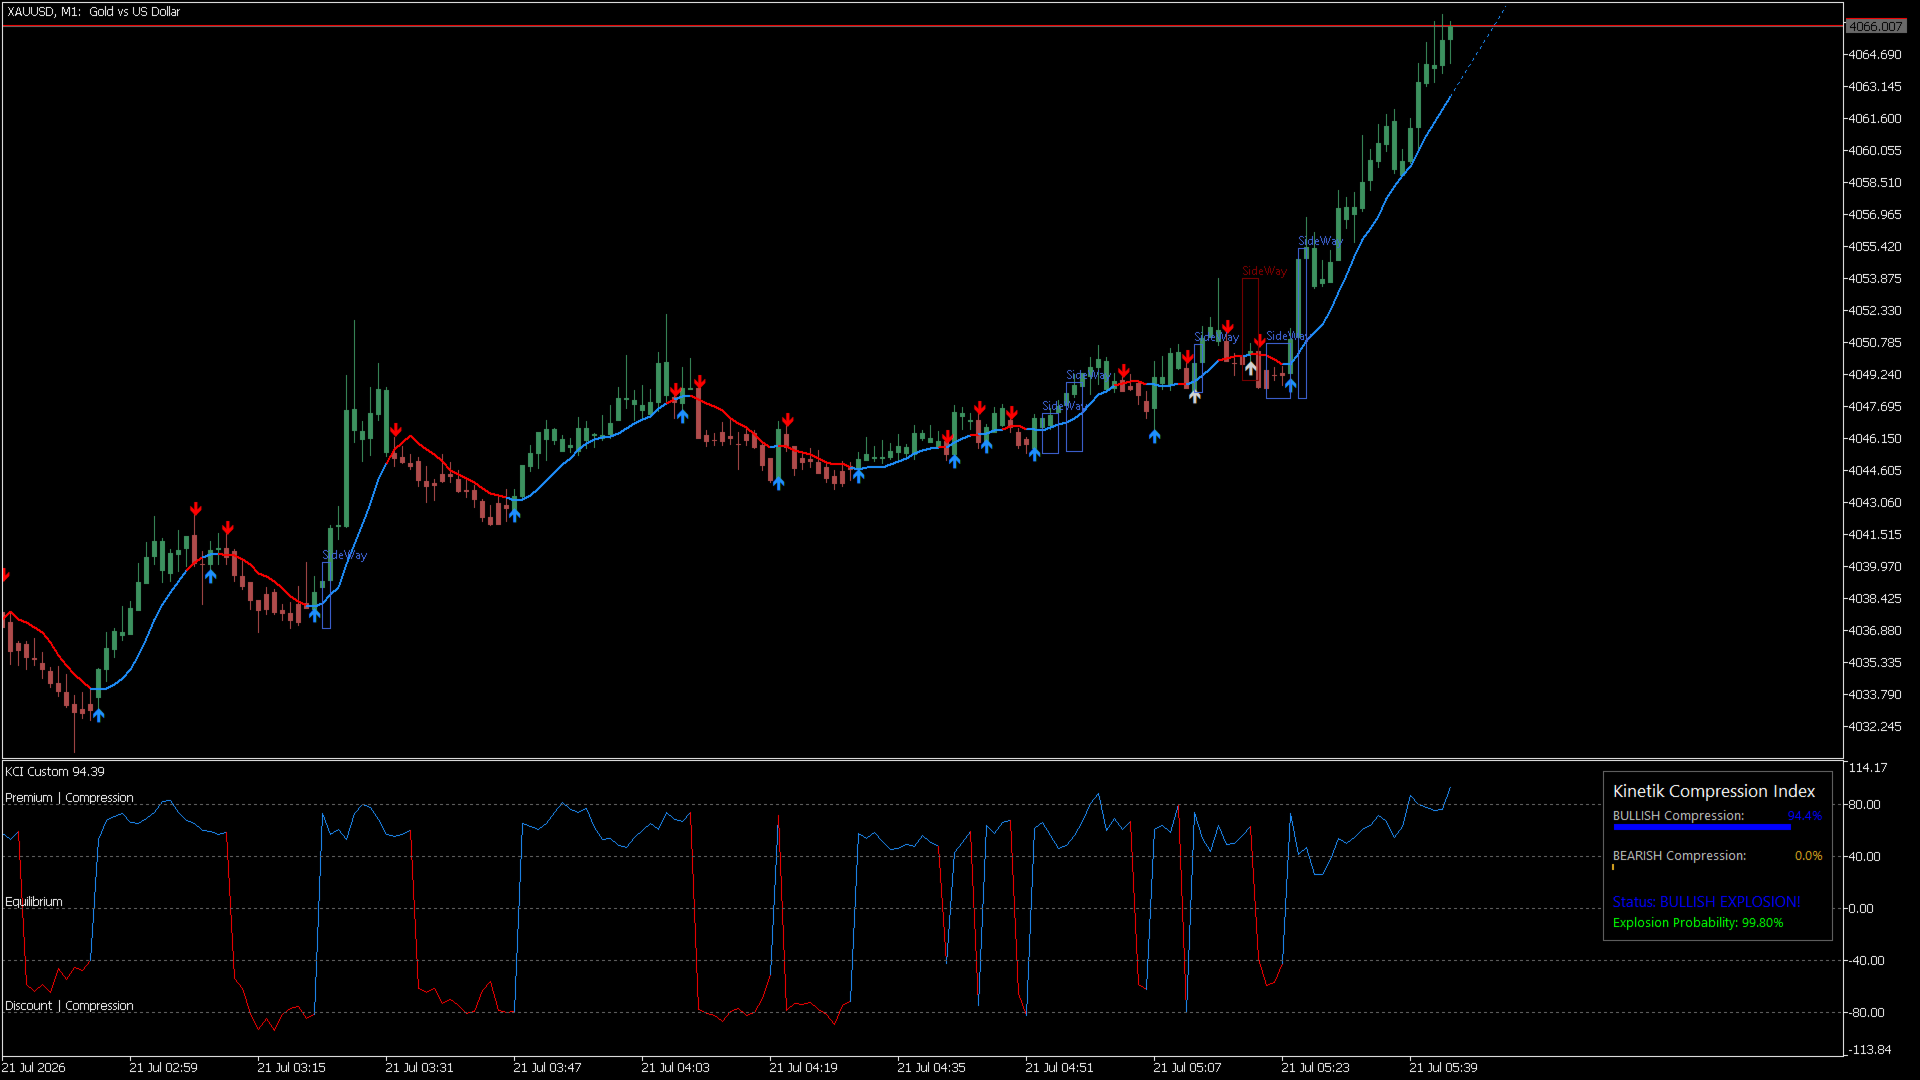
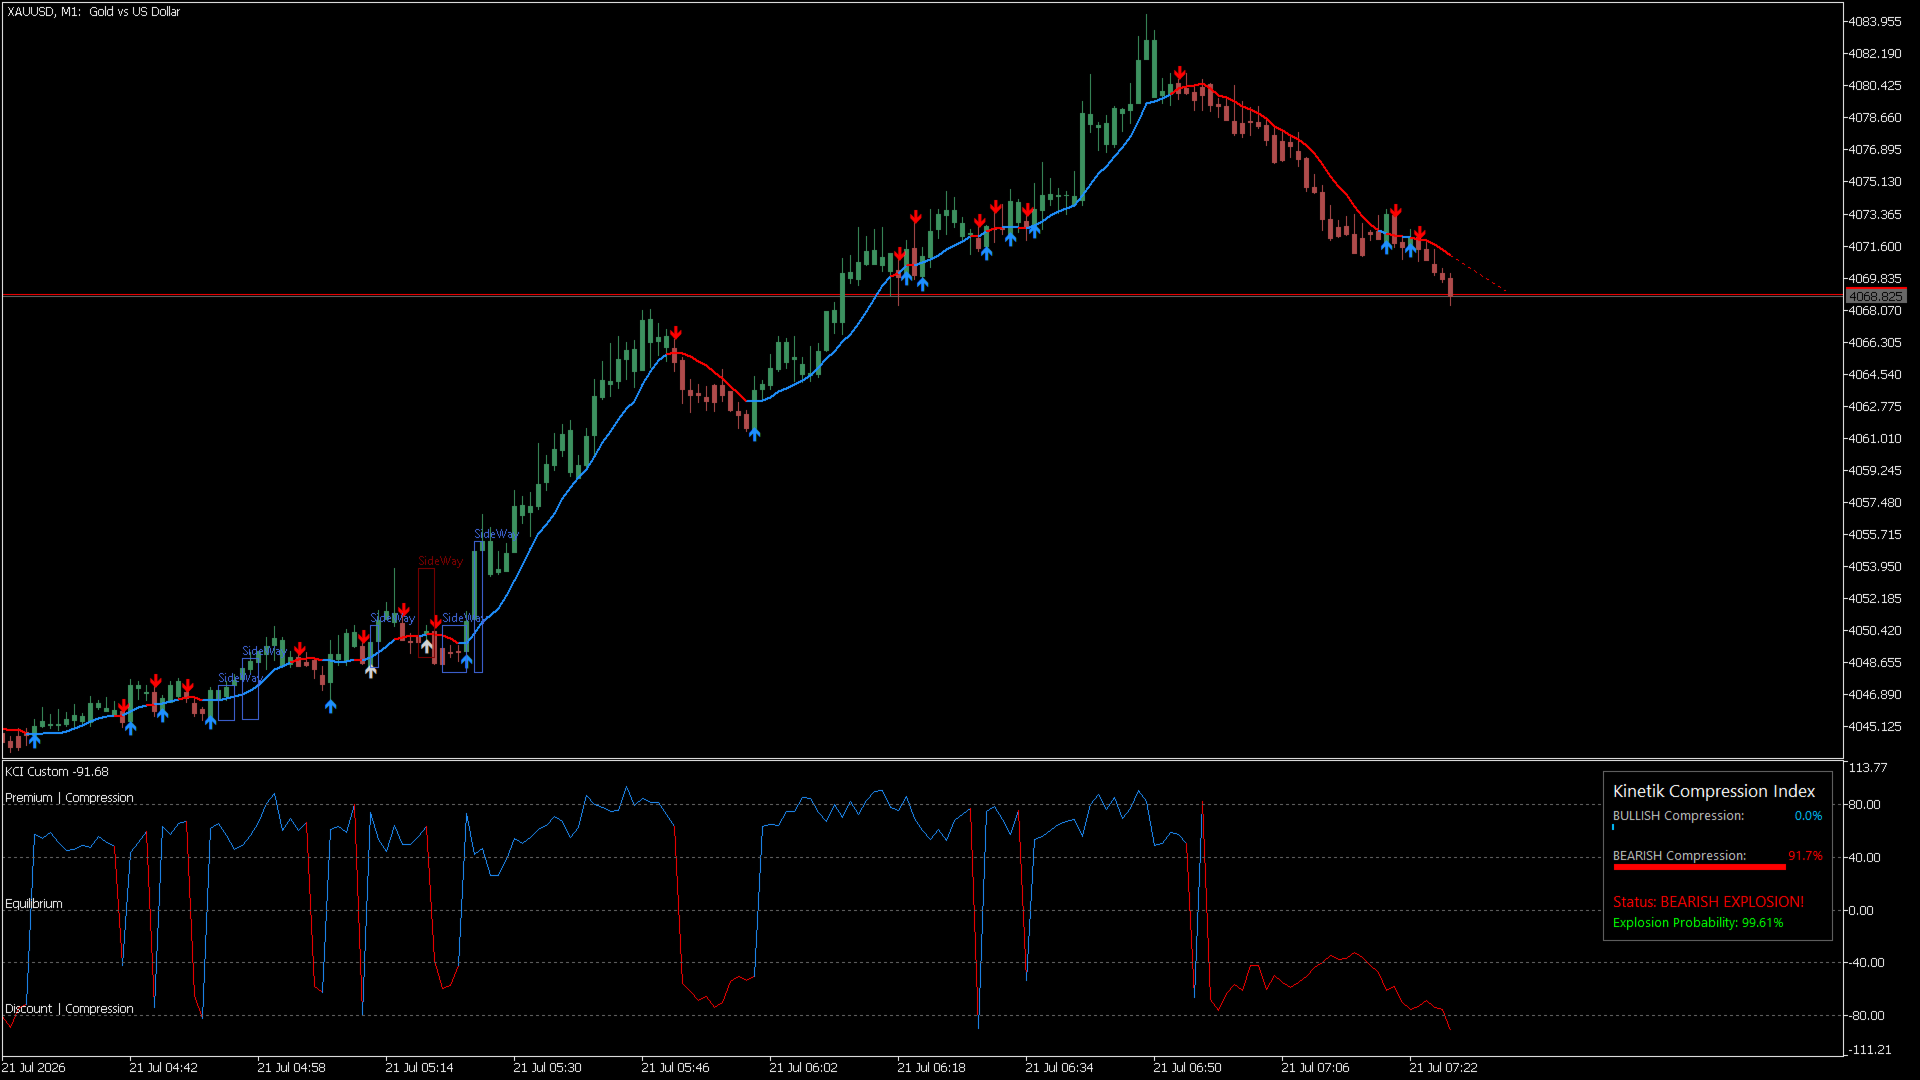
  • "EXPLOSION!" Phase (Line breaches Premium +80 or Discount -80 zones): The price has reached the extreme point of kinetic compression. The pent-up energy is massive and ready to rebound forcefully. Action: Prepare for a Reversal Entry setup.

2. Executing Accurate Entries (The Trigger)

A fatal mistake is entering immediately as the line touches the 80 level. Use the following 3-layer confirmation for high-precision accuracy:

BUY Setup (Opportunity from bottom to top):

  1. Oscillator Line: Must be in the Discount (≤ -80) zone.
  2. Dashboard Probability: Monitor the Explosion Probability metric. Wait until this number surges above 80.0% (Text changes to Bright Lime). This indicates the mathematical probability for an explosion is ripe.
  3. Visual Trigger: Do not enter while the line is still plunging sharply downward. Wait until the tip of the KCI line begins to hook upward (entering Cognitive Validation) or the Bearish compression bar on the dashboard starts to shrink.

SELL Setup (Opportunity from top to bottom):

  1. Oscillator Line: Must be in the Premium (≥ +80) zone.
  2. Dashboard Probability: The Explosion Probability number on the dashboard must show > 80.0% (Color changes to Bright Lime).
  3. Visual Trigger: Wait until the price exhausts its kinetic thrust—indicated by the KCI line beginning to hook downward, or the color intensity of the compression level on the dashboard starting to fade from its peak.

Pro Execution Tip:

KCI is most lethal when the Sigmoid probability is above 90%, combined with the tip of the oscillator line suddenly making a sharp turn away from the extreme level. That is the visual proof that the Cognitive Validation Engine has detected a drop in opposing energy, and a kinetic explosion in the opposite direction is underway.
推荐产品
Macro-R Pro Signal — Advanced Trading Signal Indicator Macro-R Pro Signal is a professional trading indicator designed to deliver high-quality BUY and SELL signals with enhanced precision and reduced market noise. By combining Bollinger Bands, RSI, and adaptive volatility filtering , this indicator helps traders identify high-probability reversal points while avoiding unfavorable market conditions. How the Strategy Works This indicator is built on a mean reversion + momentum confirmation concep
FREE
HiperCube VIX
Adrian Lara Carrasco
Welcome to HiperCube VIX Discount code for 25% off at Darwinex Zero: DWZ2328770MGM This indicator provide you a real info of market of volume of sp500 / us500 Definition  HiperCube VIX  known as the CBOE Volatility Index, is   a widely recognized measure of market fear or stress . It signals the level of uncertainty and volatility in the stock market, using the S&P 500 index as a proxy for the broad market. The VIX Index is calculated based on the prices of options contracts on the S&P 500 inde
FREE
Tillson TMA T3
Emin Ulucanli
5 (5)
TILLSON MOVING AVERAGE Also known as TMA or T3 indicator. It is a moving average that uses EMA and DEMA in its formula and is calculated with the 3rd degree Binomial expansion.       ...    int      handle1;     //Handle of the Tillson TMA T3.EX5 custom indicator    double   euBuff1[];    int TMAperiod= 12 ;    int TMSshift= 0 ;    double VolumeFactor= 0.618 ;    int OnInit ()    {    ...    handle1= iCustom ( NULL , PERIOD_CURRENT , "Market\\Tillson TMA T3.EX5" ,0,TMAperiod,0,0,TMSshift,0,0,Vol
FREE
Price Magnet — Price Density and Attraction Levels Indicator Price Magnet is a professional analytical tool designed to identify key support and resistance levels based on statistical Price Density. The indicator analyzes a specified historical period and detects price levels where the market spent the most time. These zones act as “magnets,” attracting price action or forming a structural base for potential reversals. Unlike traditional Volume Profile tools, Price Magnet focuses on price-time d
GDS Renko Entry Helper
Andrey Goida
1 (1)
GDS Renko Entry Helper - Free Renko Price Interaction Indicator for MetaTrader 5 GDS Renko Entry Helper is a free Renko price interaction indicator for MetaTrader 5. It helps traders highlight important areas where price reacts, slows down, returns to a zone or changes behavior around support and resistance. The tool is designed for manual Renko analysis. It does not generate buy or sell signals and does not tell the trader when to enter the market. Its purpose is to help focus attention on area
FREE
成交量分布多模式:按您自己的方式分析成交量,而不是按指标的方式。 大多数成交量分布指标将交易者限制在预定义的分析范围内。但市场并非按照固定的模式运行,所以你的分析也应该如此。 成交量分布多模式指标 让您可以完全自由地决定在何时何地以及如何分析成交量。无论您是研究市场结构、分析交易时段、监控更高时间框架的活动,还是追踪正在形成的竞价行情,该指标都会适应您的交易风格,而不是强迫您去适应它。 Volume Profile Multi-Mode 专为寻求直观工作流程的初学者和要求灵活性的专业人士而设计,它将四种强大的分析方法结合到一个高度交互式和可定制的交易工具中。 四种强大的分析模式 1.       灵活框: 在控制面板中将切换按钮设置为 “灵活框” ,然后点击“创建新的灵活框” 。只需在任何价格结构周围绘制一个矩形,指标即可立即在选定区域内生成成交量分布图。您可以随时移动、调整大小或删除该框,以便在分析发生变化时创建多个独立的分布图,从而同时比较不同的市场结构。 2.       固定范围 :将切换按钮设置为 “固定范围” ,然后单击 “创建新的固定范围” 。图表上会显示两条可移动的垂直
Smart ATR Grid Pro
Syamsurizal Dimjati
SMART ATR GRID PRO++ – Adaptive Grid Intelligence Suite is a next-generation, institutional-grade grid trading indicator engineered for traders who demand precision, adaptability, and comprehensive market structure analysis. By seamlessly integrating   Adaptive Volatility Grid System ,   KAMA Candle Trend Filtering ,   Multi-Factor Trend Detection (ADX + EMA20/50) ,   Dynamic Heatmap Zone Engine , and   Real-Time Market Regime Classification , this indicator delivers a complete decision-making
SMC Structure Markup
Seyed Mohammad Hosseini Hejazi
4.67 (15)
Overview The Smart Money Structure Markup Indicator for MetaTrader 5 is a powerful tool designed to help traders identify key market structures based on popular Smart Money Concepts (SMC) strategies. This indicator detects micro-market structures, providing insights into price movements and potential trend changes. It highlights important elements such as valid Break of Structure (BOS), Change of Character (CHoCH), and Inducement (IDM), helping traders to make informed decisions. Key Features Ma
FREE
MTF Trend Dashboard Pro for MT5 MTF Trend Dashboard Pro adalah indikator Multi Timeframe (MTF) profesional untuk MetaTrader 5 yang membantu trader mengetahui arah trend pada berbagai timeframe secara bersamaan dalam satu panel yang ringan, cepat, dan mudah dibaca. Indikator ini menampilkan status Bullish atau Bearish secara real-time mulai dari M1, M5, M15, M30, H1, H4, D1, W1 hingga MN , sehingga trader dapat dengan mudah melakukan analisis top-down sebelum mengambil keputusan entry. Fitur Utam
FREE
Triple Trend Meter Signal MT5 Triple Trend Meter Signal MT5 是一款专为 MetaTrader 5 设计的机构级多时间框架趋势共振与多品种扫描系统。该系统基于高精度的 ATR 过滤追踪算法(支持可选的 Heikin-Ashi 平滑处理),能够有效过滤市场噪音,并通过严格要求三个核心时间框架(M5、M15 和 M30)的趋势一致性,精准识别高概率的势能突破入场点。 核心功能特点 三擎多时间框架共振引擎: 同步计算三个独立的时间框架(M5、M15 和 M30)的波动率。仅当所有三个时间框架的方向 完全一致 时,才会在当前图表上绘制信号箭头,大幅减少假突破。 集成式多品种扫描仪表盘: 内置屏幕仪表盘,可实时监控自定义品种列表(例如: EURUSD, GBPUSD, AUDUSD, USDCAD, USDJPY, AUDJPY )。仪表盘会自动将市场报价中的品种划分为 合格结构偏向 (100% 共振)与 不合格/混合偏向 ,无需手动切换图表。 一键切换图表: 点击仪表盘上的任意品种,即可在保持当前所选时间框架的同时,将 MT5 活动图表
FREE
Professional Trading Tools for Every Trader: https://www.mql5.com/en/users/royalcrescent777/seller Hyper Flow is a Smart Money Concepts (SMC) indicator that maps institutional price action onto your chart and keeps every feature under your control through a built-in panel. It suits discretionary analysis on any symbol and timeframe, including Forex, gold and metals, indices, and cryptocurrencies. The tool reads market structure in real time across two layers. Internal shifts and broader swin
FREE
Super Trend eu
Emin Ulucanli
4.83 (6)
SUPERTREND; It is a trend following indicator based on the SuperTrend ATR created by Olivier Seban. It can be used to detect changes in trend direction and locate stops. When the price falls below the indicator curve, it turns red and indicates a downtrend. Conversely, when the price moves above the curve, the indicator turns green, indicating an uptrend. Like other indicators, it works well on SuperTrend when used in conjunction with other indicators such as MACD, parabolik SAR, Bollinger Band
FREE
This indicator idea comes from Tushar Chande called Qstick. Technical indicators quantify trend direction and strength in different ways. One way is to use the difference between close and open for each bar and to sum it up over a period of time. The formual is: Qstick (period ) = Average ((close-open ), period ) In this indicator, we can choose how to calculate body by two famous chart types. The first and default indicator settings are based on Heiken Ashi chart, and the second is based
FREE
“可调分形” - 是分形指标的高级版本,非常有用的交易工具! .......................................................................................... - 众所周知,标准分形 MT5 指标根本没有设置 - 这对交易者来说非常不方便。 - 可调分形解决了这个问题 - 它具有所有必要的设置: - 指标的可调周期(建议值 - 高于 7)。 - 价格高点/低点的距离可调。 - 可调分形箭头设计。 - 指标内置移动和 PC 警报。 点击这里查看高质量的交易机器人和指标! 这是仅在此 MQL5 网站上提供的原创产品。 ....................................................
VAMA Signal Simulator 扫描7个时间周期(M1-D1,权重从5%到30%),对每个周期用4条均线和6个振荡指标打分,综合成加权的Strong Buy/Buy/Neutral/Sell/Strong Sell信号。确认信号还必须与波动率自适应的H4均线方向一致(高波动时周期缩短,低波动时周期延长),并且M15和H1趋势方向也要一致。 每个确认信号都会在图表上显示箭头和BUY/SELL标签(按方向着色),并写入CSV日志,包含入场价、ATR、止盈和止损。止损/止盈距离、手数以及可选的重新入场模式(上一笔平仓后立即在同方向开新单,而不是等待反转)均可在Inputs中调整——默认值完全复现原策略的1:1盈亏比,修改则是明确的自主偏离。 面板显示实时的Win/Loss/Pending计数、胜率、按你设置手数计算的模拟盈亏,以及当前方向已持续了多久。 仅信号工具:从不真实下单、修改或平仓。 使用的均线(共4条,每条±1分): SMA(5)、SMA(20)、EMA(21)、EMA(50) 使用的振荡指标(共6个,每个±1分): 指标 参数 信号规则 RSI 周期14 <30→买入
Valtor FourGate Signal Indicator displays BUY and SELL candidates directly on the chart. The signal system combines four confirmation layers: - Fast, middle and slow moving-average alignment - Price position relative to the Ichimoku cloud - Stochastic oversold or overbought history - Stochastic midline confirmation Features: - Separate BUY and SELL arrow buffers - Works on the current chart symbol - Selectable signal timeframe - Adjustable MA, Ichimoku and Stochastic parameters - Optional popu
FREE
VFI Quantum
Nikita Berdnikov
5 (1)
Introducing VFI (Volume Flow Indicator) – a trading indicator that analyzes the relationship between volume and price movement to identify key trading opportunities. The indicator displays the strength and direction of volume flow, providing clear signals about potential entry and exit points. Signals are formed based on zero line crossovers, crossovers between the VFI line and its exponential moving average (EMA), and when the indicator exits overbought and oversold zones. Attention! This stra
FREE
Trend Follower LukaHo
Lukasz Mariusz Holla
TrendFollower(趨勢分析的瑞士軍刀) 告別傳統指標。探索 TrendFollower -五大策略合一! 厭倦了指標在市場早已過頂時發出買進訊號?你的移動平均線落後只能反映上週二的趨勢?讓我們來解決這個問題。 隆重介紹 TrendFollower -一個功能強大的模組化架構(機構級),它從五個不同的角度分析市場結構。無論你是耐心的波段交易者,還是最愛「買入/賣出」按鈕的超短線交易者,你都能在這裡找到適合自己的策略。 ️ 5 種操作模式(可在設定中選擇): ZLSMA(零滯後簡單移動平均線): 我們最喜歡的模式。它是一種速度極快的移動平均線,透過內建的 ATR 指標過濾噪音,並分析斜率角度。它瞬息萬變。延遲只是個細節上的小技巧——我們總是能及時把握。 ADHD 短線交易 :專為坐不住的你打造。閃電般快速、動態的通道,帶有雲圖(上漲/下跌雲圖),旨在捕捉微小波動和強勁的動能。 超級趨勢雲圖: 經典雲圖的現代演繹。基於 ATR 的動態波動雲圖。完美適用於嚴格的追蹤停損。 趨勢交易者: 包含 10
Overview of the Market Sessions Indicator The Market Sessions Indicator is a tool designed to help traders visualize the active trading hours of major global financial markets—specifically the Tokyo, London, and New York sessions. By clearly marking these time zones on the chart, the indicator allows users to identify the partitioning of major trading sessions. There are 3 regular trading sessions: - Tokyo Session - London Session - New York Session The indicator works from the H1 timeframe and
FREE
KVO Indicator
Saullo De Oliveira Pacheco
Klinger Volume Oscillator (KVO) - A Powerful Trend & Momentum Indicator This is an enhanced version of the Klinger Volume Oscillator (KVO) , a widely used indicator designed to help traders identify momentum shifts, trend direction, and overbought/oversold conditions in the market. How the KVO Indicator Works: Volume-Based Trend Identification – Unlike traditional oscillators that rely solely on price movements, the KVO uses both price and volume to detect market trends and momentum shifts .
FREE
Mean Reversion Supply Demand Indicator Mean Reversion Supply Demand is the indicator to detect the important supply demand zone in your chart. The concept of supply demand trading relies on the quantity mismatching between buying and selling volumes in the financial market. Typically, supply demand zone serves to predict the turning point. The wave pattern, for any supply demand zone to work as an successful trade, looks like the price must touch the base zone, move away and then return to zone
1. 产品名称:智能多时间框架移动平均线 (MTF MA) 产品简介:一款一体化交易解决方案,可让您在单个图表上实时查看 7 个主要时间框架的移动平均线。 2. 产品描述 交易者必须同时分析多个时间框架才能把握整体趋势。智能 MTF MA 可将 M1 至 D1 的移动平均线直观地投射到当前图表上,无需切换图表,让您一目了然地掌握多个时间框架的市场趋势。 主要功能: 完美同步:自动计算并显示 7 个时间框架(M1-D1)的移动平均线,与当前图表的走势同步。 自定义:您可以为每个时间框架单独设置周期、颜色和线条粗细,打造个性化的图表环境。 灵活设置:使用“关闭”功能可以轻松隐藏不需要的时间框架。 性能优化:针对 MQL5 环境进行了优化,即使在移动图表时也能提供流畅无缝的性能。3. 使用方法(用户手册) 安装:将下载的 .ex5 文件放入 MetaTrader 5 的 Indicators 文件夹,然后将其拖放到图表上。 配置: 全局设置:选择计算方法(SMA、EMA 等)和适用价格(收盘价、开盘价等)。 时间周期设置:设置是否使用 T1 (M1) 到 T7 (D
FREE
Elite Harmony Signals Pro Panoramica Elite Harmony Signals è un indicatore sofisticato di analisi tecnica che visualizza rettangoli dinamici che forniscono zone di trading chiare e segnali di conferma per decisioni migliorate. Caratteristiche Principali Zone Rettangolo Dinamiche Estensione in Tempo Reale : I rettangoli si estendono automaticamente all'azione corrente del prezzo Chiusura Intelligente : I rettangoli si chiudono solo quando appaiono segnali opposti Conferma Visiva : Zone di trading
Best SAR MT5
Ashkan Hazegh Nikrou
4.33 (3)
描述 :  我们很高兴推出基于外汇市场 (PSAR) 中专业和流行指标之一的新免费指标 该指标是对原始抛物线 SAR 指标的新修改,在专业 SAR 指标中,您可以看到点和价格图表之间的交叉,这交叉不是信号,而是谈论运动结束的可能性,您可以从新的蓝点开始买入,并在第一个蓝点之前设置止损,最后您可以在点交叉价格图表时退出。 如何打开买入或卖出信号? 通过第一个蓝点打开买入交易并通过第一个红点打开卖出交易 正确的止损在哪里? 安全止损可以在第一个点上,(在第一个蓝点的买入情况下和在第一个红点的卖出情况下) 正确的止盈在哪里? 止盈可以根据止损距离和RR进行调整,所以我的建议是2 RR,是止损的2倍 如果我们盈利但仍未达到 tp,那么退出点在哪里? 第一个退出警报可以在点和价格图表之间交叉。 该指标何时释放警报? 一旦新的点出现在新的方向,指标就会释放警报 我们如何根据这个指标构建 EA 以及它的成本是多少? 我们已准备好通过一些强大的完整功能基于此免费指标构建指标,例如基于点的追踪止损和基于权益百分比的资金管理,您可以通过填写下表来订购 https://www.mql
FREE
VWAP Simple
Deibson Carvalho
4.24 (29)
The Volume Weighted Average Price is similar to a moving average, except volume is included to weight the average price over a period.    Volume-Weighted Average Price [VWAP] is a dynamic, weighted average designed to more accurately reflect  a security’s true average price over a given period . Mathematically, VWAP is the summation of money (i.e., Volume x Price) transacted divided by the total volume over any time horizon, typically from market open to market close. VWAP reflects the capitali
FREE
How it works –   Base-departure detection — algorithmically finds consolidation bases (overlapping range with compressed volatility) followed by displacement departures. Patterns: Drop-Base-Rally, Rally-Base-Drop, Rally-Base-Rally, Drop-Base-Drop — detected structurally, not by candle names. –   Strength score (0–100) — from departure velocity, time-at-base, freshness (each revisit decays the score), higher-timeframe confluence and origin volume. –   Lifecycle — Fresh, Tested (decaying), Broken
FREE
WaveTrend Oscillator Indicator for MT5
Mohammad Taher Halimi Tabrizi
Introduction The Wave Trend Oscillator Indicator for MT5 is one of the well known indicators in the market, helping traders find strong entry points into the market. Like any other MetaTrader 5 indicator , it can produce both good and bad signals, but the number of accurate buy/sell signals is significantly higher than the weak ones. This makes it a powerful tool for improving your forex trading strategy , whether you are a beginner or an advanced trader. How does this indicator work? This indic
Volume Profile for MetaTrader 5 Price movement alone does not explain where the market is actually traded . What matters is where volume is built and how these areas shift over time. This Volume Profile displays the volume distribution directly on the chart , making it clear which price levels were accepted by the market and where rejection occurred. This allows structurally relevant zones to be identified and integrated into individual decision-making processes. The tool is designed for high pe
GoldPro Max
Taher Ahmed Mohamed Taha Elshafei
GOLDPRO MAX Advanced Multi-Timeframe and Smart Money Market Analysis for MetaTrader 5 GoldPro Max is a professional market analysis indicator for MetaTrader 5 designed to help traders study market direction, price structure, liquidity, market imbalance and potential trading areas from multiple perspectives. The indicator combines Multi-Timeframe Analysis, Smart Money Concepts, Market Structure, Liquidity Analysis, Order Blocks, Fair Value Gaps, Premium and Discount analysis, Smart Analytical Eng
Didi Index
Flavio Javier Jarabeck
4.8 (25)
The famous brazilian trader and analyst Didi Aguiar created years ago a study with the crossing of 3 Simple Moving Averages called "Agulhada do Didi", then later was also named Didi Index, as a separate indicator. The period of those SMAs are 3, 8 and 20. As simple as that, this approach and vision bring an easy analysis of market momentum and trend reversal to those traders looking for objective (and visual) information on their charts. Of course, as always, no indicator alone could be used wit
FREE
该产品的买家也购买
本产品已针对 2026 年市场进行更新,并针对最新 MT5 版本进行了优化。 价格更新通知: Smart Trend Trading System 目前价格为 $99 。 接下来的 30 次购买 后,价格将上涨至 $199 。 特别优惠: 购买 Smart Trend Trading System 后,请发送私信给我,即可免费领取 Smart Universal EA ,并将您的 Smart Trend 信号转换为自动交易。 Smart Trend Trading System 是一套完整的交易系统,具备不重绘、不回绘、不延迟的特点,专为希望获得更清晰信号、更准确趋势方向以及更有组织交易方式的交易者打造。 Learn Smart Trend Trading System Everything you need to learn, install, and use the product is available here: Online Course:   https://www.mql5.com/en/blogs/post/757466 Visual User Manual — B
Trend Sniper X
Sarvarbek Abduvoxobov
4.85 (26)
Trend Sniper X 是一款适用于 MetaTrader 5 的多周期趋势跟踪指标,可帮助交易者清晰精准地识别趋势方向和潜在的反转点。 适用于 MT4: https://www.mql5.com/en/market/product/193245 价格信息: 当前价格为促销价,随着后续更新和新功能的推出,价格可能会有所变动。 赠品优惠: 购买后联系作者,即可免费获取该指标的 Auto-Trade Assistant EA(自动交易助手 EA)。 Code2Profit 频道 通过多时间框架分析掌控市场! 如何使用 Trend Sniper X 最大化您的胜率:核心规则与交易时段技巧 技术规格 平台 MetaTrader 5 指标类型 多时间周期趋势指标 运行时间周期 任何图表时间周期,可独立选择更高的时间周期 (M1–MN1) 主要交易品种 外汇、黄金 (XAUUSD) 及其他差价合约 (CFD) 推荐账户 任何账户类型 可视化 彩色趋势蜡烛 (买入/卖出/微弱/变化) + 买入/卖出箭头 附加模块 交易时段方框 (悉尼、东京、伦敦、纽约) 主要功能 多时间周期趋势分析: 直接在
SMC Intraday Formula
Kareem Abbas
5 (22)
让我们先坦诚一点。 没有任何一个指标可以单独让你实现盈利。如果有人告诉你可以,那他是在向你兜售一个梦想。任何显示完美买卖箭头的指标都可以被做得看起来毫无瑕疵——只需要放大历史中的某一段并截取成功交易的截图。我们不会这样做。 SMC Intraday Formula 是一个工具。 它为你读取市场结构,标记出概率最高的价格区域,并用简单直白的语言准确告诉你当前智能资金的行为轨迹。你仍然需要做决定。你仍然需要执行交易。但现在,你是带着精确性执行,而不是靠希望。 我们已经在黄金(XAUUSD)以及主要外汇货币对的日内剥头皮交易中使用该指标将近三年。这是我们在 M1、M5、M15 和 M30 上的日常主力工具。它之所以有效,是因为它不试图预测未来——它展示的是当前正在形成的高概率交易机会,并解释 为什么 。 它与其他所有指标有什么不同? 大多数交易指标只做一件事。移动平均线交叉。振荡指标触及某个水平。出现一个箭头。你进场交易。你亏损。你责怪指标。重复。 SMC Intraday Formula 将多个机构级概念整合为一个统一的市场解读: - 斐波那契共振引擎 不只是普通的斐波那契水平——该指标
Neuro Poseidon MT5
Daria Rezueva
4.8 (54)
Neuro Poseidon is a new indicator by Daria Rezueva. It combines precise trading signals with adaptive TP/SL levels - creating best possible trades as a result! Message me and get  Neuro Poseidon Assistant  as a gift to automize your trading process! What makes it stand out? 1. Proven profitability on all assets and timeframes 2. Only confirmed BUY and SELL signals present on the chart 3. Adaptive TP & SL levels generated by the software for each trade 4. Easy to understand - suitable for al
Zoryk Gold
Reda El Koutbane
5 (7)
折扣将在 24 小时后结束——下一价格为 69 美元 ZORYK — MetaTrader 5 专用高级 XAUUSD 黄金信号系统 你一定熟悉这种感觉。 你花了很多时间分析黄金,等待合适的入场机会。终于开仓后,价格却立刻朝相反方向移动。你过早平仓、移动止损,或者只犹豫了几秒钟。随后,市场却在没有你的情况下到达了你原本预期的目标。 问题并不总是方向判断错误。 真正的问题是缺乏确定性。 你不知道准确的入场位置在哪里。 你不知道什么时候交易逻辑已经失效。 你不知道应该先锁定较近的利润,还是继续等待更大的行情。 你也不知道当前信号是否足够强,还是自己只是在强行寻找交易机会。 黄金市场变化非常快。一个没有明确计划的好想法,可能在几秒钟内变成错误的交易决定。 ZORYK 正是为了解决这个问题而开发。 什么是 ZORYK ZORYK 是一套完整的 XAUUSD 黄金信号与交易计划系统,专门为 MetaTrader 5  和 M5 时间周期 开发。 它不是一个只显示 BUY 或 SELL 箭头,然后让你独自决定其余所有内容的简单指标。 每个确认后的信号都可以在图表上显示完整的可视化交易计划,包
Unix Scalper
Issam Kassas
UNIX Scalper — Gold Scalping Indicator for MetaTrader 5 UNIX Scalper is a focused Gold scalping indicator designed primarily for XAUUSD on M1, M2, M3, M5, M10 and M15. It gives the trader a clear BUY, SELL or WAIT decision together with the complete trade plan: Entry, Stop Loss, TP1 and TP2 . The concept is simple: wait for the signal, follow the levels, move the Stop Loss to Break Even after TP1, and trade with discipline. Learn UNIX Scalper Everything you need to learn and use the product is
SuperScalp Pro
Van Minh Nguyen
4.63 (32)
SuperScalp Pro - Professional Multi-Layer Confluence Scalping System SuperScalp Pro 是一款高级剥头皮交易指标,在经典 Supertrend 的基础上加入了多个智能确认过滤器。它可以帮助您识别概率更高的 Buy/Sell 交易机会,同时显著减少虚假信号。 清晰的 Buy 和 Sell 箭头会直接显示在图表上,基于 ATR 的 Stop Loss 和 Take Profit 水平会实时自动计算。 购买后,请联系我获取设置指导和推荐配置。 使用 SuperScalp Pro Auto Trader 轻松实现信号自动化: [Auto Trader] 下载推荐设置文件: [Set File] 完整文档请参阅产品博客: [User Guide] 加入官方频道获取最新更新: [Official Channel] SuperScalp Pro 如何工作? 只有当多个确认层同时一致时,指标才会生成交易信号(趋势 + 动能 + 成交量 + 波动率)。 您可以手动交易,也可以连接 SuperScalp Pro Auto Tr
M1 Sniper MT5
Oleg Rodin
5 (7)
M1 SNIPER   是一款易于使用的交易指标系统。它是一个专为 M1 时间框架设计的箭头指标。该指标可以作为独立的系统在 M1 时间框架下进行剥头皮交易,也可以作为您现有交易系统的一部分使用。虽然该交易系统专为 M1 时间框架交易而设计,但它也可以用于其他时间框架。我最初设计此方法是为了交易 XAUUSD 和 BTCUSD。但我发现这种方法在其他市场交易中也同样有用。 指标信号既可以顺势交易,也可以逆势交易。我教授一种特殊的交易技巧,帮助您利用指标信号进行双向交易。该方法基于使用特殊的动态支撑位和阻力位区域。 购买后,您可以立即下载 M1 SNIPER 箭头指标。此外,我还为所有 M1 SNIPER 工具用户免费提供下方屏幕截图所示的 Apollo Dynamic SR 指标!这两个指标的组合可以帮助您更轻松、更准确地利用 M1 时间框架进行交易。 购买后请联系我,免费获取交易提示和奖励指标! 祝您交易成功!
Welcome to ENTRY IN THE ZONE AND SMC MULTI TIMEFRAME Entry In The Zone and SMC Multi Timeframe is a real-time market analysis tool based on Smart Money Concepts (SMC), designed to analyze market structure, price direction, and key trading zones. It supports both Single-Timeframe Analysis and Multi-Timeframe Analysis, providing a clearer view of the overall market structure across multiple timeframes, with real-time BUY / SELL signals that do not repaint. It is designed to help filter trading opp
GoldenX Entry MT5
Kareem Abbas
5 (16)
GoldenX Entry 是一款用于 MT5 的指标,包含自适应 Smart Entry Trend 算法、信号评分系统、市场状态识别器以及波动率过滤器。每个信号都包含计算得出的入场位、三个止盈位(TP1、TP2、TP3)以及止损位。它基于多个分析层构建,旨在适应不同市场条件,将多层分析系统与内置优化器及统计跟踪系统相结合。该指标基于风险收益比(RR)指标和历史交易行为提供量化分析。 开始使用非常简单——在所选时间周期上运行优化器,然后在图表上开始使用该指标。 核心功能 GoldenX Entry 将信号引擎与内置交易管理及历史统计跟踪整合在同一图表中: - 内置优化器: 优化器可在图表上单击运行。它通过两阶段搜索流程测试200种参数组合——先进行探索,再进行优化——并在完成后自动应用选定配置。结果会按时间周期缓存,因此当返回已优化的周期时,会立即恢复相同设置。 - 黄金品种自动周期识别: 将指标加载到任何 XAUUSD 图表(M1 到月线)。系统会自动识别当前周期并加载对应预设。共包含9个时间周期配置文件,专为黄金在标准周期上优化设计。切换周期时,参数会自动调整。 - 资金参考面
ATstrong
Zaha Feiz
ATSTRONG PRO: 市场结构与突破指标 突破检测引擎 | 5个动态TP目标 | 实时仪表板面板 | 不重绘 首发价格 当前价格: $59 — 每售出10份价格增加$10。 ATSTRONG PRO 是一款专为 MetaTrader 5 设计的高级突破和机构市场结构指标。 它能够检测高概率波段枢轴,识别集群的支撑和阻力堆积区,并实时发送结构破坏(BOS)和特征改变(CHoCH)信号。 该指标会自动在您的图表上绘制动态止损和5个不同的止盈水平(TP1到TP5), 并配有风险回报预测框、星级信号质量评级以及图表上的实时绩效分析仪表板。 交易提示: 这是一款用于手动交易和市场分析的指标。它在K线收盘时显示清晰的视觉信号、水平和警报,并且 完全不重绘 。它不执行自动交易。 核心亮点与特性 智能突破引擎: 同时检测集群水平区域突破和单波段枢轴突破(BOS / CHoCH)。 突破强度评分: 评估动能、成交量/K线实体大小和枢轴质量,以过滤虚假突破和诱多/诱空。 5阶段止盈水平: 预测可自定义的R倍数目标(TP1: 0.5R, TP2: 1.0R, TP3: 1.5R, TP4:
Gold Entry Sniper
Tahir Mehmood
5 (19)
Gold Entry Sniper – 专业多周期ATR黄金交易仪表盘,适合黄金剥头皮与波段交易 Gold Entry Sniper 是一款先进的 MetaTrader 5 指标,旨在为 XAUUSD 及其他品种提供精准的 买/卖信号 。基于 ATR 移动止损逻辑 和 多周期分析仪表盘 ,适合剥头皮交易者与波段交易者,帮助识别 高概率黄金入场点 。 主要功能与优势 多周期信号分析 – 同时显示 M1、M5、M15 趋势方向。 基于ATR的动态止损 – 根据波动性自动调整。 专业图表仪表盘 – 展示信号状态、ATR水平、线性回归中线和交易方向。 清晰买卖标记 – 自动箭头与文字标签提示。 离场提示与交易管理 – 自动检测离场信号锁定利润。 全面自定义 – 调整仪表盘位置、颜色、字体及参数。 专为黄金优化 – 适用于 M1至M15 黄金剥头皮 ,也适合外汇、指数与加密货币。 为什么选择 Gold Entry Sniper? 为追求 快速、精准、可视化交易决策 的交易者打造,ATR 与多周期确认结合,帮助你抓住 最佳黄金入场点
Atomic Analyst MT5
Issam Kassas
4.44 (54)
本产品已针对 2026 年市场进行更新,并针对最新 MT5 版本进行了优化。 价格更新通知: Atomic Analyst 目前价格为 $99 。 接下来的 30 次购买 后,价格将上涨至 $199 。 特别优惠: 购买 Atomic Analyst 后,请发送私信给我,即可免费领取 Smart Universal EA ,并将您的 Atomic Analyst 信号转换为自动交易。 Atomic Analyst 是一款不重绘、不回绘、不延迟的 Price Action 交易指标,专为手动交易、清晰信号和 EA 自动化而设计。 User manual: settings, inputs and strategy.   &   User Manual PDF . 它分析价格行为、强度、动能、多周期方向和高级过滤器,帮助交易者减少噪音,避免弱势交易机会,并做出更有结构的交易决策。 该指标将复杂的市场计算转换为简单的视觉信号、彩色K线、趋势读数、止损水平和多个止盈区域,使交易者能够快速理解并应用于真实市场环境。 主要交易用途: 剥头皮和日内交易: 专为快速决策、清晰箭头、提醒、K线颜色和
FiboSniper Pro
Van Minh Nguyen
5 (2)
FiboSniper Pro – Multi-Filter Fibonacci System with Auto SL/TP and Control Panel FiboSniper Pro 是一款技术指标,将动态 Fibonacci Envelopes 与多个确认过滤器相结合,以生成经过筛选的 Buy 和 Sell 信号。Fibonacci 水平基于 Moving Average 和 ATR 计算,然后通过 ADX、EMA、RSI、ATR、Volume、Time 和 Candle 结构进行过滤。该指标直接在图表上显示基于 ATR 自动计算的 Stop Loss 和 Take Profit 水平,并提供交互式控制面板,以便快速调整参数。 购买后,请联系我以获取推荐的设置文件和详细使用说明。 使用 Auto Trader X 自动执行 FiboSniper Pro 信号: [Auto Trader X] 用户指南和设置文件: [Click here] 加入官方频道获取最新更新: [Click here] 专为偏好结构化入场和清晰风险管理的交易者设计,适用于 Gold (XAUUSD)、B
Superhero
Ihor Otkydach
5 (3)
SUPERHERO 指標是一款基於「全方位」原則設計的多貨幣交易系統。該指標能獨立分析市場,並提供開倉與平倉的交易訊號。它採用止損與獲利了結訂單,風險報酬比(R:R)為 1:1。 此系統可向您的智慧型手機發送推播通知,讓您無需綁定電腦,即可「隨時隨地」進行交易。這對於自營交易公司而言再適合不過了。 每位顧客皆可享額外好禮: 每位購買此指標的買家,都將收到我贈送的一項特別實用工具,該工具: 自動下達止損與獲利了結訂單 當價格達到目標水準時,系統會自動平倉 支援待執行訂單交易 支援均值交易模式 如果您希望將這款優秀且極為便利的工具作為禮物獲贈,請在購買 SUPERHERO 指標後,立即透過 MQL5 平台的私訊與我聯繫。此外,您還將獲得培訓課程「如何安裝與設定 SUPERHERO 並開始穩定獲利」的存取權限。 關於「超級英雄」策略 SUPERHERO 策略是利用價格回調時,順應趨勢方向進行盤中交易。 「超級英雄」程式碼內含數個強大的技術指標,用以分析價格通道的趨勢方向與波動範圍,並能識別在修正性回調後形成的盤中波段反轉形態。 SUPERHERO 指標採用獨特的自我優化演算法,一旦添加至價格
Divergence Bomber
Ihor Otkydach
4.89 (94)
购买该指标的每位用户将额外免费获得以下内容: 原创工具“Bomber Utility”,该工具会自动跟踪每一笔交易,设置止损和止盈点,并根据策略规则自动平仓; 适用于不同交易品种的指标设置文件(Set 文件); 三种不同风险模式下的 Bomber Utility 设置文件:“最低风险”、“平衡风险” 和 “观望策略”; 一套详细的 视频操作手册,帮助您快速完成安装、配置并开始使用本交易系统。 注意: 要获取以上所有赠品,请通过 MQL5 的私人消息系统联系卖家。 我为您介绍原创的自定义指标 “Divergence Bomber”(背离轰炸机),它是一套基于 MACD 背离交易策略 的“全功能”交易系统。 该技术指标的主要任务是识别 价格与 MACD 指标之间的背离,并发出交易信号(包括推送通知),指示未来价格可能的运动方向。平均而言,这些信号的准确率超过 98%。有关该指标如何工作的详细说明,请观看本页面上的视频演示。 该系统使用 止损订单 和 动态回撤平仓机制 来管理交易。 Divergence Bomber 指标的主要特点: 支持交易的品种: AUDCAD、AUDCHF、AUDS
Gann Made Easy MT5
Oleg Rodin
5 (9)
Gann Made Easy   是一个专业且易于使用的外汇交易系统,它基于使用先生理论的最佳交易原则。 W.D.江恩。该指标提供准确的买入和卖出信号,包括止损和获利水平。您甚至可以使用推送通知在旅途中进行交易。 购买后请联系我,即可免费获得交易指导和超棒的额外指标! 您可能已经多次听说过江恩交易方法。通常 Gann 的理论不仅对于新手交易者而且对于那些已经有一定交易经验的人来说都是非常复杂的东西。这是因为江恩的交易方法在理论上并不那么容易应用。我花了几年时间来完善这些知识,并将最好的原则应用到我的外汇指标中。 该指标非常易于应用。您所需要的只是将其附加到您的图表并遵循简单的交易建议。该指标不断进行市场分析工作并寻找交易机会。当它检测到一个好的入口点时,它会为您提供一个箭头信号。该指标还显示止损和获利水平。 换句话说,当您像先生一样进行交易时,该指标会为您提供最佳江恩建议。江恩亲自告诉你此时此刻该做什么。但最好的部分是您不需要了解任何有关江恩交易原则的知识,因为该指标会为您完成整个市场分析工作。
Entry Points Pro for MT5
Yury Orlov
4.51 (150)
传奇回归:Entry Points Pro 10。 这款传奇指标曾 3 年稳居 MQL5 Market 前三,如今全面重启。 数百条热情好评(两个版本合计 589 条),每天有数千名交易者用它交易,演示版下载 31,000+   MT4+MT5  次。 五年来我读过你们的每一条评价——在第 10 版里,我没有给出许诺,而是把答案直接做进了产品。指标作者自 1999 年入市, 珍视诚信、自己的声誉和自己的客户 。 Entry Points Pro 给出的入场信号严格不重绘。 而且这一次不再只是作者的一面之词,而是可验证的事实:确认信号只在 K 线收盘后标出,自动化测试记录到 零重绘 (在 EURUSD、XAUUSD 和 BTCUSD 上共 2,486,568 次不变量检查——0 次违规)。测试方法完全公开——您可以在策略测试器中自行复现。 购买后请务必第一时间给我发私信。 我会发给您 扩展版说明书《交易者圣经》 ——使用本指标交易的完整指南——并告诉您如何免费获得 赠品:市场扫描器 ,它能同时分析多个品种和多个时间周期,并在一个界面上显示 Entry Points Pro 此刻在哪里表现
UZFX {SSS} 超短线智能信号 v5.0 MT5 是一款无重绘的高性能交易指标,专为在快速波动的市场中需要精准、实时信号的超短线交易者、日内交易者和波段交易者设计。该指标由 (UZFX-LABS) 开发,融合了价格行为分析、趋势确认和智能过滤技术,可在所有货币对和时间周期内生成高概率的买卖信号、预警信号以及趋势延续机会。 别再对交易犹豫不决了,开始遵循这一专为追求清晰、精准和纪律性市场执行的交易者设计的结构化信号系统吧。 相信我,这是 MQL5 上最优秀的指标之一,所以千万不要错过!!“为睿智交易者打造的智能信号” 最新 5.0 版本现已发布,价格可能会在未事先通知的情况下上涨至 499.99 美元,所以请尽快入手,以免错失良机!! 最终购买前!如果您想获取免费试用版,请通过 WhatsApp 号码 +923030751987 联系我!! 如果您遇到任何问题“或”有任何不明白的地方,请在私聊中向我咨询!!! 主要功能更新 • 自动买入和卖出信号检测 • 先进的反转识别逻辑 • 潜在市场反转前的预警信号 • 趋势延续确认信号 • 内置风险管理功能,包含入场点、止损点、TP1、
Reversion King Indicator
Eugen-alexandru Zibileanu
5 (6)
全新王者降临 - 指标 + 订单管理提示(TP1 + TP2 + TP3)+ 可选 Telegram 信号发送器 INCLUDED(免费) (完整交易与信号系统) 我们最强的黄金 EA: Gold Slayer 该指标包含先进的交易策略、可自定义订单管理系统,以及结合 Envelope 扩展的均值回归系统,并通过 RSI 等多重智能确认过滤器进行验证,以捕捉高概率反转入场机会,提供 BUY 与 SELL 信号。 你不仅能够学习如何交易,还能学会如何高效管理多个仓位,并利用之前盈利的持仓来覆盖亏损交易。 专为 M5 周期打造并优化,在 BTCUSD 和 XAUUSD 上表现尤为出色,因为这些市场的流动性能够让信号更加干净、可靠。 该指标会自动生成清晰的多头(Long)与空头(Short)信号,同时基于 ATR 自动计算入场位、止损位和止盈位,让风险管理从一开始就融入系统之中。 多 TP 系统设有三个渐进式目标位,你可以在 TP1 锁定部分利润、在 TP2 继续持仓,并在更大的行情中将仓位持有至 TP3,而这正是平均风险回报比真正开始大放异彩的地方。 默认参数开箱即用,已经针对稳定表现进行
BlueDigitsFx 生态系统官方访问 通过官方 BlueDigitsFx 生态系统获取基础设施更新、工作流程资源、产品发布及生态系统访问权限。 Telegram 生态系统 官方网站 BlueDigitsFx Precision Order Flow MT5 — MetaTrader 5 完整订单流分析套件 专业的基于交易时段的市场结构框架,将价值区域、控制点、拍卖背景与结构化决策支持相结合,专为认真的 MT5 交易者设计。 识别价值所在的位置 自动监控 VAH、POC 和 VAL 理解 London 和 New York 交易时段结构 通过结构化市场背景减少决策疲劳 专为 MetaTrader 5 交易者设计 开发者寄语 我开发 Precision Order Flow 是因为我希望能在 MetaTrader 5 内部以更清晰的方式读取交易时段结构。 在开发了多款被全球交易者广泛使用的 BlueDigitsFx 工具之后,我希望创建一个专注于 MT5 内部基于时段结构化决策的框架。在压力下手动绘制价位、切换平台并尝试解读价值区域容易导致决策不一致。Precision Orde
本产品已针对 2026 年市场进行更新,并针对最新 MT5 版本进行了优化。 价格更新通知: Smart Price Action Concepts 目前价格为 $200 。 接下来的 30 次购买 后,价格将上涨至 $299 。 特别优惠: 购买后,请发送私信给我,即可领取 免费赠品 + 礼物 。 首先需要强调的是,这款交易工具是不重绘、不回绘、不延迟的指标,因此非常适合专业交易使用。 [Online course] ,   [User Manual]  ,  [How to Install]  ,   [PDF] Smart Price Action Concepts 指标是一款非常强大的工具,适合新手和有经验的交易者使用。它将 20 多个实用指标整合到一个系统中,结合了 Inner Circle Trader Analysis 和 Smart Money Concepts Trading Strategies 等高级交易理念。该指标专注于 Smart Money Concepts,帮助交易者理解大型机构如何交易,并辅助预测其市场行为。 它特别擅长流动性分析,使交易者更容易理解机
Axiom Matrix
Issam Kassas
5 (6)
[User Manual]   ,   [Online Course]   ,   [PDF]  And [DEMO] Axiom Matrix 是一款适用于 MetaTrader 5 的专业多品种、多时间周期市场扫描器和决策仪表板。 它会扫描您的 Market Watch,分析多个时间周期,读取多个证据引擎,比较最强的交易机会,并在一个清晰的矩阵仪表板中显示最佳 BUY、SELL、WAIT 或被阻止的状态。 我开发 Axiom Matrix,是因为我想要一个可以替我完成繁重市场扫描工作的工具。 我不想只单独检查 RSI。 然后单独检查 MACD。 然后检查移动平均线。 然后检查成交量。 然后检查波动率。 然后检查支撑和阻力。 然后还要手动在不同品种和时间周期之间切换,只为了建立一个交易思路。 我想要一个仪表板,可以扫描市场、比较证据、排序最佳机会,并告诉我现在最强的交易设置在哪里。 这就是 Axiom Matrix 背后的核心理念。 AXIOM MATRIX 的功能 Axiom Matrix 会在多个时间周期上扫描多个交易品种,并根据多个技术证据组建立结构化决策。 Axiom Mat
Azimuth Pro
Ottaviano De Cicco
5 (7)
Azimuth Pro V2:MT5合成分形结构分析与确认入场 概述 Azimuth Pro 是 Merkava Labs 推出的多层级波段结构指标。四层嵌套波段层级、锚定波段的VWAP、ABC形态识别、三时间框架结构过滤以及收盘确认入场——一个图表,一个从微观波段到宏观周期的完整工作流程。 这不是盲目的信号产品。它是一个以结构为先的工作流程,专为重视位置、背景和时机的交易者打造。 ️ 夏季促销 — 庆祝夏至与 The Oracle Pro 上市:Azimuth Pro 七折优惠,现价 279 美元(原价 399 美元)。限时夏季优惠。 1. V2的变化 合成多时间框架引擎 高时间框架分析从零开始重建,采用与Meridian Pro相同的专有合成架构。更清晰的HTF背景、稳定的实时行为、无经典MTF同步问题。合成引擎还解锁了 固定比率时间框架级联 (x2、x3、x4、x6)——不再在经纪商的固定时间框架之间任意跳转,您可以按图表时间框架的固定倍数分析结构,在每个尺度上保持相同的分形关系。 确认入场箭头 作为稳定且可恢复的执行层而设计的收盘确认箭头。当ABC设置形成且自适应确认逻辑
货币强度向导是一个非常强大的指标,为您提供成功交易的一体化解决方案。该指标使用多个时间范围内所有货币的数据来计算这个或那个外汇对的力量。此数据以易于使用的货币指数和货币电力线的形式表示,您可以使用它们来查看这种或那种货币的力量。 您所需要的只是将指标附加到您要交易的图表上,该指标将向您显示您交易的货币的真实强度。该指标还向您显示买卖量压力的极值,您可以在顺势交易时利用这些压力。该指标还显示了基于斐波那契的可能目标。该指标可用于各种交易时间范围。该指标支持各种货币对的交易。   该指标为您提供所有类型的警报,包括推送通知。 购买后请联系我。我将与您分享我的交易技巧,并免费为您提供丰厚的红利指标! 祝您交易愉快,获利丰厚!
Advanced Supply Demand MT5
Bernhard Schweigert
4.53 (15)
任何新手或专业交易者的最佳解决方案! 该指标是一款独特、高质量、且价格合理的交易工具,因为我们已经整合了许多专有功能和新公式。 依据此更新,您将能够显示双重时间帧区域。 您不仅可以显示一个较高的时间帧,还可以同时显示图表时间帧,加上更高的时间帧:显示嵌套时区。 供需双方所有交易者都会喜欢它。 :) 重要信息披露 高级供需的最大潜力,请访问 https://www.mql5.com/zh/blogs/post/720245   想象您的交易如何得以改善,是因为您能够精准定位入场或目标位吗? 构建于新的底层算法,它可以更轻松地识别出买卖双方之间的潜在失衡。 这是因为它以图形方式展示供需最强劲区域,及其过去的表现(显示旧区域)。 这些功能旨在帮助您更轻松地发现最佳入场区域和价位。 现在您可以针对您的交易品种和时间帧来优化和编辑区域强度! 高级供需指标适用于所有产品和时间帧。 它是一个新的公式,非常新的功能是两个区域强度函数可由用户输入进行调整! 这在交易中是一大优势。 当您学习如何使用专有功能,例如带有价格游离最小 X 因子的区域强度时,您能够判断该区域强劲与否。 供需区域用作警报触发器。
Crystal Heikin Ashi Signals
Muhammad Jawad Shabir
5 (4)
Crystal Heikin Ashi Signals - Professional Trend & Signal Detection Indicator Advanced Heikin Ashi Visualization with Intelligent Signal System for Manual & Automated Trading Final Price: $149 ---------> Price goes up $10 after every 10 sales . Limited slots available — act fast . Overview Crystal Heikin Ashi Signals is a professional-grade MetaTrader 5 indicator that combines pure Heikin Ashi candle visualization with an advanced momentum-shift detection system. Designed for both manual traders
SR Liquidity MT5
Oleg Rodin
5 (2)
SR Liquidity   是一款旨在揭示市场流动性高度集中且价格反应最剧烈的隐蔽区域的交易指标。这些特殊的流动性区域充当着强有力的支撑位与阻力位,为您清晰呈现市场最可能发生反转的位置。 SR Liquidity 指标并非简单地绘制常规的支撑/阻力线,而是通过分析实际的价格行为,识别买卖压力积聚的区域。这些区域实际上是推动市场真实波动的流动性池。通过在图表上直观呈现这些区域,该指标能助您在价格反应发生前预判走势——这意味着它实际上能够预测价格方向可能发生的变化。它将原始的价格行为转化为清晰且具实操价值的市场蓝图,标示出那些可能成为市场转折点的关键价位。 该指标适用于任何交易品种和时间周期——包括外汇、指数、金属、加密货币等。支持任意时间周期。 购买后请联系我,以获取交易指南及免费赠送的优质附加指标!
Power Candles MT5
Daniel Stein
4.73 (11)
Power Candles V3 - 自我优化的强度指标 Power Candles V3 把货币与品种的强度直接转化为图表上可执行的交易方案。指标不再仅根据强度给K线着色,而是在后台持续运行实时自动优化,为您正面对的品种给出最佳 Stop Loss、Take Profit 与信号阈值。一键采用,Entry、Stop Loss、Take Profit 线就以精确价格绘制在图表上,提醒消息中直接包含方向。 本工具是 Stein Investments 生态系统的一部分 - 18+ 款工具,加上 Max,您的一对一 AI 交易导师。  随时在线,深入了解每一款指标,在您需要梳理思路的那一刻就在那里。  立即认识他: https://stein.investments 每根收盘K线运行 3,000+ 次交易模拟。9 种强度状态。2 种策略并行测试。一键采用最优配置。 为什么需要这个 大多数强度指标只给您一个数值,然后留下三个问题:相信哪个阈值、用哪个 Stop Loss、走哪个交易方向。Power Candles V3 在每根收盘K线上自动回答这些问题。结果就是一个完整的交易方案 -
Gold Stuff mt5
Vasiliy Strukov
4.88 (193)
Gold Stuff mt5 是专为黄金设计的趋势指标,也可用于任何金融工具。 该指标不会重绘,也不会滞后。 推荐时间框架 H1。 购买后立即联系我以获得设置和个人奖励!   你可以在我的个人资料中找到它。   重要! 购买后立即与我联系,以获得说明和奖金!   您可以免费收到我们的强力支持和趋势扫描指标的副本,请私信。大部头书!   设置 绘制箭头 - 打开关闭。 在图表上绘制箭头。 警报 - 打开关闭声音警报。 电子邮件通知 - 打开关闭。 电子邮件通知。 Puch-notification - 打开关闭。 推送通知。 接下来,调整色域。 Gold Stuff mt5 是专为黄金设计的趋势指标,也可用于任何金融工具。 该指标不会重绘,也不会滞后。 推荐时间框架 H1。 购买后立即联系我以获得设置和个人奖励!   设置 绘制箭头 - 打开关闭。 在图表上绘制箭头。 警报 - 打开关闭声音警报。 电子邮件通知 - 打开关闭。 电子邮件通知。 Puch-notification - 打开关闭。 推送通知。 接下来,调整色域。
作者的更多信息
Kaufmans AMA Candle
Syamsurizal Dimjati
5 (1)
RITZ Candle Kaufman’s AMA is a precision market-flow indicator built around Kaufman’s Adaptive Moving Average (KAMA / AMA) — a dynamic smoothing algorithm that automatically adjusts to changing volatility. This enhanced version interprets AMA momentum directly into smart candle-color signals , giving traders a clean, noise-filtered view of trend strength and directional bias. Where most indicators repaint or react too slowly, RITZ Candle AMA delivers stable, non-repainting color shifts based on
FREE
Fibo Pivot Optimus
Syamsurizal Dimjati
5 (1)
Ritz Smart FIBOPIVOT Optimus Pro Advanced Multi-Timeframe Fibonacci Trading System SMART PREDICTION & ACCURATE FORECAST Revolutionary Fibonacci Pivot Technology combines traditional pivot points with advanced Fibonacci extensions, creating a powerful predictive tool for professional traders. Our algorithm intelligently detects significant price levels across multiple timeframes, delivering laser-accurate support and resistance zones before the market moves . INTELLIGENT VOLUME-VALIDATED SIGNALS
FREE
Moving Average Ribbon
Syamsurizal Dimjati
5 (2)
MOVING AVERAGE RIBBON Ritz MA Ribbon Dynamics – The Next-Gen Trend Visualizer Ritz MA Ribbon Dynamics is a futuristic multi-layer Moving Average system engineered to visualize trend momentum, volatility balance, and market rhythm in one adaptive ribbon. Designed for modern traders who demand clarity, flexibility, and automation — this tool transforms the classic MA visualization into a dynamic analytical framework. Core Concept The indicator creates a multi-tier MA Ribbon that adapts to the cho
FREE
Smart Finder Order Block The Ritz Smart Finder Order Block is a next-generation market structure recognition tool, designed to intelligently detect and highlight institutional footprints within price action. Built on a dynamic blend of order block theory, consolidation tracking, and adaptive volatility modeling, it provides traders with a sophisticated lens to anticipate high-probability market reactions. Core Capabilities Smart Order Block Detection Identifies both Bullish and Bearish Order Blo
FREE
Dxy Vs Market
Syamsurizal Dimjati
USD STRENGHT VERSUS MARKET USD (DXY) Versus Market Panel is a professional visual indicator designed to analyze US Dollar strength and pressure against major trading symbols in real time. The indicator compares USD performance (based on DXY logic or internal strength calculation) versus selected symbols, allowing traders to quickly identify dominant currency flow, relative strength, and market bias from a single panel view. Built with a clean, lightweight, and non-intrusive panel , this tool hel
FREE
RITZ QUANTUM PULSE Next-Generation Economic Intelligence System Ritz Quantum Pulse — Next-Gen Economic Intelligence System. Experience quantum-level precision in news trading: real-time event detection, AI-powered filtering, and temporal synchronization. Anticipate volatility before it happens — not after. Where Market Intelligence meets Temporal Physics. Ritz Quantum Pulse   represents the convergence of   quantum logic ,   AI-driven analytics , and   real-time economic intelligence . This is
FREE
ZIGZAG and FRACTAL CANDLE PRO ( Only candles, No RSI strength panel) " Suitable for QQE RITZ " > Check My Product is an advanced market structure visualization system built for precision trend detection, powered by dynamic fractal logic and adaptive swing validation. It seamlessly identifies Higher Highs (HH), Lower Lows (LL), and key structural shifts — allowing traders to read the true rhythm of market transitions with institutional clarity. This system combines   ZigZag precision ,   fractal
FREE
RITZ SMART TREND ADAPTIVE FINDER Precision Trend Intelligence. Adaptive. Insightful. Real-Time. Ritz Smart Trend Adaptive Finder is an advanced market intelligence indicator engineered to detect and adapt to evolving market structures with dynamic precision. It automatically calibrates its analytical period based on real-time volatility, price momentum, and correlation strength — delivering true adaptive trend detection rather than static or lagging signals. By combining Pearson correlation , sl
FREE
Conspiracy 16
Syamsurizal Dimjati
3 (1)
Ritz Conspiracy 16 – Multi-Layer Market Intelligence System Ritz Conspiracy 16 adalah indikator analisis pasar multi-layer yang menggabungkan 16 indikator teknikal utama ke dalam satu panel visual terpadu. Dirancang dengan konsep market intelligence , indikator ini bekerja seperti pusat komando yang membaca perilaku pasar dari berbagai sudut: trend, volatilitas, momentum, volume, hingga struktur harga. Dengan pendekatan “konspiratif”, indikator ini menghubungkan jejak kecil dari 16 algoritma unt
FREE
Ritz_BUYnSELL_Detection The Ritz_BUYnSELL_Detection is a custom MetaTrader 5 (MT5) indicator that detects BUY and SELL trading signals based on trend detection and ATR-based volatility filtering. It provides visual arrows , entry alerts , and mobile push notifications , making it suitable for traders using a VPS setup for 24/7 signal monitoring. How to Use the Indicator Install on MT5 : Place the .mq5 file in the MQL5/Indicators folder. Compile it in MetaEditor, then apply it to any chart. A
FREE
Manual Trade Helper is an MT5 Expert Advisor designed as an automated assistant for managing manually opened trades. This EA does not open trades on its own, but instead enhances manual trading by automatically managing risk and position settings. Remote Management via VPS + Mobile Devices When deployed on a Virtual Private Server (VPS), the RitzEAneha Manual Trade Helper allows traders to seamlessly manage their trades from anywhere using just a smartphone or tablet. Since the EA runs 24/7 on t
FREE
Detect Trend and Consolidation :  Push Notif for Mobile Trading  Overview Push Notif for Mobile Trading: Detect Trend and Consolidation is a custom MetaTrader 5 (MT5) indicator developed by Ritz_EANEHA that intelligently detects whether the market is in a trend (bullish/bearish) or in consolidation (sideways) . It uses a proprietary comparison of Standard Deviation (StdDev) and Average True Range (ATR) to assess volatility and market structure, and sends mobile push notifications to alert trade
FREE
Ritz Smart Trend Adaptive Finder – Auto-Detect Dynamic Trend Channels A powerful trend detection indicator that adaptively analyzes price structure using dynamic ATR and statistical filters to discover the most significant trend channels on any timeframe and symbol. This tool automatically finds the most relevant period and slope for price movement and draws upper/lower channel zones, midline (mean), and trend support/resistance. Suitable for trend-following, breakout, and mean-reversion strateg
FREE
PIVOT eXtreme
Syamsurizal Dimjati
Pivot eXtreme Pivot adalah level referensi penting yang digunakan trader untuk memetakan potensi support & resistance intraday maupun jangka lebih panjang. Dalam sistem ini, level pivot dikembangkan menjadi P (Pivot Point utama) , R1–R13 (Resistance) , serta S1–S13 (Support) . Pivot Point (P) Titik pusat utama, dihitung dari rata-rata harga (High + Low + Close) / 3 . Berfungsi sebagai acuan keseimbangan harga : Jika harga di atas P → tren cenderung bullish. Jika harga di bawah P → tren cenderung
FREE
Push Notif for Mobile Trading (Now you can trade perfectly through notifications to your Mobile Gadget, with Signals that you can adjust to your trading style, Use VPS to activate real time trading) Description Push Notif for Mobile Trading is a custom MetaTrader 5 (MT5) indicator designed to send mobile push notifications to traders when certain price or indicator-based conditions are met. This allows traders to monitor markets remotely and act quickly, even when not at their trading terminal.
FREE
Moving Average Sentiment "Transform Raw Market Data into Clear Sentiment Vision" Moving Average Sentiment is a next-generation adaptive trend sentiment indicator that visualizes the true bias of the market — bullish, bearish, or neutral — in real time. It combines Moving Average dynamics with ATR-based volatility zones , creating a fluid, self-adjusting sentiment curve that reacts instantly to price structure and volatility shifts. This tool goes beyond a simple MA — it reads the behavior of th
FREE
MultiTimeframe Info Feed (MIF) Indicator Description: MultiTimeframe Info Feed (MIF) is a smart MQL5 indicator that displays a dynamic, real-time info panel directly on your chart, offering powerful insight into current market conditions. Key features include: Real-time display of Open, High, Low, Close, and live Tick price Tick Rate (ticks per second) for assessing market activity Auto-calculated Entry Price on new candle formation Signal direction detection (BUY / SELL) Price action pattern re
FREE
RitzEAnehaGoodWill
Syamsurizal Dimjati
READ THIS !! to the end Expert Advisor Description:   XAUUSD Reversal Pattern EA (EAneha GoodWill) Important Note: No martingale, averaging or grid Highly dependent on execution quality & low spreads XAUUSD Reversal Pattern EA  is an advanced automated trading robot developed specifically for trading  XAUUSD  (Gold vs USD) on the  M30 timeframe . It uses a robust combination of  candlestick patterns ,  volatility/volume indicators , and  oscillator filters  to identify high-probability reversal
RUHM Reborn
Syamsurizal Dimjati
RUHM REBORN for Micro Account / Cent Account XAUUSD - GOLD (Note: The grid-based system carries high risk during long trends without retrace. Use appropriate capital and understand the risks involved.) RUHM REBORN is a Grid-based Expert Advisor (EA) with ATR Entry developed to provide consistent, stable, and adaptive trading results on the XAUUSD (Gold) pair. This EA is specifically designed for USD Cent accounts, allowing it to run with relatively affordable capital while maintaining stability
Support & Resistance Zone Indicator This indicator dynamically identifies and draws support and resistance zones based on recent price action and fractal patterns. By analyzing ZigZag pivot points and tracking price reactions (touches, bounces, and breaks), the indicator determines the strength and validity of each zone. Key Features: Multi-Timeframe Support: Can work across different timeframes. Fractal-Based Detection: Utilizes both fast and slow fractal detection to find significant swing po
indikator Visual Panel Strengt MultiTimeframe : English Description Visual Panel Strength MultiTimeframe is a real-time trend strength indicator panel that displays the buy/sell pressure across multiple selected timeframes—such as M1, M3, and M5. The indicator utilizes ATR-based volatility analysis and a smoothed trend algorithm to calculate trend signals. Visually presented as a horizontal bar chart at the corner of your main chart, this tool helps traders instantly identify the prevailing
Smart Swing HH - LL Indikator ini dirancang untuk mendeteksi Swing High (HH) dan Swing Low (LL) secara cepat dan akurat pada grafik harga. Deteksi dilakukan berdasarkan analisa range ATR adaptif, konfirmasi pola candlestick (seperti pin bar dan engulfing), serta opsi tambahan menggunakan Fractal untuk validasi. Fitur utama: Deteksi otomatis titik Swing High dan Swing Low menggunakan ATR dan price action. Penyesuaian sensitivitas deteksi berdasarkan ATR multiplier dan range bar . Notifikasi real-
Ritz Smart Support & Resistance Zones Market Structure Based S/RT his advanced indicator detects and displays high-probability support and resistance zones based on actual market structure (swing highs and lows). Using intelligent zone merging and ATR-based fuzz buffers, it ensures the zone blocks are aligned with real price extremes without gaps. Zones are classified by strength (Proven, Verified, Untested, Turncoat, Weak) and visually rendered using colored rectangles. Ideal for traders seeki
ScalpReactor X
Syamsurizal Dimjati
ScalpReactor X A Tactical Indicator for Precision Traders The Ritz Scalping Habbit is a powerful MT5 indicator designed to help traders execute disciplined, high-probability trades through clear visual cues and multi-strategy confirmations. Whether you’re an intraday scalper or a swing trader , this tool integrates advanced market analysis into a single, easy-to-use interface. Key Strengths: Smart Buy & Sell Arrows — Based on multi-layer signals from RSI, ATR, EMA, ADX, and price momentum. Colo
Quantum RefleX
Syamsurizal Dimjati
Quantum Reflex Kuantum Reflex is a momentum-based oscillator indicator designed to deliver fast, accurate, and adaptive market insights. Built for real-time trading environments, it enables traders to spot rapid trend reversals, identify overbought/oversold levels, and combine short-term cross signals with higher-timeframe trend confirmation. Key Features Visual Cross Detection → Detects BUY/SELL signals from %K/%D crossover with instant updates for fast reversals. Dynamic Zone Highlight → Autom
Scalping Flash X
Syamsurizal Dimjati
SCALPFLASH-X Where Fibonacci Precision Meets RSI Intelligence. Next-gen trading system combining Adaptive Fibonacci Pivots, RSI Heat Mapping, and Smart Candle Analytics. Detect market dominance, momentum shifts, and reversal zones in real time across multiple timeframes. Institutional accuracy, retail simplicity — built for speed, clarity, and precision. Advanced Multi-Timeframe Fibonacci & RSI-Driven Market Intelligence System ScalpFlash-X — A next-generation trading system combining Fibonacc
BUYER or SELLER
Syamsurizal Dimjati
BUY or SELL FlashScalp Multi-System Indicator The FlashScalp Multi-System Indicator is a next-generation trading tool engineered for precision scalpers, intraday strategists, and professional analysts who demand both speed and clarity in market visualization. It seamlessly integrates smart candle-based analytics, adaptive ATR logic, and real-time economic event awareness — giving you a fully synchronized view of market volatility and momentum. Through an elegant and optimized interface, FlashSc
Buy Sell Smart
Syamsurizal Dimjati
BUY and SELL smart The BUY and SELL Smart Indicator is a next-generation trading tool engineered for precision scalpers, intraday strategists, and professional analysts who demand both speed and clarity in market visualization. It seamlessly integrates smart candle-based analytics, adaptive ATR logic, and real-time economic event awareness — giving you a fully synchronized view of market volatility and momentum. Through an elegant and optimized interface, FlashScalp delivers   instant signal fee
Resonance Eco1
Syamsurizal Dimjati
RESONANCE SIGNAL (MULTI-FACTOR CONFIRMATION) Resonance Signal Detection is a multi-layer confirmation engine that identifies high-quality trading signals when multiple technical factors align within a short price window. This module combines: RSI overbought / oversold interaction Volume behavior relative to its moving average ATR expansion and compression analysis Wick rejection strength (price rejection power) Breakout candle validation (body ratio & ATR multiplier) Stochastic fast crossing for
Fibo Price Action
Syamsurizal Dimjati
FIBO PRICE ACTION This indicator is a Smart OHLC–based Market Analysis and Fibonacci Zone system designed to combine visual clarity, adaptive market structure analysis, and volatility-aware strength detection into a single professional trading tool. Key Features Advanced Visual Themes Supports multiple candle and UI themes (Classic, Ocean, Forest, Gold, Neon, etc.) to adapt the chart appearance to different trading styles and preferences. Smart Fibonacci Zones Fibonacci zones can be calculate
筛选:
traderspeed
549
traderspeed 2026.07.26 10:46 
 

用户没有留下任何评级信息

Syamsurizal Dimjati
26711
来自开发人员的回复 Syamsurizal Dimjati 2026.07.26 15:44
Olá Traderspeed,
De nada, espero que isso seja útil.
Findolin
2720
Findolin 2026.07.24 10:27 
 

用户没有留下任何评级信息

Syamsurizal Dimjati
26711
来自开发人员的回复 Syamsurizal Dimjati 2026.07.24 16:53
hi findolin,
It's a good idea to place it on the left, but... it's feared that the eyes will get tired of going back and forth to see the simultaneous responsiveness of the KCI Line with the compression percentage BAR.
回复评论