 MetaTrader 5
 专家
专家
 指标
指标
 程序库
程序库
 实用工具
实用工具
 窗口小部件
窗口小部件
 规则
规则
适用于MetaTrader 5的免费技术指标 - 13
 技术指标的信号外汇和股票市场的开仓交易和平仓交易起着至关重要的作用。指标的本质就是一种交易品种的数学转换,旨在预测未来的价格变化。
测试技术指标可以更有利于预测市场行为并从中获利。
技术指标的信号外汇和股票市场的开仓交易和平仓交易起着至关重要的作用。指标的本质就是一种交易品种的数学转换,旨在预测未来的价格变化。
测试技术指标可以更有利于预测市场行为并从中获利。 
Stochastic MTF Dashboard (随机指标多周期仪表盘) Stochastic MTF Dashboard 是一款专为追求高效交易而设计的视觉化解决方案。它允许您在不切换当前图表的情况下,同时监控多达 6 个不同时间周期 的随机指标(Stochastic)状态。 其核心目标是消除分析中的混乱,让您瞬间掌握市场力度: 红色:超买区 —— 价格可能出现枯竭(看跌信号)。 绿色:超卖区 —— 价格可能出现回升(看涨信号)。 灰色:中性区 —— 价格处于中间震荡范围。 为什么选择这款仪表盘? 多周期清晰化: 在一个面板中同时查看从 M5 到日线(Daily)的时段,是在几秒钟内识别大趋势的理想工具。 极速读取: 无需解读复杂的线条交叉。颜色和数值会立即告知您市场的精确区域。 入场确认: 避免逆势操作。确保您的低周期入场点与高周期的市场情绪保持一致。 简洁专业的界面: 面板经过优化,美观且不占用过多工作空间。您可以自定义其位置、颜色和大小。 高性能运行: 轻量化代码设计,即使同时打开多个交易品种,也不会拖慢您的 MetaTrader 5 平台速度。 配置与同步: 指标默认配置为
FREE

用户指南:Custom Regression Signals MT5 Custom Regression Signals 是一款专为 MetaTrader 5 设计的专业技术分析工具。它利用线性回归(Linear Regression)数学方法构建动态价格通道。与标准的静态通道不同,该指标能主动分析价格动态,帮助交易者识别市场是处于活跃趋势还是侧向(横盘)震荡阶段。 1. 指标工作原理 指标根据设定的回顾周期构建通道,并根据当前市场阶段自动更改颜色: 绿色通道(牛市趋势): 价格稳步上涨。在此阶段,指标会过滤信号,仅在通道下边界产生**买入(BUY)**信号。 红色通道(熊市趋势): 价格稳步下跌。在此阶段,指标仅在通道上边界产生**卖出(SELL)**信号。 灰色通道(横盘/震荡): 市场处于侧向移动。在此阶段,允许在通道上下边界进行双向交易(均值回归)。 2. 交易信号 当价格超出计算出的回归通道边界时,指标会在图表上显示箭头: 向上箭头(绿色/灰色): 买入信号。相对于回归线,价格被视为超卖。 向下箭头(红色/灰色): 卖出信号。相对于回归线,价格被视为超买。 重要提示: 该指标
FREE

WickSniper Pro – Precision Reversal Indicator for Smart Traders ===============================================================
WickSniper Pro is a powerful **non-repainting** price action indicator that detects **inside bar breakout reversals** with sniper-like accuracy. Whether you're a scalper, swing trader, or day trader, WickSniper Pro helps you catch high-probability turning points in the market using clean, intuitive signals.
Key Features ------------ - Non-Repainting – Once a signa
FREE

了解“Agulhadas”策略 该策略灵感来自巴西市场中流行的交易理念,结合了五种技术指标,用于根据趋势、市场强度和动量识别潜在的买入和卖出点。其中包括著名的Didi指标,该指标由Odair Aguiar开发,以代表移动平均线的交叉而闻名。 点击此处下载股票扫描器 使用的指标 Didi指标 ADX指标 布林带 Trix指标 随机指标(Stochastic) 策略的工作原理 该指标会在满足特定条件时在图表上显示买入或卖出的箭头信号,同时用“X”标记出场点。 买入信号 需要满足以下三个条件来确认买入点: ADX呈上升趋势 ADX高于32或呈上升趋势,且DI+高于DI-。 Didi指标发生金叉 短期均线上穿中期均线。 布林带扩张 上下轨同时扩张。 卖出信号 与买入信号条件相同,但信号相反: ADX呈下降趋势 ADX高于32或呈上升趋势,且DI-高于DI+。 Didi指标发生死叉 短期均线下穿中期均线。 布林带扩张 上下轨同时扩张。 出场条件 该策略提供多种条件用于提示何时退出交易,图表上会用“X”作为视觉信号标记。 多头出场(两种选择): 组合条件 ADX处于趋势中(高于32或上升,且不是同
FREE
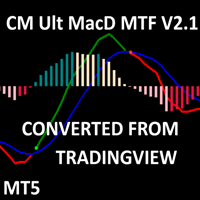
CM MACD Custom Indicator - Multiple Time Frame (V2.1) This advanced MT5 indicator, adapted from ChrisMoody’s TradingView script, delivers a powerful Multi-Timeframe MACD with customizable visuals and alerts. Plotting MACD lines, signal line, and a color-coded histogram, it highlights trend direction and momentum with distinct colors for growing/falling histograms above/below zero. Cross signals are marked with arrows, and users can enable alerts, email, or mobile notifications for buy/sell oppo
FREE

枢轴点是市场上相当一部分人每个交易时段都在看的支撑与阻力位,在任何图表上算法都一样。这款 Pivot Points 会用上一根已收盘的 K 线替你算好并画出来:中枢、阻力和支撑各自标注价格,并给出与当前价的距离。 三种计算方式 Classic ,经典枢轴:中枢,R1 到 R3,S1 到 S3。 Fibonacci :以前一段波幅的 0.382、0.618、1.000 比例投射出阻力与支撑。 Camarilla :基于收盘价的价位,包含反转位 R3 与 S3、突破位 R4 与 S4。 日线、周线或月线 选择枢轴的取值周期。看当日行情用日线,需要整周或整月有效的高级别价位就用周线和月线。一次只画一个周期,图表才不会乱。 一眼看清每个价位 每个价位都是带价格标注的线,紧凑的面板会把它们按 Resistance、Pivot、Support 的顺序分组,每组之内从最外侧的价位开始排。每一行都写着该价位的价格,以及当前价距它多远。这个距离要按点数、价格差还是百分比显示,由你自己选。百分比是唯一在任何品种上含义都相同的一种。 价格到了就提醒你 可选功能,不打开就不会动。弹窗、声音、推送到手机
FREE

Market Profile Multidivisas E s un indicador profesional que construye perfiles de mercado utilizando el tiempo que el precio permanece en cada nivel (TPO), identificando automáticamente zonas de valor, Point of Control y áreas de rechazo del mercado. Beneficios Identifica zonas donde el mercado acepta el precio. Encuentra soportes y resistencias institucionales. Detecta áreas de equilibrio. Ayuda a identificar rupturas reales. Permite localizar mejores zonas para entradas, SL y TP.
Funciones
FREE

Tension Flow Trend — 带有历史盈亏比回测 Dynmaic HMA 带状指标 Tension Flow Trend 是一款用于 MetaTrader 5 的高级趋势 shadow 指标,它将 赫尔移动平均线 (HMA) 趋势带、Z-Score 动量分析以及内置的直观风险回报比 (Risk:Reward) 回测引擎完美融合于单个图表叠加层中。该指标旨在识别高概率的趋势延续机会,通过要求斜率确认的 HMA 交叉以及可配置的信号冷却时间来过滤市场噪音,从而生成交易设置。 当有效的买入 (BUY) 或卖出 (SELL) 信号出现时,指标会自动计算并在图表上直接绘制出完整的交易结构,包括入场价、基于 ATR(200) 的止损位以及基于风险回报比的止盈位。动态的止盈 (TP) 和止损 (SL) 框会随着 K 线逐根向前延伸,直到触及其中一个级别,从而为每笔完成的交易创建清晰的视觉历史记录。 核心功能 动态赫尔移动平均线 (HMA) 带: 凭借响应迅速的 HMA 计算实现平滑的趋势检测。带状宽度根据市场波动性自动扩展和收缩。牛市和熊市趋势状态通过颜色编码,以便进行快速的视觉 cru
FREE
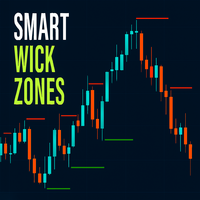
Smart Wick Zones indicator is a powerful tool designed to highlight hidden areas of price rejection and liquidity on your chart. By analyzing candle wicks (also called shadows or tails), the indicator automatically draws horizontal zones where strong buying or selling pressure has previously appeared. These wick zones often mark turning points in the market or areas where price reacts strongly, making them excellent references for support and resistance.
Instead of manually scanning candles for
FREE

HubDynamicTrendLine — 枢轴通道趋势线指标 本指标基于左右各 N 根 K 线(默认 15)识别严格枢轴高点与低点,将同类枢轴依次连接,构建动态的通道上下边界。 核心功能 枢轴连线 :连续枢轴高点之间、枢轴低点之间用实线连接,形成可视化通道。 斜率投影 :当相邻两个同类型枢轴的价差 ≥ 200 周期 ATR 时,从最新枢轴按该段斜率向前投影(默认 70 根 K 线),用点线标示潜在的通道延伸方向。 突破标记 :若最新收盘价穿越活跃投影线,在对应 K 线旁标注 "Up"(上破)或 "Down"(下破)。 最新枢轴水平 :以水平虚线及价格标签持续追踪最近一个高点 / 低点的价位,辅助支撑阻力判断。 输入参数 参数 说明 默认 Pivot Length 枢轴左右回看 K 线数 15 Extend Length 投影长度(K 线数) 70 Ext. Style 投影线型 Dot High Color 枢轴高点颜色 Blue Low Color 枢轴低点颜色 Lime Show Levels 显示最新枢轴水平线 true Show Breakout 显示突破方向标签 tru
FREE
https://t.me/Xonxonxonxonxonxon
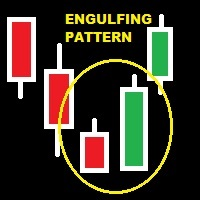
GIVE A LOOK TO MY OTHER PRODUCTS ! 100 % PER MONTH PROFIT----CONTACT ME FOR MORE INFO ! There are patterns that are more affidable then others.One of the most important is the engulfing pattern .It is very helpful to understand if there is a change of trend. This indicator find for you affidable engulfing patterns and send you an alert when a pattern is completely formed . To make this alert indicator more reliable,there is a parameter that you can change relat
FREE

Are you tired of drawing trendlines every time you're analyzing charts? Or perhaps you would like more consistency in your technical analysis. Then this is for you. This indicator will draw trend lines automatically when dropped on a chart. How it works Works similar to standard deviation channel found on mt4 and mt5. It has 2 parameters: 1. Starting Bar 2. Number of bars for calculation The starting bar is the bar which drawing of the trend lines will begin, while the number of bars for c
FREE

Liquidity Intelligence System — MQL5 市场描述 Liquidity Intelligence System 是一款机构级的 MT5 指标,用于绘制聪明的钱(Smart Money)流动性池、检测扫损反转(sweep-and-reverse)设置,并通过 16 个独立可测试的信号模型生成高汇聚度的交易信号——所有这些功能都集成在单个清爽的指标中。 工作原理 该引擎通过检测基于波段高低点(pivot)的买方流动性(BSL)和卖方流动性(SSL)区域,包括等高点(EQH)和等低点(EQL),来持续构建实时流动性图。当价格扫过流动性水平并伴随符合条件的拒绝影线(rejection wick)时,就会生成一个基础的扫损信号。然后 cross 过滤此原始信号,通过多达六个可选的汇聚层:EMA 趋势、公允价值差值(FVG)的存在、成交量激增、RSI 阈值和位移(Displacement)动量烛线质量。最终产生 16 种模型组合,范围从纯流动性扫损(模型 0)到全六重过滤器汇聚(模型 15, LQ+ALL)。 核心功能 16 种信号模型: 仅需通过单一输入即可选择任
FREE

短描述: 一款高性能的成交量情绪振荡器,通过解析蜡烛几何结构揭示隐藏的买卖压力。非常适合识别市场吸收、衰竭、背离及趋势延续。 详细描述:
Volume Momentum Delta 指标专为需要洞察标准价格柱背后真相的交易者而设计。虽然大多数成交量指标仅显示总活动,但 Volume Momentum Delta 利用高级蜡烛几何逻辑,将每根蜡烛分解为“买方”和“卖方”组成部分。与需要昂贵 Tick 数据的标准 CVD 不同,此指标针对 MetaTrader 5 的原生报价量(Tick Volume)进行了优化,使其对外汇、黄金 (XAUUSD) 和股指极其有效。它利用蜡烛实体与影线之间的关系来估算交易意图,直接在您的独立窗口中提供“模拟盘口(pseudo-tape)”读数。 核心功能: 双线情绪: 独立的买入线和卖出线让您能够精准观察哪一方动量正在减弱,而哪一方正在增强。 动态强度基准: 成交量强度线充当“波动率速度限制”,帮助您识别哪一方正对市场采取激进的控制。 报价量优化: 专为无法获取真实交易所成交量的平台构建,为零售交易者提供机构级的洞察力。 最佳实践与使用指南: 趋势确认
FREE

MT4 版本: https://www.mql5.com/en/market/product/183369
MT5 版本: https://www.mql5.com/en/market/product/183370
平滑 Heikin Ashi 指标
平滑 Heikin Ashi 指标是一款专业的趋势跟踪指标,旨在通过改进的 Heikin Ashi 平滑方法,帮助交易者识别市场方向、趋势转换以及潜在的入场或出场区域。
与标准 Heikin Ashi 指标不同,该指标采用两阶段平滑处理,以减少市场噪音,使趋势可视化更加清晰。它适用于希望获得更简洁的图表、更平滑的趋势信号以及多时间框架确认的交易者。
该指标直接在主图表上显示平滑后的 Heikin Ashi 蜡烛图,并提供可选的箭头、警报、多时间框架模式以及图表开关按钮,以提高易用性。
主要功能
直接在主图表上显示平滑后的 Heikin Ashi 蜡烛图。
支持多时间框架,用于更高时间框架的趋势确认。
趋势转换箭头指示潜在的看涨和看跌转换。
可选的趋势转换警报。
警报选项包括消息、声音、推送通知和电子邮件。
图表开
FREE

This is the famous Sunflower indicator for Metatrader5. This indicator marks possible tops and bottoms on price charts. The indicator identifies tops and bottoms in the asset's price history, keep in mind that the current sunflower of the last candle repaints, as it is not possible to identify a top until the market reverses and it is also not possible to identify a bottom without the market stop falling and start rising. If you are looking for a professional programmer for Metatrader5, please
FREE

This indicator plots the volume profile by Price on the chart
There are 5 ways to view it:
By Total Volume Traded (Premium Version); Volume Ticks(Forex) Separated by Buyers and Sellers (Premium Version); Buyers Only (Premium Version); Sellers Only (Premium Version); Business balance (Buyers - Sellers) (Premium Version); .
It is possible to select how many days the profiles will be calculated.( Premium Version)
On the current day it recalculates the histogram data for each new candlestick.
FREE

Object Synchronizer for MT4 & MT5 Never redraw your analysis again. Object Synchronizer automatically synchronizes your manually drawn chart objects across all open charts of the same symbol in real time. Whether you're a scalper, swing trader, or multi-timeframe analyst, you no longer need to repeat the same analysis on every timeframe. Draw once. Analyze everywhere. Why Use Object Synchronizer? Most traders use multiple timeframes to analyze a single instrument. For example: • XAUUSD M1
• XAUU
FREE

昨天的最高价和最低价、本周开盘价、上周的波动区间,正是多数交易者每天早上都要手动重画一遍的那几条线。 Daily Weekly Monthly Key Levels 会用你自己经纪商的 K 线自动画好,并告诉你当前价距离每一条有多远。放到多近都不会丢,因为 任何跑出视野的价位都会贴到图表边缘 ,变成带名称和价格的标签,并配一个箭头。没有信号,不重绘,也不会把图表堆满。 它画什么 前一日 的最高价、最低价和收盘价。 前一周 的最高价和最低价。 当日与当周开盘价 ,也就是盘中被高度关注、仍在走的开盘价。 前一月 的最高价和最低价(可选)。 每个价位都是一条带名称的线,按周期配色;紧凑的面板按周期分组,列出全部价位、各自的价格,以及当前价距离它有多远。距离可以按点数、按价格或按百分比显示。 放大后也不会消失的价位 在盘中周期的图表上,你的关键价位多数都落在可见价格范围之外;黄金上更是几乎全部、几乎全天如此。看不见的价位比没用还糟,因为你会默认它离得很远。任何跑到视野上方或下方的价位,都会以一个小小的价格标签贴到图表边缘,标签上有它的名称、价格,以及指出它在哪一侧的箭头。画面外的价位有好几
FREE

About:
The Nadaraya-Watson Envelope is a sophisticated yet practical technical indicator that helps traders identify overbought and oversold conditions using advanced kernel regression methods. This is the MT5 only Version.
For MT4 Version go here: https://www.mql5.com/en/market/product/158640/
Key Features ATR-Based Bands: Three upper and three lower bands provide graduated overbought/oversold zones Logarithmic Scale Calculation Center Line - bullish (teal) or bearish (red)
What is the Nad
FREE

Auto Fibonacci Buy/Sell Zones is a powerful , 100% automated trading indicator designed for MetaTrader 5. It eliminates the hassle of manually drawing Fibonacci levels by instantly detecting market swings and projecting dynamic Buy and Sell zones directly onto your chart. Whether you are a scalper, day trader, or swing trader, this indicator adapts seamlessly to any financial instrument (Forex, Crypto, Indices, Commodities) and works perfectly across all timeframes. Key Advantages & Features
FREE

产品简介 Pyramiding Entry Master 是一款专为 MT4 和 MT5 双平台设计的主图均线趋势跟踪与金字塔式加仓入场指标。它在主图上绘制四周期均线系统(MA5、MA10、MA20、MA60),并基于 55 周期趋势动量模型、成交量放大确认和多重超跌条件,自动生成三类买入信号:半路追涨(Chase)、加仓(Add)和抄底(Dip Buy),覆盖趋势加速追入、次日低吸加仓和深度超跌抄底三种典型入场场景。信号逻辑严谨、视觉层次分明,并配备独立冷却过滤与多通道提醒机制,是构建金字塔加仓交易系统的理想主图工具。 核心功能 四周期均线系统与右侧标签 系统在主线图上绘制四条均线: MA5 白色线 反映超短期价格重心, MA10 黄色线 反映短期趋势方向, MA20 品红色粗线 作为中短期趋势分水岭, MA60 绿色粗线 作为中长期趋势基准。四条均线右侧均附带同色文字标签,便于快速识别各均线位置。均线多头排列(MA5 > MA10 > MA20 > MA60)时代表趋势健康向上,是 Chase 和 Add 信号发挥最佳效力的背景条件。 MT5 版本额外支持信号 K 线染色
FREE

THE BRAIN SMC ULTIMATE "Trade Like an Institution, Analyze Like a Professional" Are you tired of cluttered charts, lagging indicators, and conflicting signals? Welcome to the era of Clean Trading.
The Brain SMC Ultimate is engineered for traders who prioritize visual clarity without sacrificing data accuracy. Utilizing the latest Smart Money Concepts (SMC) algorithms, this indicator maps institutional footprints directly onto your MetaTrader 5 chart.
CORE PREMIUM FEATURES Smart Entry Guidan
FREE

Overlay indicator on chart between 2 pairs
The Timeframe Overlay indicator displays the price action of timeframes on a single chart, allowing you to quickly assess different timeframes from a single chart. The advantage is to observe and follow the correlations of price movements in real time to help you find potential trades at a glance.
---- Symbol 1 ----
Symbol = EURUSD
Correlation Inverse = false
Display = true
Ratio
FREE

VOLATILITY AGGRESSION FLOWMATRIX
Volatility Aggression FlowMatrix is a market analysis indicator developed for MetaTrader 5 . It transforms internal measurements of volatility, directional flow and market pressure into synthetic Flow Candles , providing a structured visual representation of market behavior. The calculation model evaluates price displacement, candle efficiency, closing position, relative volatility and directional pressure . It also includes internal analysis of Delta, Cumulativ
FREE
Next Arrival : Flip or Die Trading Arena. Flip a trading account: https://flipordie.com/chapter-1-thirteen-doublings-double-a-trading-account/
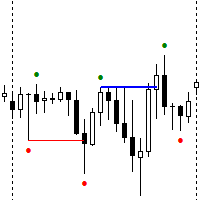
The Expert Advisor for this Indicator can be found here: https://www.mql5.com/en/market/product/115445 The Break of Structure (BoS) and Change of Character indicator is a powerful tool designed to identify key turning points in price movements on financial charts. By analyzing price action, this indicator highlights instances where the market shifts fr
FREE
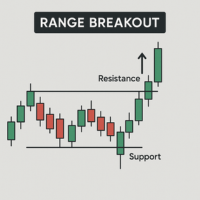
If you love this indicator, please leave a positive rating and comment, it will be a source of motivation to help me create more products <3 Key Takeaways Automatically draws Range High and Range Low boundaries for a chosen time period. Alerts when price breaks above or below the defined range. Support sending notifications via alert, email, notification when breakout occurs. Can be used as a trade signal in breakout-based strategies. However, like all indicators, it isn't foolproof, to avoid
FREE

产品简介 Dynamic Fibonacci Deviation 是一款专为 MT4 和 MT5 双平台设计的自适应斐波那契水平线主图指标。它创新性地将 EMA 动态中线、标准差波动率与斐波那契比例相结合,构建出能够随市场波动自动伸缩的智能支撑阻力系统。该指标通过超买超卖识别与回落反弹信号,帮助交易者在均值回归行情中精准捕捉高概率的买卖时机,并提供完善的实时状态监控与多通道信号提醒。 核心功能 自适应斐波那契通道与 K 线染色 系统以 EMA 作为动态中线,结合标准差计算当前市场的波动幅度,并通过 EMA 平滑后的最大偏离倍数动态调整斐波那契比例。通道上下各绘制 6 条水平线,涵盖 0.191、0.5、0.75、1.0、1.382、1.618 等经典斐波那契比例,颜色从绿色(低位)渐变到紫色(高位),让价格所处的波动区间一目了然。图表右侧会实时显示当前的 中线价格 和 标准差数值 。 MT5 版本额外支持趋势 K 线染色功能 ,让超买超卖状态通过颜色变化更加直观。 做多信号 Oversold (超卖) :当价格收盘价跌破下轨第 4 水平线 (Dn4, 1.0
FREE

LT HiLo Activator 将知名交易员 Robert Krausz 创建的经典趋势跟踪方法带到您的图表中。它是一款重要的技术分析工具,可帮助您捕捉市场的大幅波动,并避免逆市场趋势交易。 HiLo 实用、直观且易于快速解读,它就像一条方向性的支撑与阻力“阶梯”,帮助您更轻松地确定进场、出场以及资金保护位置。
如何在实际交易中应用 上升趋势(动态支撑): 指标线绘制在 K 线下方,作为一个优秀的技术区域,方便您设置并移动多单止损。 下降趋势(动态阻力): 指标绘制在价格上方,提示市场走弱,并帮助保护您的空头仓位。 周期反转: 当价格穿越并收盘于 HiLo 线之外时,指标会“翻转”到另一侧,提示新的潜在趋势可能开始。
指标主要功能 简洁客观的设置: 只需点击几下,您仅通过调整基础周期即可校准指标,使其能够轻松适配从短周期快速剥头皮交易到中长线持仓交易的不同风格。 精准时刻提醒: 可配置屏幕弹窗、手机 Push 推送通知或电子邮件提醒。一旦发生趋势交叉,系统会自动通知您,无需一直盯盘。 图表视觉信号: 可选择在图表上启用买入/卖出箭头,并可调整其垂
FREE
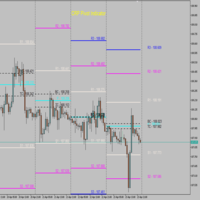
CPR Pivot Lines It Will Draw Pivot Point R1,R2,R3 S1,S2,S3 Tc Bc Best Part Is That You Can Even Add Values Of High,Low,Close Manually Also To Get Your All Levels On Chart.So If Your Broker Data Of High ,Low ,Close Is Incorrect Then You Don’t Have To Depend On Them Anymore. You Can Even Modify All Lines Style. It Will Show Line In Floting Style And Not Continues Mess.
FREE

This is an optimized version of the Waddah Attar Explosion (WAE) indicator, designed to adapt to different asset classes.
Standard WAE indicators often use a fixed "DeadZone" calculation (usually set to 20). This fixed value may not be suitable for high-volatility assets like Bitcoin, Gold, or Indices (US30), potentially leading to incorrect filtering. This Auto-Adaptive version addresses that calculation issue. The indicator implements a dynamic formula based on ATR and SMMA to automatically ca
FREE

Tabajara Rules for MT5 , based on Professor André Machado’s Tabajara Setup, indicates the market direction using moving averages when there are candles aligned with the direction of the moving average.
The indicator contains the color rule applied to the candles and the moving average.
It allows changing the parameters: period and smoothing method of the moving average.
It also allows changing the colors of the candles (borders and filling) and of the moving average.
Professor André Machado’s
FREE

Renko是一个永恒的图表,也就是说,它不考虑时间段,而是考虑价格变化,这使得图表上的价格变化更加清晰。
Hyper Renko是提供此功能的指标。
要进行配置,您只有一个参数,即您要使用的对号*中蜡烛的大小。
*勾号:是资产的最小可能变化。
感谢您选择超级交易者指标。
维基百科: 连环图表示变量值(例如金融资产的价格)随时间变化的最小变化。仅当所考虑的值(例如价格)变化了某个最小数量时,图形才会随着时间前进。例如,在考虑资产价格R $ 1变动的Renko图表上,仅当变动发生时(向上或向下)才绘制新的“砖”-不管变动发生了多长时间以及交易量。因此,如果在水平轴上绘制时间,在垂直轴上绘制价格变化,则所有“砖”的高度都相同(价格变化相同),尽管它们在视觉上相同,但它们之间的间距却代表不同的时间量。
FREE

Volume Profile Delta — Indicator for MetaTrader 5 Volume Profile Delta is an indicator that displays the difference between buying volume and selling volume recorded on each bar, represented as a histogram at the bottom of the chart. What this indicator does On each bar it calculates the difference between the volume associated with upward movements and the volume associated with downward movements. The result is shown as a bar in the lower histogram, making it possible to observe whether buying
FREE

POI Detector – Automatic Smart Money Points of Interest (POI) Structure Identifier The POI Detector is a MetaTrader 5 indicator developed for traders who use Smart Money Concepts (SMC) and Price Action methodologies. It automates the identification of relevant Points of Interest (POIs) on the chart through strict detection of the ABCD pattern with growing legs and C-Level breakout confirmation (DE extension). Key Features ABCD Pattern Detection Algorithm: Identifies complete structures where
FREE

Special offer : ALL TOOLS , just $35 each! New tools will be $30 for the first week or the first 3 purchases ! Trading Tools Channel on MQL5 : Join my MQL5 channel to update the latest news from me AI Channels 指标利用 滚动K均值聚类 ——一种在聚类分析中强大的机器学习技术——实时提供基础价格趋势的见解。该指标根据聚类价格数据创建自适应通道,使交易者能够做出有关趋势方向和市场状况的明智决策。 该指标还包括一个 跟踪止损选项 ,提供了更灵活的风险管理方法。 查看更多MT4版本: AI Channels MT4 查看更多产品: 所有产品 如何使用AI Channels指标 每个通道的极端值为确定趋势方向提供了宝贵的见解: 上通道极端值: 价格突破此水平可能表明上升趋势。 下通道极端值: 价格跌破此水平可能表明下降趋势。 调整 窗口大小 (用于聚
FREE

VR 网格指示器 设计 用于创建具有用户定义设置的图形网格。与 标准网格 不同,VR 网格用于构建 圆形关卡 。根据用户的选择,轮次级别之间的步长可以是任意的。此外,与其他指标和实用程序不同,即使时间段发生变化或终端重新启动,VR Grid 也能保持网格的位置 。 设置、设置文件、演示版本、说明、问题解决,可以从以下位置获取 [博客]
您可以在以下位置阅读或撰写评论 [关联]
版本为 [MetaTrader 4] 垂直级别 基于实际时间间隔并 忽略缺失 或不存在的周期。因此,级别之间的步长严格对应于用户选择的值。 使用 VR 网格指标时,交易者 可以更改任何级别的垂直线和水平线的样式 、颜色和粗细。这使您可以控制金融工具的 回合水平 。 整数位是 以两个或多个零结尾 的价格(例如:1.23500、5.65900、1923.200)。人们相信,这样的水平 经常充当 作为支撑或阻力的强点。 Horizontal line settings Horizontal line step Horizontal line color Horizontal line style Horizonta
FREE

Volume Weighted Average Price is used by financial institutions to place large trades at what is considered the fair value for the session. Standard deviation channels around VWAP provide potential entry points for mean reversion or breakout strategies, and the VWAP itself can act as a high quality exit level. If you've heard that volume-based analysis doesn't work for forex and CFDs, try looking at VWAP with standard deviation bands on a chart, and note the frequency with which price reacts to
FREE
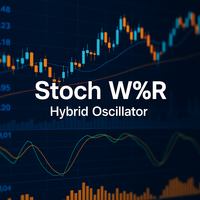
StochW%R 动量震荡指标 – 您的智能混合动量指标 精准。降噪。更可靠。 厌倦了在波动市场中产生虚假信号的传统震荡指标? StochW%R 动量震荡指标 是分析动量领域的演进,它将**随机指标 (Stochastic) 和 威廉指标 (%R)**的优点集于一身,成为一个强大且可自定义的指标。 核心优势: 凭借其智能融合算法,它能 减少市场噪音 并提供 更清晰的信号 ,同时提前预警趋势变化。 为什么这个指标更优越? 两种震荡指标的智能融合 随机指标(平滑化): 在识别超买/超卖条件时,对噪音的敏感度较低。 威廉指标(反向和调整): 对价格的剧烈波动反应更灵敏。 结果: 一条 更精确的动量线 ,能够过滤虚假信号并提高可靠性。 用于完美时机的信号线 与 信号线 (StochW%R 的移动平均线)的交叉有助于: 在价格到达极端区域之前 预测反转 。 确认动量变化 ,且滞后性小于传统震荡指标。 完全自定义 通过**“Stoch Weight” 参数,您可以调整 灵敏度和平滑度之间的平衡**: > 0.5: 受随机指标影响更大(适用于横盘市场)。 < 0.5: 受威廉指标影响更大(非常适合强
FREE

Plus ADX 14 — 趋势强度与方向 Plus ADX 14 是一款适用于 MetaTrader 5 的技术指标,旨在帮助用户分析市场的趋势强度以及当前占主导地位的方向。 该指标显示在独立窗口中,范围为 0 至 100,并将 ADX 与两个方向性指标 +DI 和 -DI 集成在一起。 图形元素 白色 ADX 线: 衡量趋势强度。 绿色 +DI 线: 表示正向方向强度。 红色 -DI 线: 表示负向方向强度。 20 水平线: 低强度市场运动的参考水平。 25 水平线: 主要趋势确认参考水平。 70 水平线: 高强度区域。 自动市场状态识别 Plus ADX 14 会在指标子窗口的顶部显示当前市场状态的自动分类: Consolidation: ADX 低于设定水平,或者两条方向线非常接近。 UpTrend: ADX 达到最低水平,并且 +DI 高于 -DI 。 DownTrend: ADX 达到最低水平,并且 -DI 高于 +DI 。 该分类总结的是指标当前的数学状态,并不代表自动执行买入或卖出操作。 如何解读 ADX 上升可能表示市场运动正在增强,而不代表具体的上涨或下跌方向。 可
FREE

Apex Swing VWAP is an advanced indicator for MetaTrader 5 that combines VWAP (Volume Weighted Average Price) analysis with automatic detection of significant swing points. This combination provides accurate market sentiment insight and potential reversal points. Key Features Integrated Technical Analysis - Dynamic VWAP from relevant swing points - Historical VWAP for long-term trend analysis - Multiple configurable VWAP periods
Recommended Trading Types - Swing Trading for medium-term trends -
FREE

Force Scanner MT5 is a real-time market strength indicator that analyzes 10 technical indicators and summarizes them in an intuitive panel with clear BUY or SELL signals.
Works on any asset: Forex, Synthetic Indices (Crash, Boom, Volatility), Commodities, Cryptocurrencies and more.
WHAT IT DOES: - Calculates Buying and Selling Force as a percentage - Shows BUY or SELL signal with confidence level - Analyzes: RSI, ADX, EMA, Bollinger Bands, Stochastic, MFI, CCI, Williams %R, Current Candl
FREE

RSIBSSignals — RSI 支撑阻力分区信号指标 平台: MetaTrader 5 RSIBSSignals 在标准 RSI 上增加分区着色、五条水平参考线,以及价格图表上的箭头和文字标签。指标只做技术形态识别与提示,不执行交易。 信号类型: 卖出:RSI 在超买区拐头向下;或 RSI 在阻力区,并出现带明显上影线的强阴线。 买入:RSI 在超卖区拐头向上;或 RSI 在支撑区,并出现带明显下影线的强阳线。 每类信号可显示用户自定义的英文文字标签,例如 Overbought、Oversold、Resistance、Support。标签仅用于视觉区分,不代表交易结果。 过滤功能:
可选过滤包括收盘确认、RSI 拐头确认、影线拒绝、强实体 K 线、最低 ATR 占价格百分比、同类型信号最小间隔、区域去重。每项均可独立开关。 图表与提醒:
副图 RSI 按区域变色,并显示五条水平参考线。主图在卖出信号上方绘制向下箭头和文字,在买入信号下方绘制向上箭头和文字。箭头与文字距离按 ATR 倍数计算。图形对象仅在最近设定根数内创建并自动回收;回测和优化时不创建图形对象。
支持弹窗提
FREE

Aurex Market Structure - CHoCH/BOS (Fractal) A structure-detection indicator that identifies swing highs/lows using a symmetric fractal filter, then flags Break of Structure (BOS) and Change of Character (CHoCH) events when confirmed closes cross those swing levels. Detection method Swing points are located using a fractal window of configurable length: a high is registered when it is the local extreme across the surrounding bars on both sides, and the same logic applies inversely for lows. Once
FREE

# Indicador Daily High - Danilo Monteiro - MT5
## Descrição O Daily High/Low Labels é um indicador personalizado para MetaTrader 5 que exibe automaticamente as máximas e mínimas diárias no gráfico, facilitando a identificação rápida dos níveis importantes de preço. O indicador marca os preços com etiquetas e linhas horizontais, permitindo uma visualização clara dos níveis críticos do dia atual e anterior.
## Principais Características
### 1. Marcação Automática - Exibe automaticamente as máxi
FREE

The XR Gartley Pattern MT5 is an indicator which displays and alerts Gartley pattern detected on the candlestick chart. It also displays potential trade with calculated Take Profit and Stop Loss. After purchasing XR Gartley Pattern Indicator, you can immediately download this indicator from the MT4-MT5 Market and start using it because all features are set to default, is not necessary to change any parameter. List of all our available tools for Traders: https://www.mql5.com/en/users/mqlblue/sell
FREE

BlueDigitsFx 官方生态系统入口 此免费工具是 BlueDigitsFx 交易基础设施生态系统的一部分。 通过 BlueDigitsFx 官方机器人获取更新、工作流程资源、产品发布信息以及官方生态系统访问权限。 Telegram 生态系统
官方网站
MT4 版本
BlueDigitsFx Open Trades MT5 —— 用于主动交易管理的实时点数监控工具 BlueDigitsFx Open Trades 是一款免费的 MT5 工具,可直接在图表上实时显示所有未平仓交易的总点数结果。 该工具采用清晰的颜色编码显示方式,帮助交易者快速识别盈利和亏损仓位,并监控多个活跃交易及货币对的整体表现。 它专为希望获得更清晰交易视图、更快速仓位监控以及无需频繁切换多个窗口即可管理交易会话的交易者而设计。 通过在图表上持续显示未平仓交易的整体表现,交易者无需频繁打开 MetaTrader 终端窗口即可更快做出反应。
主要功能 实时点数显示 —— 直接在图表上监控所有未平仓交易的总点数结果。 颜色编码交易概览 —— 快速识别正收益和负收益交易表现。 多交易监控 —— 适用于同时管
FREE
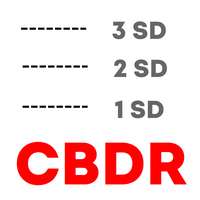
Haven CBDR 是一个易于使用的指标,可在图表上显示 ICT “中央银行交易商区间”(CBDR)。该程序绘制矩形,标示 CBDR 价格区间,并显示额外的标准差线,以评估可能的支撑和阻力水平。产品允许自定义 CBDR 的时间区间、显示的日历天数、图形元素的颜色和样式,并根据图表主题自动调整配色方案。此外,指标还会绘制垂直线,标示每日蜡烛图的开盘,有助于掌握市场动态。 其他产品 -> 点击这里 交易者如何使用: 参数设置:
如有需要,可调整会话的开始和结束时间,并自定义显示参数(颜色、矩形边框样式、标准差线和标记)。 区间分析:
使用显示的矩形快速评估所选期间内的 CBDR 价格区间。标准差线有助于确定潜在的反转或延续水平。 寻找交易信号:
每日蜡烛开盘的垂直线和区间信息,为交易者提供更多参考,帮助确定进出场位置,从而更好地与机构资金动向同步。 这款工具适合希望在交易会话内清晰掌握价格区间,并基于客观图表分析优化策略的交易者。
FREE

The fact that round number levels have a significant influence on the market cannot be denied and should not be overlooked. These psychological levels are used by both retail Forex traders and major banks that deal in Forex. Very simple and effective indicator and most importantly free. ////////////////////////////////////////////////////////////////////////////////////////////////////////////////////////////////////////////////////////////// The program does not work in the strategy tester.
FREE

Buy Sell Signal Low TF gives buy/sell signals and alerts with up and down arrow at potential reversal of a pullback or a trend continuation pattern in low timeframe. This is an indicator which gives signals based on trend => It works best in trend market with the principle is to ride on the trend not trade against the trend.
The components of Buy Sell Signal Low TF: - The trend is determined by SMMA 13 , SMMA 21 and SMMA 35 ( can be changed manually to suit your preference). - The signal is b
FREE

SMART SD ARROW INDICATOR
Trade Smarter, Not Harder: The Smart SD Arrow Indicator That Paints Clear Buy & Sell Signals Right On Your Chart!
Finally, an All-in-One Supply & Demand Tool That Doesn’t Just Draw Zones—It Gives You Precise, Actionable Entry Arrows. Stop Analyzing, Start Executing.
Dear Trader,
Let's be honest. You've tried indicators that draw complicated zones all over your chart. They look smart, but when it's time to pull the trigger, you're left with the same old question:
FREE

Cybertrade Keltner Channels - MT5 Created by Chester Keltner, this is a volatility indicator used by technical analysis. It is possible to follow the trend of financial asset prices and generate support and resistance patterns. In addition, envelopes are a way of tracking volatility in order to identify opportunities to buy and sell these assets.
It works on periods longer than the period visible on the chart. All values are available in the form of buffers to simplify possible automations.
FREE

Know exactly how much time remains before the current candle closes. HMS Candle Timer MT5 is a lightweight and customizable candle countdown indicator designed for traders who want a clear view of the remaining time on the active candle. The countdown is displayed directly near the current candle, keeping important timing information visible without turning your chart into a complicated dashboard. Whether you trade lower timeframes or monitor longer market structures, HMS Candle Timer provides a
FREE

Easily get all relevant economic events of the current day right into your chart, as markers. Filter what kind of markers do you want: by country (selected individually) and by Importance (High relevance, Medium, Low or any combination of these). Configure the visual cues to your liking. If there is more than one event set to the very same time, their Names will be stacked and you will see the messages merged with the plus (+) sign on the marker. Obviously that long or too much events on the sam
FREE

English VESTA Gold Signals — selective entry arrows for XAUUSD on the M1 chart only . VESTA marks one thing and marks it clearly: where to enter. A green arrow for a buy, a red arrow for a sell, printed on the bar that produced the signal and never moved afterwards. It is built to be selective. Fewer arrows appear than on a fast scalping tool, and each one is meant to be given room and time rather than closed within minutes. Exits are left to you. The indicator does not place a take profit,
FREE

GDXM Fractal PO3 Custom HTF Master the Narrative: Higher Timeframe Fractals at Your Fingertips The GDXM Fractal PO3 Custom HTF is a professional-grade visualization tool designed specifically for Inner Circle Trader (ICT) and Smart Money Concept (SMC) practitioners. In the world of high-probability trading, understanding the Power of 3 (PO3) —Accumulation, Manipulation, and Distribution—across multiple timeframes is the key to building a winning market narrative. Why Every ICT Trader Needs This
FREE

Strifor Pivot ATR Target
MetaTrader 5 的 ATR 目标枢轴指标及分析面板 Strifor Pivot ATR Target 是一款用于日内和中期交易的工具,将经典枢轴点与动态 ATR 目标和扩展分析面板结合。该指标帮助交易者提前评估交易区间、可能的价格反应区域及价格潜力,免去手动计算和主观判断。 主要功能 自动绘制枢轴水平(PP, R1–R3, S1–S3) 根据平均波动率计算 ATR 目标百分比 上涨与下跌的独立目标(ATR Long / ATR Short) 信息面板显示: 当前 ATR 值 当日区间已完成百分比 剩余潜力 从高点/低点的运动评估 可考虑前一交易日的数据 灵活设置线条和面板显示 支持所有类型的工具:指数、货币、商品、加密货币 完全兼容 MT5(套期保值和净额账户) 工作逻辑
指标根据前一日的数据绘制枢轴水平,并确定 ATR(14) 运动目标。
ATR 目标显示统计上可能的日内区间,帮助判断: 是否有足够潜力进入交易 市场是否已完成大部分日内波动 基于波动率的潜在支撑/阻力水平 分析面板实时更新,方便追踪市场关键波动参数,减少
FREE

ModGod Institutional MACD - Normalized Momentum Oscillator The ModGod Institutional MACD is not your standard oscillator. Built specifically to work in synergy with the ModGod Scalp Pullback indicator, this tool replaces traditional EMAs with a highly smoothed Triangular Moving Average (TMA) engine and ATR-driven normalization. By normalizing the MACD values using dynamic market volatility (ATR), the oscillator is trapped within precise mathematical boundaries (Supply and Demand zones). This
FREE
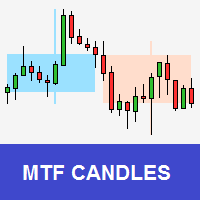
Tool that allows viewing candles in multiple timeframes. This way, it helps the analysis in multiple timeframes.
This is another product developed by Renato Fiche Junior and available to all MetaTrader 5 users!
Input Parameters
- Option 1 - TimeFrame: Standard MT5 timeframe - Option 2 - Custom TimeFrame (in minutes): Or, if this value is different from zero, the timeframe will be customized. This allows you to choose timeframe other than the MT5 standard. - Total Candles: Number of candles. -
FREE

ATS Daily Volume Profile 显示市场今天和昨天真正成交的位置:每天一个水平成交量直方图、POC(成交最多的价格)和价值区。 显示内容 - 今天和昨天的每日成交量分布,绘制在K线后方 - 热力颜色:成交少的地方为冷蓝色,成交量最集中的地方为金色和红色 - 每一行带 3D 深度阴影(可关闭) - POC 为粗金线,价值区高点和低点为虚线,价值区之外的行变暗 - 小面板:今日 POC、价值区、价格在价值区之上 / 之内 / 之下、成交量来源 成交量来源 当经纪商提供真实交易所成交量(期货、股票)时自动使用。现货黄金、外汇和大多数 CFD 没有中央交易所,因此改用跳动成交量(价格变动次数)。这是 MetaTrader 中成交量分布的标准做法,面板始终告诉您正在使用哪一种。 设置 成交量来源(auto / real / tick)、每个分布的行数、价值区 %、直方图宽度、3D 阴影开/关、热力颜色开/关、颜色、面板开/关、主题和位置。 适用于任何品种,在 M5 到 H1 周期上效果最佳。本指标只负责绘图:从不开仓、修改或平仓。 如果这个工具对您有帮助,欢迎留下简短评价。有问
FREE

QuantMatrix Wick Pressure QuantMatrix Wick Pressure is a technical indicator for MetaTrader 5 that measures the relationship between upper and lower candlestick wicks and converts this information into a numerical pressure measurement. Candlestick wicks represent price movement that occurred beyond the candle body before price returned from those levels. The indicator measures this rejection behavior over consecutive candles and displays the result in a separate indicator window. Positive values
FREE

Chronovex Galacticus Gold M05 Chronovex Galacticus Gold M05 是一款专为 MetaTrader 5 开发的技术分析指标,主要用于辅助交易者分析 XAUUSD(黄金) ,并重点针对 M5(5分钟)时间周期 进行了优化。 该系统旨在让市场分析更加直观、清晰,通过综合分析趋势、动能强度、潜在反转、波动性以及关键价格区域,为交易者提供辅助参考。 主要功能 市场条件确认后显示 BUY(买入)信号 市场条件确认后显示 SELL(卖出)信号 当市场没有明确交易机会时进入 NEUTRAL(中性)模式 识别当前 市场趋势及趋势强度 显示策略计算的 ENTRY(入场价格) ️ 根据当前信号动态计算 STOP(止损) 提供 TP1、TP2、TP3 和 TP4 四个目标位 根据系统的价格扩展逻辑提供更远目标区域 新的确认信号出现时提供 声音提醒 动态K线颜色,帮助快速判断当前市场状态 ️ 在图表上直接显示买入和卖出确认箭头 ️ 信息面板显示趋势、信号、入场、止损以及目标价格 指标如何工作?
FREE

The Pivot Point indicator automatically calculates and displays the pivot point line and support and resistance levels. Pivot can be calculated according to the Classic, Floor, Fibonacci, Woodie, Camarilla or DeMark formula. It is also possible to select the period for calculating the indicator. A trader can choose from daily, weekly, monthly, or user-defined periods.
Types of pivots Classic Floor Fibonacci Woodie Camarilla DeMark
Main features The indicator shows the current and historic
FREE

RoundNumbers indicator is a simple and powerful psychological price levels. Trader usually use these levels as a Support and Resistance (SnR). Indicator Input: Levels - Numbers of levels drawn on chart. Default 30 levels. BoxSize - Box size drawn on each levels, indicate buffers around levels. Default value 1pips (10point) above and below each levels. ZoneSize - Distance between each levels, default value 10pips (100point). Style & Colours - User inputs customization. For MT4 version, p
FREE

Session Indicator — Forex Trading Sessions Visualizer Overview Session Indicator is a professional MT5 indicator that displays the four major forex trading sessions (Sydney, Tokyo, London, New York) as colored horizontal bands on your chart. Never miss a trading session again! Free Product | Works on Any Broker | Auto-Detects Timezone Features Auto-Detects Broker GMT Offset Works automatically on any MT5 broker (XM, IC Markets, FXCM, etc.) No manual timezone configuration needed Label
FREE

Trading Performance Monitor 适用于 MetaTrader 5 的多 EA 绩效面板,可自动检测在您已打开的图表上运行的 EA(智能交易系统),并实时跟踪它们各自的表现。 Trading Performance Monitor 是一款适用于 MetaTrader 5 的信息型指标。它读取账户历史记录和当前持仓,按 EA 对数据进行分组,并通过七个页面呈现:表现、交易、风险指标、回撤、月度历史以及按品种划分的结果。该指标不下达任何订单,也不修改任何持仓。 Overview 同时运行多个 EA 的交易者通常没有简单的方法查看哪个 EA 在盈利、哪个在亏损。账户历史记录将所有策略混合在一起,终端显示的是整个账户的结果,而不是每个 EA 单独的结果。 该指标会扫描每一个已打开的图表,识别每个图表上附加的是哪个 EA,并通过魔术数字(magic number)将这些图表与属于它们的持仓和已平仓交易进行匹配。没有魔术数字的持仓会被单独归类为手动交易,因此自主交易不会与自动化结果混淆。由于该指标只读取数据,因此可以附加到任何图表上,包括已经运行着 EA 的图表,而不会干
FREE
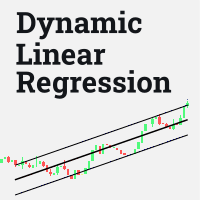
Este indicador traça uma reta baseada em regressão linear, esta reta é dinâmica e é atualizada a cada tick. O cálculo de regressão linear é feito considerando o número de candles definido pelo tamanho da janela fornecida pelo usuário. São traçadas duas linhas, uma superior e uma inferior, para guiar a estratégia do usuário, a distância dessas linhas para a linha central deve ser configurada. É possível definir os estilos, cores e espessuras de cada uma das linhas.
Esse indicador foi inicialmen
FREE

Daily Entry M1 – MT5 指标 Daily Entry M1 是一款为 MetaTrader 5 开发的指标,专为专注于 M1 时间周期短线日内交易机会的交易者设计。 该指标会分析市场状况,并在其内部入场条件得到确认后,直接在图表上显示清晰的 BUY 和 SELL 箭头。 该指标旨在寻找潜在的市场转折区域,并尝试识别接近日内顶部或底部的入场机会,帮助交易者专注于可能的反转机会,而不是随机的市场位置。 每个交易箭头都带有其自身预设的目标水平,使交易者能够立即看到与该特定信号相关的目标。 Daily Entry M1 的主要目标是提供一个简洁且实用的交易环境,让交易者能够快速识别入场信号及其对应目标,而不会让图表变得过于复杂。 主要功能 专为 MetaTrader 5 设计 针对 M1 时间周期进行优化 清晰的 BUY 和 SELL 入场箭头 尝试识别接近潜在市场顶部和底部的入场机会 专注于可能的日内反转区域 每个箭头都包含其自身目标 目标水平与对应信号相关联 内置新交易信号提醒 支持 MetaTrader 5 推送通知 当出现新的 BUY 或 SELL 信号时可以接收通
FREE

秒级多时间框架图表 (v3.0) 是一款适用于 MetaTrader 5 的指标,可将基于自定义秒、分钟或小时周期的价格走势直接显示在当前活动图表上。现在还新增了交互式图表内控制面板,可同时管理多个自定义时间框架图表。
主要功能 1. 自定义时间框架计算 将价格数据聚合为基于自定义 秒、分钟或小时 的时间框架。 可配置的回溯范围决定用于计算的基础时间框架 K 线数量。 2. 同时运行多个图表 可同时运行任意数量的独立自定义时间框架图表,每个图表均拥有独立且可配置的插槽。 每个插槽均可独立设置时间框架、图表类型、颜色和显示状态。 插槽可以显示在当前活动图表窗口中,也可以显示在独立的子窗口中。 3. 图表类型选择 每个插槽均支持 标准 K 线 和 Heiken Ashi(平均K线) 显示模式。 每个插槽均可独立设置多头和空头 K 线的颜色。 4. 交互式面板与插槽管理 通过图表内控制面板,可以添加、编辑、隐藏和重新分配任意插槽。 当插槽发生变化时,系统会自动附加、替换和移除相应的底层图表实例——无需手动重新添加指标。 面板设置和插槽配置会在不同图表会话之间自动保存。 支持浅色和深色面板
FREE
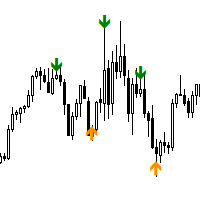
Next Arrival : Flip or Die Trading Arena. Flip a trading account: https://flipordie.com/chapter-1-thirteen-doublings-double-a-trading-account/ Swing Points Indicator for MetaTrader 5
The **Swing Points Indicator** is a custom-built technical tool designed for MetaTrader 5 (MT5), primarily used for identifying crucial reversal points in price action. By plotting swing highs and swing lows, it highlights potential trend reversals, making it a valuable tool for traders relying on price action an
FREE
MetaTrader 市场 - 在您的交易程序端可以直接使用为交易者提供的自动交易和技术指标。
MQL5.community 支付系统 提供给MQL5.com 网站所有已注册用户用于MetaTrade服务方面的事务。您可以使用WebMoney,PayPal 或银行卡进行存取款。
