适用于MetaTrader 5的免费技术指标 - 7

Developed by Jack Hutson in the 80's, the Triple Exponential Moving Average (a.k.a. TRIX ) is a Momentum technical indicator that shows the percentage of change in a moving average that has been smoothed exponentially 3 times. The smoothing process was put in place in order to filter out price movements that are considered insignificant for the analysis period chosen. We at Minions Labs found hard to follow the smoothness of the original TRIX line, so we colored the TRIX line with BUY and SELL t
FREE

An “inside bar” pattern is a two-bar price action trading strategy in which the inside bar is smaller and within the high to low range of the prior bar, i.e. the high is lower than the previous bar’s high, and the low is higher than the previous bar’s low. Its relative position can be at the top, the middle or the bottom of the prior bar.
The prior bar, the bar before the inside bar, is often referred to as the “mother bar”. You will sometimes see an inside bar referred to as an “ib” and its
FREE

Ultron Candle Timer
Used for any timeframe to keep track of time remaining on current candle. User can change inputs and colors. Never wonder again about the time remaining until the next candle. Will work on any market and any chart. Adjust the color to blend in with any of your current chart template. Its a very simple and easy to use indicator but it comes in handy
FREE

MT4 Version Fibonacci Bollinger Bands MT5 Fibonacci Bollinger Bands is a highly customizable indicator that shows areas of support and resistance. This indicator combines the logic for the Bollinger Bands with the Fibonacci level. Fibonacci Bollinger Bands is the first indicator in the market that allows the user to 100% customize up to 12 Fibonacci levels, the Moving Average type and the price data source to use for the calculations. This flexibility makes the Fibonacci Bollinger Bands easily
FREE

This indicator created based on original John Carter's TTM_Squeeze indicator and represents "squeeze" of the market which can be followed (or maybe not) by significant moves. Original indicator prints black dots when Bollinger Bands are inside Kelthner Channels and exactly this implemented in this custom version. Instead of original implementation as momentum indicator MACD indicator with standard settings 12-26-9 is being used. Mainly, the indicator is useful for understanding when it's better
FREE

Channels indicator does not repaint as its based on projecting the falling and raising channels. As a trader you need a path to be able to place your buy and sell trades such as: Supply and Demand , Falling & raising channels. Falling and raising channels can be in any time frame and also can be in all time frames at the same time and the price always flows within these channels. Experienced trades will draw the key levels and channels around the time frames. But, they will not be able to draw
FREE

交易实用必备工具指标 波浪自动计算指标,通道趋势交易 完美的趋势-波浪自动计算通道计算 , MT4版本 完美的趋势-波浪自动计算通道计算 , MT5版本 本地跟单复制交易 Easy And Fast Copy , MT4版本 Easy And Fast Copy , MT5版本 本地跟单复制交易 模拟试用 Easy And Fast Copy , MT4 模拟账号运行 Easy And Fast Copy , MT5 模拟账号运行 "Cooperative QQ:556024 " "Cooperation wechat:556024" "Cooperative email:556024@qq.com" 强烈推荐趋势指标, 波浪的标准自动计算 和 波浪的标准自动计算MT5版本
KDJ指标又叫 随机指标 ,是一种相当新颖、实用的技术分析指标,它起先用于期货市场的分析,后被广泛用于股市的中短期趋势分析,是期货和股票市场上最常用的技术分析工具。 随机指标KDJ一般是用于股票分析的统计体系,根据统计学原理,通过一个特定的周期(常为9日、9周等)内出现过的最高价、最低价及
FREE

StopLevel 仪表控制 STOPLEVEL 水平。当液位发生变化时,它会发出警报信号。 STOPLEVEL - 设置止损订单的当前收盘价的最小抵消点数,或允许的最小止损/止盈点数。 STOPLEVEL 的零值意味着没有限制止损/止盈的最小距离,或者交易服务器使用外部机制进行动态水平控制,无法传输到终端。在第二种情况下,STOPLEVEL 实际上是“浮动的”。 指标设置: color_ - 级别的区域颜色 draw_bars - 用于显示级别区域的条数 width_price - 价格标签的厚度 仪表控制 STOPLEVEL 水平。当液位发生变化时,它会发出警报信号。 STOPLEVEL - 设置止损订单的当前收盘价的最小抵消点数,或允许的最小止损/止盈点数。 STOPLEVEL 的零值意味着没有限制止损/止盈的最小距离,或者交易服务器使用外部机制进行动态水平控制,无法传输到终端。在第二种情况下,STOPLEVEL 实际上是“浮动的”。 指标设置: color_ - 级别的区域颜色 draw_bars - 用于显示级别区域的条数 width_price - 价格标签的厚度
FREE

Descubre el poderoso aliado que te guiará en el laberinto de los mercados financieros. Este indicador revolucionario te llevará de la incertidumbre a la claridad, permitiéndote identificar con precisión los puntos de inflexión del mercado. Mejora tus decisiones de entrada y salida, optimiza tus operaciones y ¡multiplica tus ganancias con confianza.
Ahora con alertas en tu pc o móvil
¡Para más información, te invitamos a unirte a nuestro canal de Telegram en https://t.me/Profit_Evolution ¡
FREE

Introducing the Quasimodo Genie, a powerful indicator for MetaTrader 5 that automatically identifies the Quasimodo or Over and Under pattern. This indicator is perfect for traders who want to take advantage of this popular chart pattern and make profitable trades. With the Quasimodo Genie, you can easily find the best swing points for the Quasimodo pattern and place virtual trades with stop loss and take profit levels. The Quasimodo Genie is easy to use and comes with a range of customizable set
FREE

Session Killzone Indicator
Indicator that helps you to identify the killzone times of both London and NewYork sessions which usually is the most times for high volatility and taking liquidity from the market. Killzone times are configurable through indicator parameters. The indicator adjusts the range of the killzones based on the daily trading range.
FREE

Introduction to Fractal Moving Average Fractal Moving Average indicator was designed as part of Fractal Pattern Scanner. Inside Fractal Pattern Scanner, Fractal Moving Average Indicator was implemented as multiple of chart objects. With over thousands of chart object, we find that it was not the best and efficient ways to operate the indicator. It was computationally too heavy for the indicator. Hence, we decide to implement the indicator version of Fractal Moving Average indicator to benefit ou
FREE

FusionAlert StochRSI Master is an indicator available for MT4/MT5 platforms, it is a combination of RSI & Stochastic indicator which provide "alerts" when the market is inside "overbought and oversold" regions combined for both indicators, results in more precise and accurate signals to be used as a wonderful tool, in the form of "buy or sell" signals. This indicator comes with many customization options mentioned in the parameter section below, user can customise these parameters as needful. Jo
FREE

Cybertrade ATR Trend Zone - MT5 The indicator shows, by calculating the ATR (Average True Range), the zone of probable price resistance. Indicated to be used as a probable exit point of an operation.
It works on periods longer than the period visible on the chart. All values are available in the form of buffers to simplify possible automations. This indicator is the same one we use in our EA. Also check out our other products.
FREE

Volume pressure and oscillator overbougth - oversold condition togedther. Signals appears on chart. Turnig points, trading ranges, support- resistance levels also. Change parameters in the trendscalp settings. TTF bars can be set: 8, or, 15, or 45, 150. Greather periods are very useful at strong support - resistance areas. IF ONE OF OUR FREE INDICATOR IS NICE TO YOU, FEEL FREE TO BUY AT LEAST OUR CHIEPST PRODUCT TO DONATE US. "Lots of small peace can be a mountain" ( nathan rothschild, john len
FREE

This Advanced Pivots Point is a MT5 Indicator and the essence of this technical indicator is to transform the accumulated history data. Pivot Point Indicator provides for an opportunity to detect various peculiarities and patterns in price dynamics which are invisible to the naked eye. Pivot Points Fibonacci retracements Previous day’s open, high, low, and close.
FREE
Zero Lag SMA for MT5 The Zero Lag SMA (ZLSMA) indicator for MT5 provides a variation of the Simple Moving Average (SMA) designed to minimize lag, offering traders a more responsive moving average that adjusts more quickly to price changes. This makes it useful for identifying potential trend reversals and key price levels in a timely manner. Key Features: Zero Lag Calculation : The core of this indicator uses a double smoothing technique to reduce lag, providing faster responses to price movemen
FREE

The outside bar indicator shows a range of inside bars and the breakout up and down from the range. The breakout is always displayed at the start of a new range and is extended until another breakout. The calculation always takes place at the start of a new candle. So it is displayed accordingly in all time frames. In inside bar ( insidebar ) trading you can see the top and bottom of a range.
In outside bar ( outsidebar ) trading, the breakout from a range and thus the trend following.
The c
FREE

This indicator shows current major support and resistance, if one exists. And as a support or resistance is broken it shows the new current, if any. To identify support and resistance points it uses the high and low points identified on the current chart. Allows too you to inform the maximum number of bars used to consider a support or resistance point still valid.
FREE

The Daily Highs and Lows Indicator is a versatile tool that combines support and resistance levels with real-time market dynamics. By incorporating previous daily highs and lows, it provides valuable insights into market psychology and identifies potential areas of price reversals or breakouts. With its ability to adapt to changing market conditions and customizable options, traders can stay ahead of trends and make informed decisions. This indicator is suitable for various trading styles and ti
FREE

RoundNumbers indicator is a simple and powerful psychological price levels. Trader usually use these levels as a Support and Resistance (SnR). Indicator Input: Levels - Numbers of levels drawn on chart. Default 30 levels. BoxSize - Box size drawn on each levels, indicate buffers around levels. Default value 1pips (10point) above and below each levels. ZoneSize - Distance between each levels, default value 10pips (100point). Style & Colours - User inputs customization. For MT4 version, p
FREE

Presentation
Another indicator that makes scalping on tick charts easier, it displays an Heiken Ashi graph in Ticks.
It allows to detect entry points and trend reversals. Recommended number of ticks in a candle : 5, 13 or 21.
Parameters Ticks in candle: Number of ticks in a candle (default 5), Displays Trend arrows : displays a trend arrow based on EMA8 and EMA20 crossing, Displays MM50, Displays MM100, Max Candle (CPU): number of candles max to manage, low value will save ressources of
FREE

There is a science, named Quantitative Finance, that allows to study the financial derivative pricing models using the methods of theoretical and mathematical physics.
Lately I came across a paper that describes a new indicator for technical analysis that combines ideas from quantum physics and brings them to finance. I got interested in it and decided I would teach how to implement indicators based on a scientific papers in MQL5.
The original Moving Mini-Max paper [2] is written by Z.K. Sila
FREE

The Spider ZIGZAG is an algorithm to determine how critical the current peak is by spreading several lines with different parameters instead of one line between each 2 peaks. 1. The more zigzag's lines meet at a peak the higher probability the market will go for correction or change direction. 2. Usually when 3-4 zigzag's lines meet at a peak, the market enters a correction period, this don't happen instantly, it might take some time. 3. Usually when 5-6 zigzag's lines meet at a peak, th
FREE

MomoPoints 是一个在图表上显示多头和空头入场点/加仓点的指标。
根据势头和趋势强度,MomoPoints 显示具有良好风险回报率的条目/添加。
设置
----------------------------------
设计:信号的颜色、大小和翼形(图形符号)可以调整。
信号设置:可以设置移动平均线周期、趋势强度、移动平均线到价格的距离以及RSI周期。
信号值可以显示为注释,以便为资产设置正确的值。该指标还可以适合每个交易对或资产。
每个资产都需要自己的设置来显示好的条目。如果您需要特定配对的设置并且您无法自行找到它,我可以帮助您。
警报:可以激活推送通知和声音语音警报。
信号实时发生,无需重新绘制
如果您有任何疑问或需要其他信息或功能,我可以随时与您联系。
FREE

Finally a Metatrader version of the very popular (and expensive) Market Cipher B indicator, or the Vumanchu Cipher B + Divergences very popular on Tradingview platform.
This tool is very heavy on calculations, total are 31 plots using 97 buffers from several indicators. On my mid end computer, timeframes below M15 start getting a bit laggy, so it would require a powerful computer to run it properly at very low timeframes. It's still usable here, but somewhat sluggish response in Metatrader (l
FREE

The indicator IQuantum shows trading signals for 10 symbols in the daily chart: AUDCAD, AUDUSD, EURUSD, GBPCAD, GBPCHF, GBPUSD, NZDUSD, USDCAD, USDCHF, and USDJPY.
Signals of the indicator are produced by 2 neural models which were trained independently from one another. The inputs for the neural models are normalised prices of the symbols, as well as prices of Gold, Silver and markers of the current day.
Each neural model was trained in 2 ways. The Ultimate mode is an overfitted neural mo
FREE

Probability emerges to record higher prices when MACD breaks out oscillator historical resistance level. It's strongly encouraged to confirm price breakout with oscillator breakout since they have comparable effects to price breaking support and resistance levels; surely, short trades will have the same perception. As advantage, many times oscillator breakout precedes price breakout as early alert to upcoming event as illustrated by 2nd & 3rd screenshot. Furthermore, divergence is confirmed
FREE

Key Price Levels Indicator Indicator that shows the highs and lows for the significant price levels for past periods that could be potentially considered as reaction levels. The indicator displays the following price levels: Yesterday high and low The day before yesterday high and low Two days back high and low Last week high and low Last month high and low Last three month high and low (Quarter) Last year high and low
FREE

You may find this indicator helpfull if you are following a session based strategy. The bars are colored according to the sessions. Everything is customisable.
Settings: + Asia Session: zime, color, high, low + London Session: zime, color, high, low + US Session: zime, color, high, low
Please feel free to comment if you wish a feature and/or give a review. Thanks.
FREE

Very simple, yet powerful, indicator that helps you get notified every time a candle touches your trend line, horizontal line, and/or your rectangular. Powerful indicator yet very simple to use! All you need to do is draw your MT5 trend lines, horizontal lines, and/or rectangles and SmartLine takes care of notifying you the moment the current price touches one of your key levels! No brainer If you like the indicator, please leave a review and share the tool with your peers. WARNING: Please use t
FREE

The Pipsurfer Strategy indicator is designed to help traders identify trend-based trades by leveraging momentum confirmations within the market structure. It works by detecting key pullbacks and providing entry signals after a confirmed market retracement , ensuring you only enter trades with the highest probability of success. Perfect for traders looking to capitalize on trending markets, this tool simplifies your decision-making process and helps you stay on the right side of the trend. Whethe
FREE

Bollinger bands out/in strategy A strategy created by Joe Ross, and very useful for finding trades when the market is overloaded. Indicator You don't need to find where there are entries on the chart, this indicator shows them for you. The entrance The trade is confirmed when the price closes outside the bollinger bands on a candle and the candle after the price closes inside the bands. comment I want to improve this indicator, so you can help me sending me your reviews and comments, thanks :).
FREE

Pivot Point Supertrend (corresponds to Pivot Point Super Trend indicator from Trading View) Pivot Point Period: Pivot point defined as highest high and highest low... input 2 = defining highest high and highest low with 2 bars on each side which are lower (for highest high) and are higher (for lowest low calculation) ATR Length : the ATR calculation is based on 10 periods ATR Factor: ATR multiplied by 3
FREE

Imagine VWAP, MVWAP and MIDAS in one place... Well, you found it! Now you can track the movement of Big Players in various ways, as they in general pursue the benchmarks related to this measuring, gauging if they had good execution or poor execution on their orders. Traders and analysts use the VWAP to eliminate the noise that occurs throughout the day, so they can measure what prices buyers and sellers are really trading. VWAP gives traders insight into how a stock trades for that day and deter
FREE

This comprehensive technical indicator calculates and plots up to 3 moving averages with 3 different periods. By employing three moving averages of distinct lookback periods, the trader can confirm whether the market has indeed experienced a change in trend or whether it is merely pausing momentarily before resuming its prior state. SX Golden MA Pack for MT4 is available here . The shorter the moving average period, the more closely it tracks the price curve. When a security initiates an upt
FREE

Clock GMT Live 拥有您需要了解的有关我们经纪人的所有信息,很多时候您会想知道我现在的格林威治标准时间或我的经纪人正在处理什么格林威治标准时间,使用此工具您将能够实时了解格林威治标准时间和格林威治标准时间 经纪人和你当地时间的时间偏移,你也会不断地知道经纪人的 ping 只需将它放在一天中的某个时间,您就可以获得信息
每次收购价格都会上涨,我们将以此来保护,这样很少有人可以拥有我独特的策略 我的其他开发可以在这里查看
准确的时机可能是交易中的一个关键因素。 目前,伦敦或纽约证券交易所是否已经开市或仍处于关闭状态? 外汇交易的营业时间何时开始和结束? 对于手动交易和实时交易的交易者来说,这不是什么大问题。 使用各种互联网工具、金融工具的规格和时间本身,您可以快速了解何时是根据自己的策略进行交易的正确时间。 对于一些只关注价格走势并在价格走势向他们发出信号时进行买卖的交易者而言,时间本身并不重要。 对于在纽约(股票)市场收盘后和欧盟(股票)市场开盘前进行“夜间剥头皮”交易的交易者,或者专门在“伦敦休市”或其他时间进行交易的交易者而言,情况有所不同 最忙的时候,还是所有
FREE
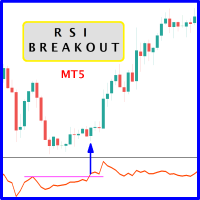
The likelihood of farther price movement increases when Relative Strength Index oscillator "RSI" breaks through its historical resistance levels in conjunction with prices breakout of resistance levels. It's strongly encouraged to confirm price breakout with oscillator breakout since they have comparable effects to price breaking support and resistance levels; similar perception is applied to short trades. Concept is based on find swing levels which based on number of bars by each side to confir
FREE

Defining Range ( DR ) and Implied Defining Range ( IDR ) indicator
New Pro version here :
https://www.mql5.com/en/market/product/91851?source=Site+Profile+Seller
Show DR and IDR ranges on the chart for Regular , Overnight and After Sessions
for more information how DR and IDR work and the high probability watch : https://www.youtube.com/@themas7er or https://twitter.com/IamMas7er
Remember to set set your chart TimeZone when you attach indicator to the chart under indicator set
FREE

速度略有变化。 测试人员需要一个新的顾问,谁有兴趣,写信给我通过电子邮件777basil@mail.ru
该指标基于历史价格变化计算,并以数学方式计算,每次再次接收数据时重新计算。 它可以在不同的时间框架上使用。 从70%的指标边界来看,价格运动或整合方向发生变化。 通过这种方式,您可以在趋势和通道中间从其边界进行交易。 最好在趋势交易中使用它来确定阻力位/支撑位。 在视频中,您可以看到指标是如何工作的: https://youtu.be/UG2ZZEH9B_U 通讯联系人 777basil@mail.ru 我们将为您的任务准备一个专家,一个指标。
该指标基于历史价格变化计算,并以数学方式计算,每次再次接收数据时重新计算。 它可以在不同的时间框架上使用。 从70%的指标边界来看,价格运动或整合方向发生变化。 通过这种方式,您可以在趋势和通道中间从其边界进行交易。 最好在趋势交易中使用它来确定阻力位/支撑位。 在视频中,您可以看到指标是如何工作的: https://youtu.be/0hRltsRNmPE
FREE

Excellent tracking performance and minimal noise! This trend detection indicator that avoids whipsaws and uncertain market noise and is also agile enough to react to changes in trend.
It is also designed to adapt to dynamic markets.
Functions mainly as a filter to help you trade in the direction of the trend.
Features.
Simple and easy to use. Low load and easy to try out The excellent tracking performance and smooth lines that make it ideal for market analysis Can be used as a trend filter
FREE

The Indicator show Daily Pivot Points. It is possible to specify the number of days to display. For forex it doesn't consider the sunday session data. It is possibile to modify the color, style and width for every level. It is better to use this indicator with timeframe not higher than Н1. 4 Levels of support and resistance with also Intermediate Levels that is possible to hide.
FREE

This auxiliary indicator displays time left before closing on the current timeframe with continuous update . It also shows the last trade price and variation from a previous day close in percentage and points. This indicator is pretty handy for daytraders and scalpers who want to precisely monitor closing and opening of candles.
Indicator parameters Show in shifted end - Default: False. Display time and values on screen. If True, Displays only time to close aside last candle. Distance from the
FREE
MetaTrader 5 免费点差指标 该指标提供了对MetaTrader 5上点差的详细分析,点差是交易者最重要的参数之一,因为它代表了资产的买价(Ask)和卖价(Bid)之间的差额。 该指标包括: 平均点差 :计算为当天观察到的最高点差和最低点差之间的平均值。 当前点差 :显示当前的市场点差。 最低点差 :显示当天达到的最低点差值。 最大点差 :显示当天达到的最大点差值。 该指标旨在提供对市场状况的清晰而即时的视图,帮助交易者更好地评估交易成本并识别任何可能影响其策略的点差变化。 如果您对我的产品感兴趣,建议您访问我的页面,您可以在那里找到: 专家顾问 : https://www.mql5.com/it/market/product/119456?source=Site+Profile 指标 : https://www.mql5.com/it/market/product/121443?source=Site+Market+MT5+Search+Rating006%3amarket+profile 希望点差指标对您有用。 您可以访问我的个人资料: https://www.mql5.
FREE

A useful dashboard that shows the RSI values for multiple symbols and Time-frames. It can be easily hidden/displayed with a simple click on the X top left of the dashboard. You can input upper and lower RSI values and the colours can be set to show when above/below these values. The default values are 70 and 30. You can choose whether the dashboard is displayed on the right or left of the chart. If you want to have 2 dashboards on the same chart you must input a different name for each. The sca
FREE

Minimalist style BB indicator fully filled with a single color. Indicator type: Technical Indicator You are too confused with the complicated zigzag lines in the BB indicator, especially when your strategy has many indicators combined, it looks like a mess and we will no longer see any candlesticks on the chart for technical analysis s. This indicator was born to solve that. See more: New tradingview indicator: Order Block TV | Minimalist Price Action Strategy | Subscribe It is designed
FREE

Alert Indicator for exponential moving average cross blue arrow for buy alert , fast ema 14 crosses above 50 pink arrow for sell alert , fast ema 14 crosses below 50 Default 14 ema fast & 50 ema slow add these indicators to chart Full Alerts , push, email, phone inputs for moving average lengths and alarm on off settings Please contact for help of an indicator alert suggestion
FREE

The indicator synchronizes eight types of markings on several charts of one trading instrument.
This indicator is convenient to use in conjunction with "Multichart Dashboard" or other similar assistant that allows you to work with several charts at the same time.
"Multichart Dashboard" can be found under the link on my youtube channel.
Settings:
enable vertical line synchronization
enable horizontal line synchronization
enable Trend Line synchronization
enabling Fibonacci Retracement
FREE

介紹 旨在解決以下問題的投資城堡指標創建:
1.在不同的時間範圍內確定趨勢的正確方向。
2.在圖表上顯示命中率,獲勝率。
3.該指標不會重新繪製圖表。
4.該指標內置在 Investment Castle EA 中。
*在網站上查看設置的文件,更新和更多信息: https://www.investmentcastle.com
免責聲明 應該清楚地將“ Investment Castle Indicator”和所有帶有其名稱的產品視為交易者可以用來支持其交易的工具。牢記這一點,該工具的效果或有效性完全取決於交易者的投入和/或優化。
強烈建議您,作為交易者,首先要完全熟悉投資城堡指標產品,首先要對模擬或試用帳戶中各種參數的輸入設置進行全面回測,然後再使用投資城堡指標。一個真實賬戶,以便體驗和理解每個參數集如何相互對應,以使投資城堡指標如交易員所設定的那樣起作用。
因此,無論是好是壞,交易者交易經驗的結果,都只是對交易者理解的純粹而直接的反映,並且具有優化和利用投資城堡指標所提供的廣泛功能的能力。
FREE

该指标每天显示当前情况的趋势和目标。 由于正确确定市场条件,该指标还减少了亏损交易的数量。 专为分析和日内交易而设计。
如何使用:
蓝线显示当天的开盘价,其中 4 条线根据特殊公式设置,确定当天的目标。 您可以按照趋势的方向搜索和打开交易。
灰线是第一个目标。 当价格达到这些水平时,最好关闭部分头寸并保护您的交易。 此外,在这些价格区域中,您可以小心地根据趋势进行交易。
黄线是今天的最终目标。 当价格接近这个水平时,值得关闭大部分交易量并保护交易,或者完全关闭趋势交易。 不建议在这些区域跟随趋势。
黄线可以突破很远,很少但会发生。 这是奖金收入。
当一天内达到蓝线区域的价格时,上述的一切都可以重复。
开始交易时,请查看左上角的指标建议。 不要针对指标进行交易!
FREE
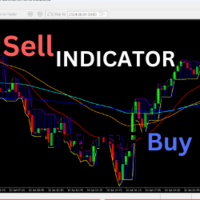
Welcome to a highly versatile and customizable trading indicator designed to elevate your trading strategy. This indicator integrates four moving averages (MAs) and order blocks, providing you with a powerful tool for market analysis and decision-making. Key Features: Four Moving Averages (MAs): This indicator allows you to utilize up to four different moving averages simultaneously. You can adjust each MA's period, color, and style to tailor the indicator to your specific trading needs. Whether
FREE

Signal provider based on RSI Divergences
from a higher timeframe.
First 3 buffers export a signal.
Timeframe for which divergences are detected is optional, see
'RSI divergences timeframe' parameter.
The indicator uses different algorithms for divergences detection:
'Fast' algorithm is the simplest solution that works the fastest.
'Strict' algorithm filters out more noise but works slower than the previous one.
'Full' algorithm uses recursive functions and provides with lots of d
FREE

One of the good and important features in MT4 is the availability of the iExposure indicator. With the iExposure indicator, traders can see a comparison of ongoing open positions and how much funds have been used, and more importantly what is the average value of these open positions.
Unfortunately this indicator is not available on MT5.
This indicator is iExposure MT4 which I rewrote using the MT5 programming language. This indicator can be used like iExposure on MT4 with the same function
FREE

TransitTrendlines this is a automatically trendline drawer, it draw both horizontal and diagonal trendlines. The horizontal trendlines are the pivot points of the day timeframe and the diagonal trendlines are based on the current time frames. You can adjust the diagonal trendlines by increasing the number of bars to draw the diagonal trendline and can also adjust the steepness. Note that the Horizontal trendlines are based on the day pivot points not currant time frame. Join mql5 transitbk98 cha
FREE

A heatmap is a graphical representation of data in two dimensions, using colors to display different factors. Heatmaps are a helpful visual aid for viewers, enabling the quick dissemination of statistical or data-driven information. The MP Heatmap indicator provides a graphical representation of the relative strengths of major currencies compared to others, organizing data from pairs into color-coded results and producing a clear overview of the entire Forex market. The MP Heatmap indicator dis
FREE

"Spotting emerging trends, defining correction periods, and anticipating reversals can benefit your trading in many ways..." So be it: Higher Highs & Lower Lows indicator. This is an indicator created by Vitali Apirine and presented to the public through the article "Time To Buy. Time to Sell - It's a Stochastic, Higher Highs & Lower Lows" in the Stocks & Commodities magazine . This is a Momentum indicator that helps determine the direction of a trend. Higher Highs and Lower Lows are two indicat
FREE

If you like to use traditional Moving Averages (like SMAs and EMAs) to provide your trades for dynamic levels of Support and Resistance, you will love the Adaptive Moving Average (AMA). Created in 1995 by Perry Kaufman and presented to the world in his book " Smarter Trading : Improving Performance in Changing Markets ", the Adaptive Moving Average (also known as KAMA - Kaufman Adaptive Moving Average) has the goal to be the perfect companion for following a trend without noise, but s
FREE

考拉趋势线升级到1.2版
上一次升级改进:添加了新参数,允许用户将趋势线连接到第二或第三或第X最高或最低点。
我的请求 :
**尊敬的客户,请在Koala趋势线上发布您的评论,让我通过您的反馈进行改进。
为什么科拉趋势线是免费指示器?
我相信免费指标必须是合格的工具。
关于其他免费产品呢?
所有带有绿色考拉徽标的产品都是我的免费产品
https://www.mql5.com/zh-CN/users/ashkan.nikrou/seller#products
考拉趋势线介绍:
我做了这个指标来帮助交易者更好地找到趋势,该指标可以显示当前趋势线。
如您所知,趋势线必须在2个最高点或最低点之间绘制。
因此,主要逻辑是找到最高和最低点。
指标查找历史上所有最高和最低点,并用红色和蓝色点显示它们。
这些最高和最低点是根据深度值计算的。深度值可调,用户可以更改。
深度是什么意思?
当深度为10时,表示每个最高蜡烛必须在其周围的10支蜡烛之间最高,必须在前5个蜡烛与下一个5个蜡烛之间为最高蜡烛。
当深度为10时,
FREE

Gold TL MTF - this is a fine stock technical indicator. The indicator algorithm analyzes the movement of the asset price and reflects trend lines along the fractals of a specific timeframe (TF).
Benefits of the indicator: The indicator produces signals with high accuracy. The confirmed signal of the indicator does not disappear and is not redrawn. You can trade on the MetaTrader 5 trading platform of any broker. You can trade any assets (currencies, metals, cryptocurrencies, stocks, indices
FREE

En esta versión, las alertas están funcionando y en la versión que publicó, la zona muerta de atr era solo una zona muerta sin atr, por lo que también la convirtió en una zona muerta de atr.
Indicator input parameters input int Fast_MA = 20; // Period of the fast MACD moving average input int Slow_MA = 40; // Period of the slow MACD moving average input int BBPeriod=20; // Bollinger period input double BBDeviation=2.0; // Number of Bollinger deviations input int Sensetiv
FREE

Hull Moving Average is more sensitive to the current price activity than a traditional Moving Average. It faster responds to trend change and more shows the price movement more accurately. This is a color version of the indicator. This indicator has been developed based in the original version created by Sergey <wizardserg@mail.ru>. Suitable for all timeframes.
Parameters Period - smoothing period, recommended values are 9 to 64. The larger the period, the softer the light. Method - smoothing
FREE

CustomRSI50 - レベル50を備えたカスタムRSIインジケーター 説明 CustomRSI50は、人気のある相対力指数(RSI)に基づいたカスタム技術指標です。このインジケーターは、特にレベル50に重点を置いたRSIの明確でカスタマイズ可能な視覚化を提供し、多くのトレーダーにとってモメンタム分析に不可欠です。 主な特徴 設定可能なRSI期間 強調表示された50レベルの参照 カスタマイズ可能な適用価格タイプ 別ウィンドウでの表示 解釈しやすい0から100までの固定スケール カスタマイズ可能なパラメーター RSI_Period: RSI計算の期間を設定可能(デフォルト:14) applied_price: 計算に使用する価格タイプを選択可能(デフォルト:終値) CustomRSI50の使用方法 MetaTrader 5の任意のチャートにインジケーターを適用 好みに応じてRSI期間と価格タイプをカスタマイズ 50レベルに関連するRSIの動きを観察: 50を上回る値は強気のモメンタムを示す 50を下回る値は弱気のモメンタムを示す 利点 市場のモメンタムの明確な視覚化 レベル50周辺
FREE
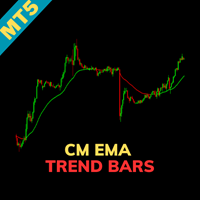
Indicator Name: CM EMA Trend Bars Overview: The CM EMA Trend Bars indicator is a straightforward yet effective tool that changes the color of price bars based on their relationship to the Exponential Moving Average (EMA). This visual cue helps traders quickly identify trend direction and potential trading opportunities. Key Features: Dynamic Bar Coloring: The indicator changes the color of the bars depending on whether they are above or below the EMA, providing a clear visual representation of t
FREE

The Market Momentum indicator is based on the Volume Zone Oscillator (VZO), presented by Waleed Aly Khalil in the 2009 edition of the International Federation of Technical Analysts journal, and presents a fresh view of this market valuable data that is oftenly misunderstood and neglected: VOLUME. With this new approach of "seeing" Volume data, traders can infer more properly market behavior and increase their odds in a winning trade.
"The VZO is a leading volume oscillator; its basic usefulnes
FREE

不同的经纪人和不同类型的账户可以具有不同的点差值(买入价和卖出价之间的差异),这已经不是什么秘密了。 在这种情况下,同一个专家顾问将以完全不同的结果进行交易。 符号的点差越大,您获得的利润就越少,经纪人从您那里获得的利润就越多。 因此,测量点差对于选择经纪人和账户类型非常重要,特别是对于剥头皮,午夜和盘中策略。
一个简单但可靠的指标从无限将帮助您跟踪任何符号的传播在任何经纪人!
只需在任何图表上安装散点计指示器(建议使用 M1-H1)。 传播米跟踪并记住最大的最小和平均传播变化.
图表底部的散点计指标直方图实时累积历史记录。 因此,经常使用指标很重要。 建议使用VPS或具有永久互联网连接的计算机。
散射仪指示器的参数:
Low/high level -高点差和低点差之间的范围
Save spread data -参数,用于在指示器内存中保存spread data
(抱歉文本的自动翻译)
FREE

该指标在图表上显示圆形水平。 它们也被称为心理、银行或主要参与者级别。 在这些水平上,多头和空头之间存在真正的斗争,许多订单的积累导致波动性增加。 该指标会自动调整到任何工具和时间范围。 当80水平被突破然后测试时,我们买入。当20级被突破然后测试时,我们卖出。目标是00。 注意力。由于强大的支撑 。 和阻力位,价格可能略低于 00 水平。
输入参数 。
Bars Count - 线条长度(以条为单位) 。 Show 00 Levels - 显示或不显示 00 级 。 Show 10, 90 Levels 。 Show 20, 80 Levels 。 Show 30, 70 Levels 。 Show 40, 60 Levels 。 Show 50 Levels 。 N Lines - 限制图表上级别数的参数 。 Distance 00 Levels - 层间距离(自动或手动) 。 Line Position - 图形前面或后面的线 。
Visual Button - 按钮显示(启用/禁用) 。 Corner - 按钮锚定角度 。 X indent - 以像素为单位的水平
FREE

The HammerStar indicator is designed to search for the Hammer and Shooting Star patterns on charts of any currency pairs.
Hammer Downward trend.
The lower shadow is not less than 2 and no more than 3 times larger than the body.
There is no upper shadow, or it is very short (no more than 10% of the candlestick range).
The color of the body in the long game is not important, with the short - white hammer is much stronger than the black one.
Confirmation is suggested.
Shooting Star Uptrend.
FREE

Do you want to see the most relevant supports and resistances at a glance? Tired of tracing the levels by hand? Multi Levels Detector is an indicator for MetaTrader that will draw supports and resistances according to the parameters entered, and also offers the possibility of executing an alert every time the price reaches any of its levels.
SETTINGS UsePercentage: Allows you to configure whether the distances between levels will be measured in points, or by a percentage of the asset.
TimeFr
FREE

The ATR Exit indicator uses the candle close + ATR value to draw trailing stop lines (orange under buys, magenta over sells) that advance with the trend until the trend changes direction. It uses a multiple of the Average True Range (ATR), subtracting it’s value from the close on buy, adding its value to the close on sell. Moreover, the trailing stop lines are generated to support the order’s trend direction (long or short): In an upward trend, the long trailing stop line (orange line under bu
FREE

The SMTrendLine indicator is based on the principles of graphical construction of Bollinger bands.
Graphically, the Bollinger is two lines that limit the price dynamics from above and from below, respectively. These are a kind of support and resistance lines, which most of the time are located at levels far from the price.
As we know, the Bollinger bands are similar to the envelopes of moving averages. The difference between them is that the envelope boundaries are located above and below t
FREE
您知道为什么MetaTrader市场是出售交易策略和技术指标的最佳场所吗?不需要广告或软件保护,没有支付的麻烦。一切都在MetaTrader市场提供。
您错过了交易机会:
- 免费交易应用程序
- 8,000+信号可供复制
- 探索金融市场的经济新闻
注册
登录