KT RSI Power Zones MT4
- Göstergeler
- Sürüm: 1.0
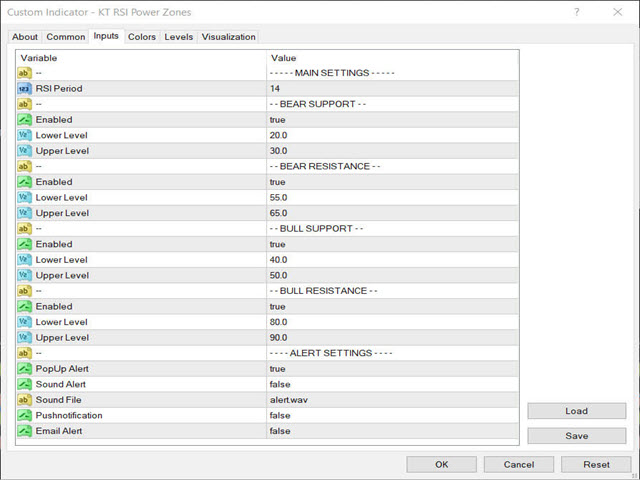
- Etkinleştirmeler: 5

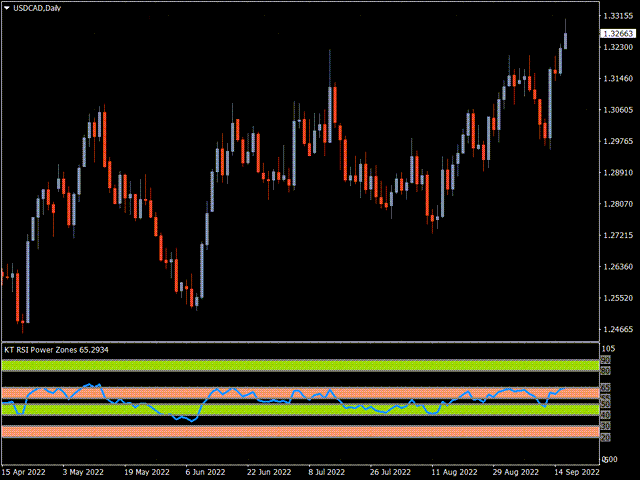
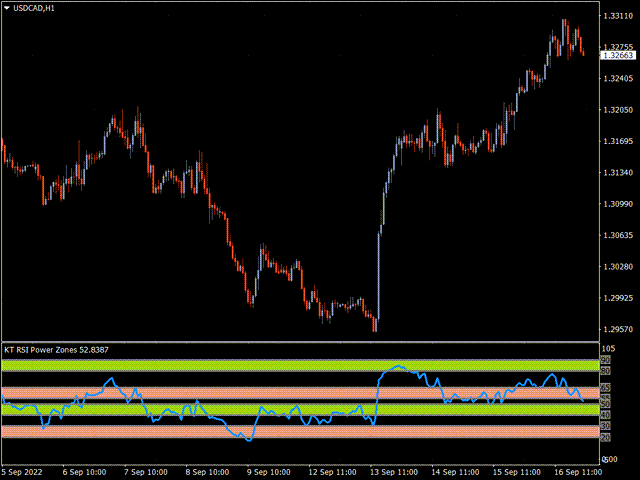
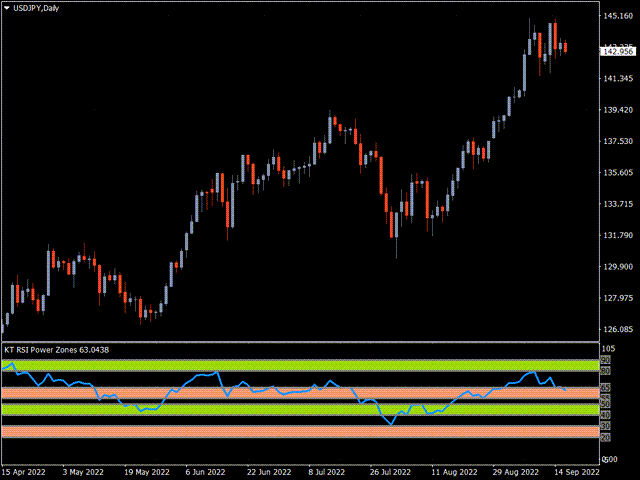
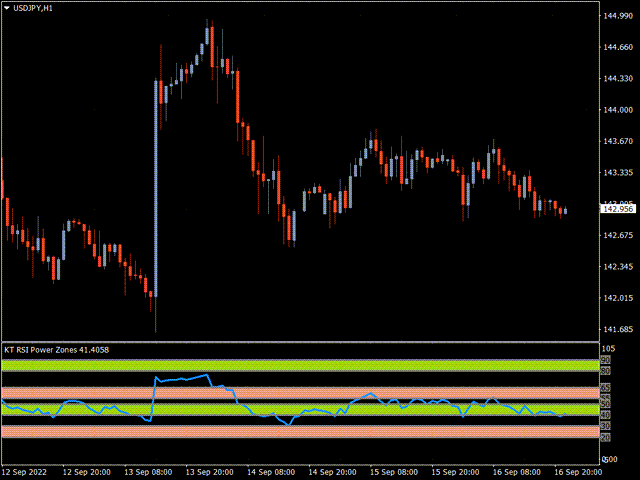
Boğa Destek Bölgesi
Boğa Direnç Bölgesi
Ayı Destek Bölgesi
Ayı Direnç Bölgesi
Ayı direnç bölgesi 55 ila 65 aralığındadır. Fiyatın bu bölgeden aşağı yönde dönmesi beklenir.
RSI Güç Bölgeleri Nasıl Kullanılır
RSI (Göreceli Güç Endeksi), aşırı alım-aşırı satım seviyeleri, pozitif-negatif uyumsuzluklar, başarısız salınımlar ve benzeri durumları tespit edebilen çok yönlü bir osilatördür.
Genel olarak RSI'da aşırı alım durumu bir dönüş sinyali olabilir, ancak aynı zamanda güçlü bir trendin devamını da gösterebilir. Tersi de geçerlidir.
RSI Güç Bölgeleri, destek ve direnç gibi diğer göstergelerle birlikte kullanıldığında daha sağlam ve onaylı işlem sinyalleri üretir.
Göreceli Güç Endeksi (RSI) Nedir?
RSI, teknik analizde kullanılan bir momentum osilatörüdür. Son fiyat hareketlerinin hızını ve büyüklüğünü ölçerek bir varlığın aşırı değerli mi yoksa düşük değerli mi olduğunu belirlemeye çalışır.
RSI sadece aşırı alım veya aşırı satım durumlarını değil, aynı zamanda trend dönüşü veya fiyat düzeltmesi ihtimallerini de gösterebilir.
Alım ve satım kararları için rehber olabilir. Tarihsel olarak, RSI'nın 70 veya üzeri olması aşırı alım, 30 veya altı olması aşırı satım olarak kabul edilir.