KT RSI Power Zones MT4
- Indicatori
-
KEENBASE SOFTWARE SOLUTIONS
 Keenbase Trading sviluppa indicatori professionali ed Expert Advisor per MetaTrader 4 e MetaTrader 5, progettati per aiutare i trader a prendere decisioni di trading più consapevoli.
 - Versione: 1.0
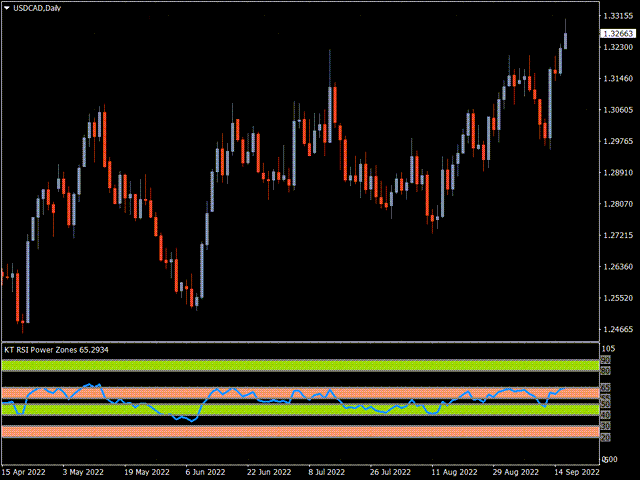
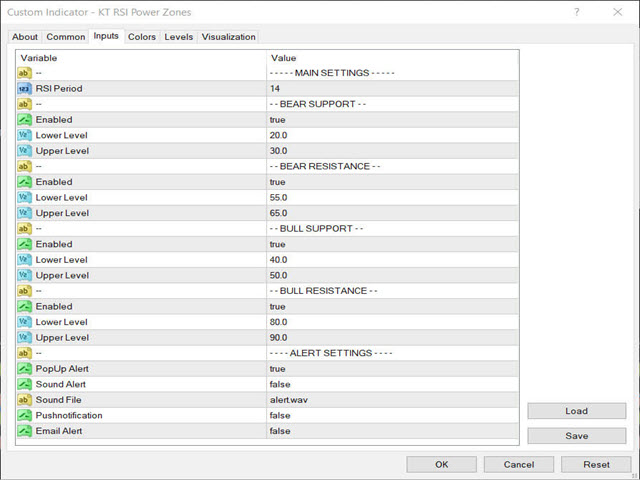
Supporto rialzista
Resistenza rialzista
Supporto ribassista
Resistenza ribassista
La resistenza ribassista va da 55 a 65. Da questa zona ci si aspetta un’inversione al ribasso del prezzo.
Come usare le Power Zones RSI
L’indice di forza relativa (RSI) è un oscillatore versatile che può identificare livelli di ipercomprato e ipervenduto, divergenze positive e negative, swing falliti e altro ancora.
In generale, una situazione di ipercomprato nell’RSI indica un’inversione imminente, ma può anche suggerire forza — e viceversa.
Le RSI Power Zones dovrebbero essere usate insieme ad altri indicatori, come supporti e resistenze, per generare segnali di trading più solidi e confermati.
Comprendere l’RSI (Relative Strength Index)
L’RSI è un oscillatore di momentum utilizzato nell’analisi tecnica. Calcola se un’attività è sopravvalutata o sottovalutata misurando la velocità e l’entità dei recenti movimenti di prezzo.
L’RSI può fare più che identificare titoli ipercomprati o ipervenduti. Può anche individuare possibili inversioni di tendenza o correzioni di prezzo.
Aiuta a decidere quando comprare o vendere. Un valore RSI pari o superiore a 70 indica storicamente ipercomprato, mentre un valore pari o inferiore a 30 indica ipervenduto.