KT Psar Arrows MT5
- Göstergeler
- Sürüm: 2.1
- Güncellendi: 25 Mart 2022
- Etkinleştirmeler: 10

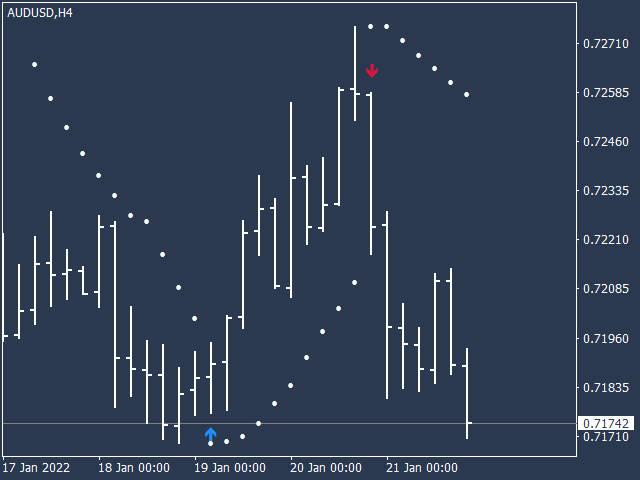
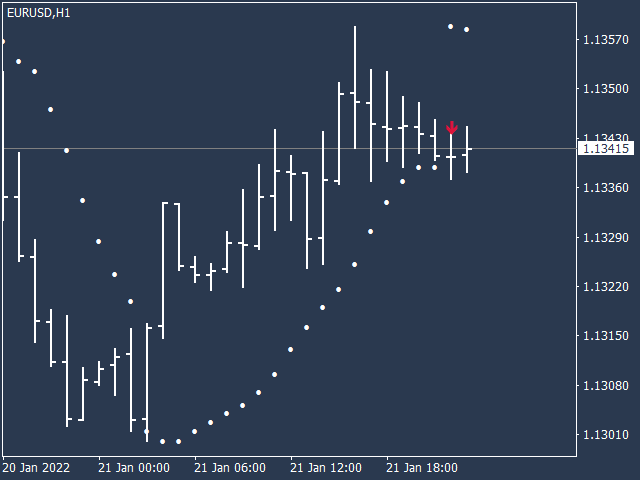
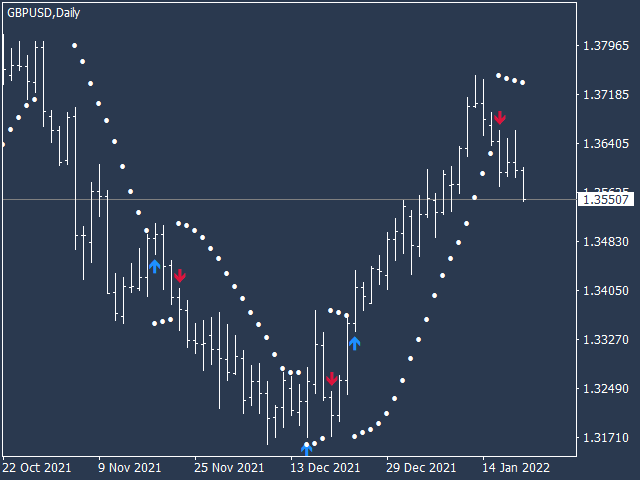
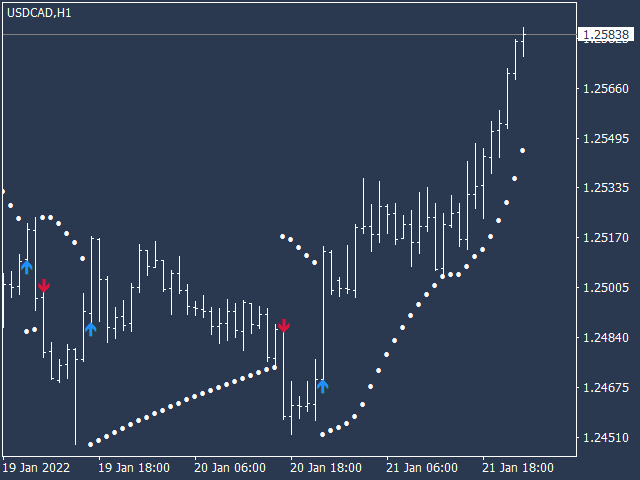
KT Psar Arrows, standart Parabolic SAR göstergesini kullanarak grafikte oklar çizer. Mumun en yüksek noktası SAR'a temas ettiğinde yükseliş oku çizilir. Mumun en düşük noktası SAR'a temas ettiğinde düşüş oku çizilir. Sinyaller, mum kapanışını beklemeden gerçek zamanlı olarak üretilir.
Özellikler
- Parabolic SAR göstergesini kullanan ticaret stratejilerini denemek isteyen yatırımcılar için faydalı bir araçtır.
- Piyasadaki dönüş noktalarını bulmak için kullanılabilir.
- Özel PSAR girişlerini destekler.
- Tüm MT4 uyarı türleri mevcuttur.
Uyarı: Parabolic SAR gecikmeli ve katı mekanik bir göstergedir. Her olası işlem, iyi tanımlanmış kurallar ile filtrelenmelidir.
Girdi Parametreleri
- PSAR Adım Değeri: Adım değerini girin.
- PSAR Maksimum: Maksimum değeri girin.
- PSAR Noktalarını Göster: PSAR noktalarını göster/gizle. PSAR noktaları gizli olsa bile oklar normal şekilde çalışacaktır.
- Geri kalan girişler açıklayıcı niteliktedir.


This is my second KT indicator purchase, and its a good'un. I tried coding an indicator that alerts when the Parabolic SAR switches, for better timed entries. It crashed my MT5, so I bought this. Very easy to use, does exactly what you would want / expect. I wish I could change the colour of the dots and position of the arrow, but generally is great. Thx, would recommend.