Flat finder MT4
- Göstergeler
- Sürüm: 1.0
- Etkinleştirmeler: 5

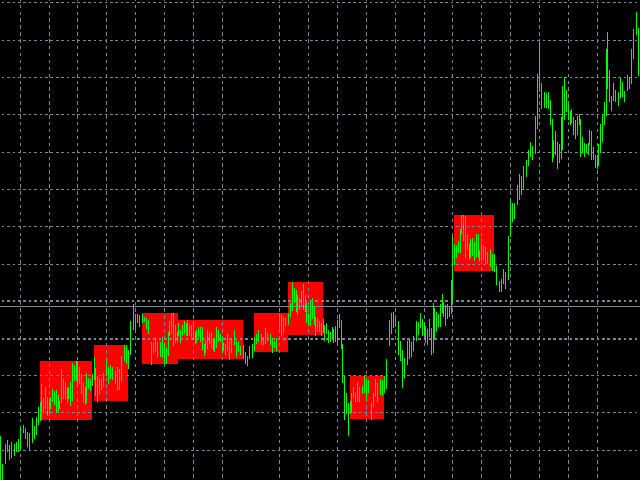
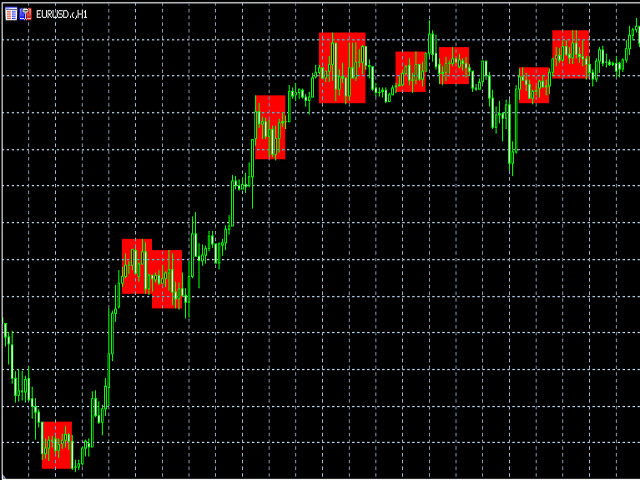
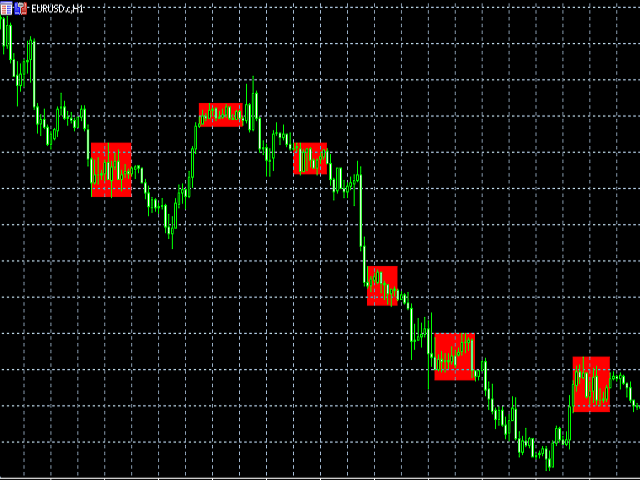
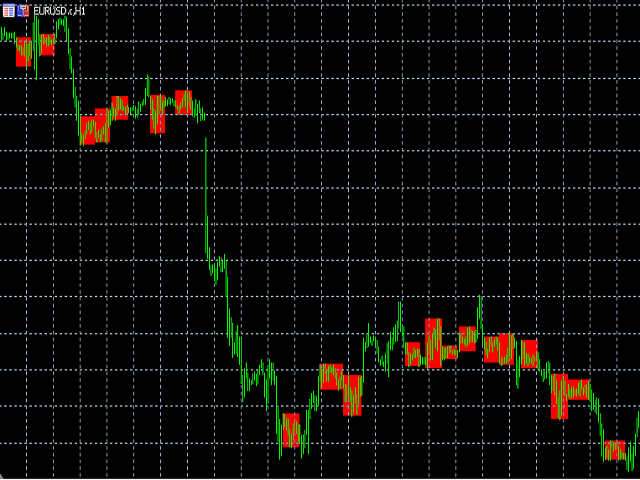
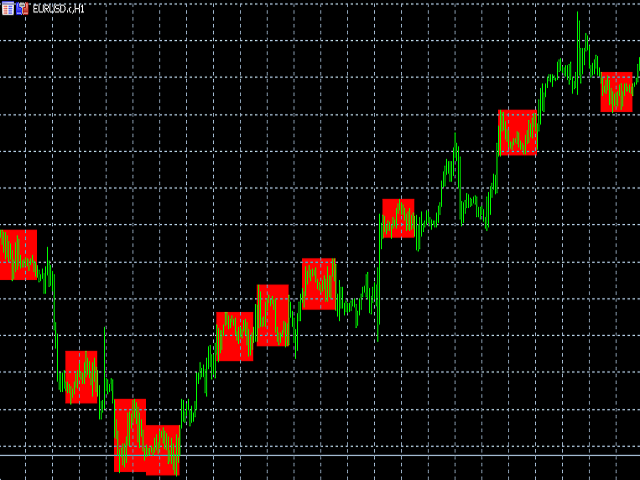
Bu gösterge bir daire algılar ve bulunan alanı renkli bir dikdörtgenle boyar.
Bu göstergenin ana fikri, fiyat grafikteki belirli bir alanı doldururken bir daireyi tespit etmektir.
Giriş parametreleri:
Color rectangle - gölgelenecek dikdörtgenin rengi.
Bars in rectangle - bir dikdörtgende izin verilen minimum çubuk sayısı.
Density in % - dikdörtgen alanının yüzdesi olarak ayarlanan dairenin yoğunluğu.