RSI Global
- Göstergeler
- Sürüm: 1.23
- Güncellendi: 18 Temmuz 2024
- Etkinleştirmeler: 7

Description
A universal indicator RSI together with moving averages based on it. Depending on the need, moving averages can be disabled.
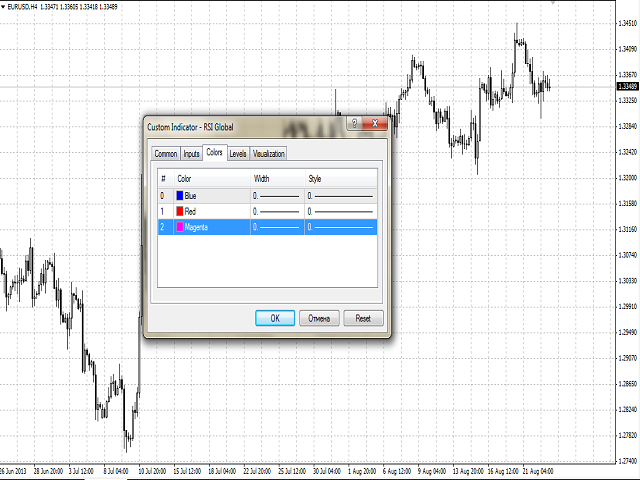
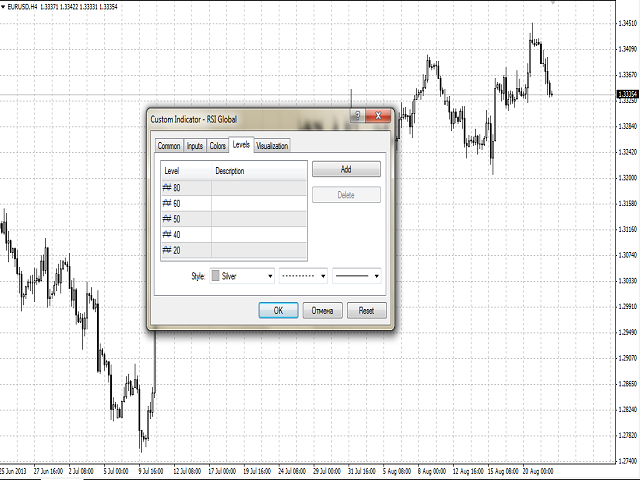
You can color the indicator lines and levels: lines of RSI, moving average lines and thresholds of overbought and oversold levels.
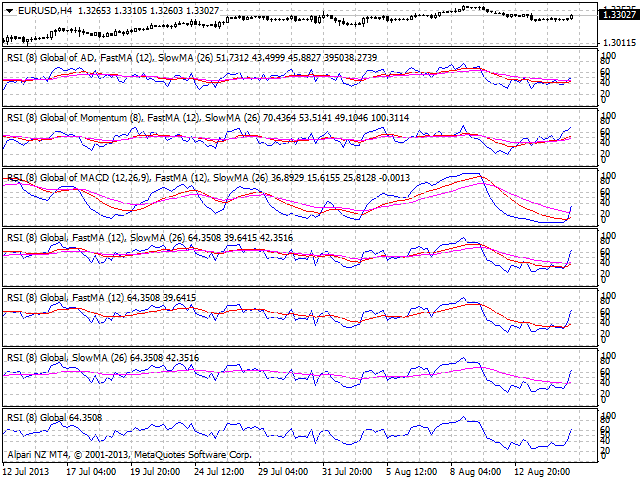
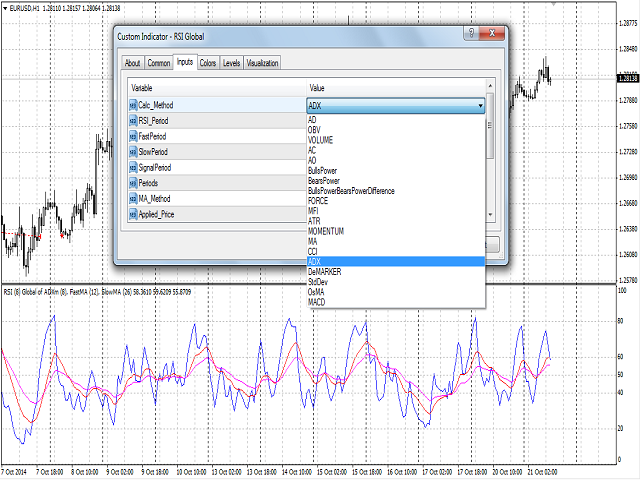
The indicator can be calculated as the standard one on the basis of a price or as a derivative on the basis of the following eighteen other indicators included in the standard package of the MT4 terminal:
- AD - an indicator of accumulation and distribution of volume.
- OBV - On Balance Volume.
- Volume - tick volume indicator.
- AC - indicator of acceleration.
- AO - Williams' oscillator.
- BullsPower.
- BearsPower.
- (BullsPower - BearsPower) - the difference of the bulls power and bears power.
- Force - Force Index indicator.
- MFI - Money Flow Index.
- ATR - Average True Range.
- Momentum.
- Moving Average.
- CCI - Commodity Channel Index.
- ADX - Average Directional Movement indicator.
- DeMarker.
- Standard Deviation.
- OsMA - moving average of oscillator.
- MACD - moving average convergence/divergence.
Price is used by default.
Use
The indicator can be used for manual or automated trading in an Expert Advisor. Values of indicator buffers of the double type can be used for automated trading:
- The RSI line - buffer 0.
- Fast MA line - buffer 1.
- Slow MA line - buffer 2.
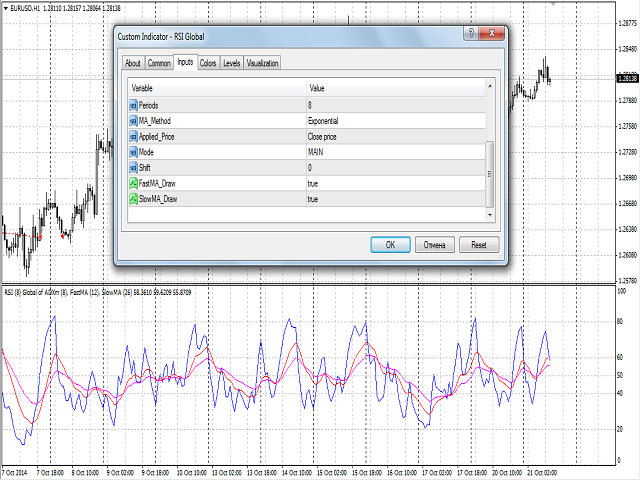
Inputs
- Calc_Method - the indicator, based on which the RSI will be calculated.
- RSI_Period - the period of RSI calculation.
- Periods - the period for the calculation of the basic indicator, based on which RSI will be calculated.
- FastPeriod - the fast MA period of the basic indicator (for example MACD), based on which the RSI will be calculated.
- SlowPeriod - the slow MA period of the basic indicator.
- SignalPeriod - the signal line period of the basic indicator.
- MA_Method - averaging method for the MA of the basic indicator and for MAs.
- Applied_Price - the used price of the basic indicator.
- Mode - the index of the line (MAIN - 0 or SIGNAL - 1) of the basic indicator, based on which the RSI will be calculated.
- Shift - the sift o the basic indicator relative to the price chart.
- FastMA_Draw - the criterion of using in calculations and drawing the fast MA.
- SlowMA_Draw - the criterion of using in calculations and drawing the slow MA.