Flat finder MT4
- インディケータ
-
Yuriy Lyachshenko
 外国為替取引、さまざまな数学的モデルに基づく戦略開発、プログラミングに興味があります。
 - バージョン: 1.0
- アクティベーション: 5
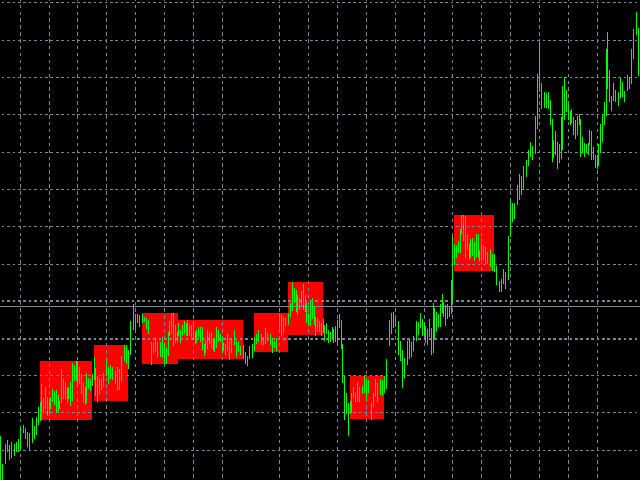
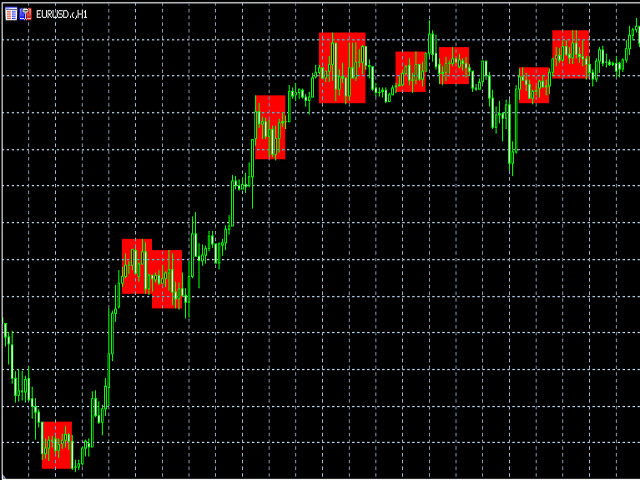
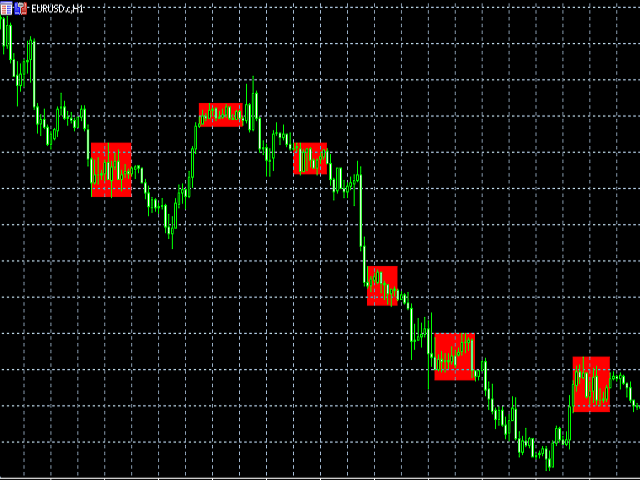
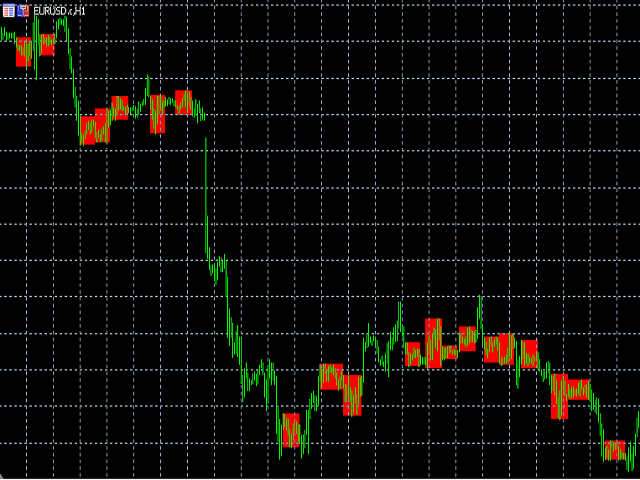
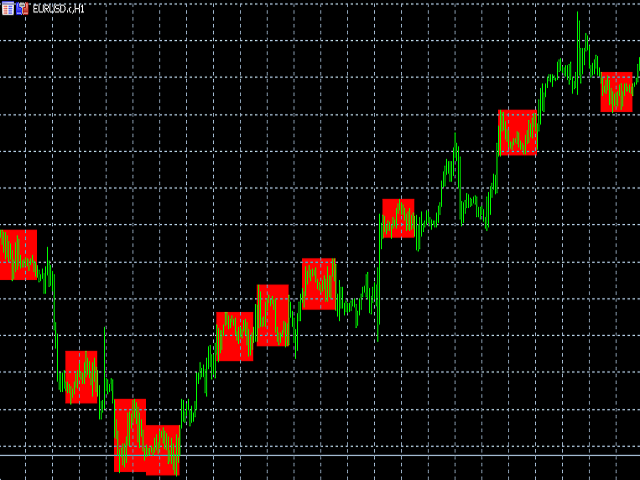
このインジケータは、横ばいを検出し、検出された領域を色の付いた四角形で塗りつぶします。
このインディケータの主なアイデアは、価格がチャート上の特定の領域を埋 めたときにフラットを検出することです。
入力パラメータ
Color rectangle - 影を付ける矩形の色。
Bars in rectangle - 長方形内のバーの最小許容数。
Density in % - 平坦の密度。矩形の面積に対するパーセンテージで設定。
このインディケータの主なアイデアは、価格がチャート上の特定の領域を埋 めたときにフラットを検出することです。
入力パラメータ
Color rectangle - 影を付ける矩形の色。
Bars in rectangle - 長方形内のバーの最小許容数。
Density in % - 平坦の密度。矩形の面積に対するパーセンテージで設定。
__________________________________________________________________
__________________________________________________________________