KT Heiken Ashi Smoothed MT4
- Indicateurs
-
KEENBASE SOFTWARE SOLUTIONS
 Keenbase Trading développe des indicateurs professionnels et des Expert Advisors pour MetaTrader 4 et MetaTrader 5 afin d'aider les traders à prendre des décisions de trading plus éclairées.
 - Version: 1.5
- Mise à jour: 10 mai 2022
- Activations: 10
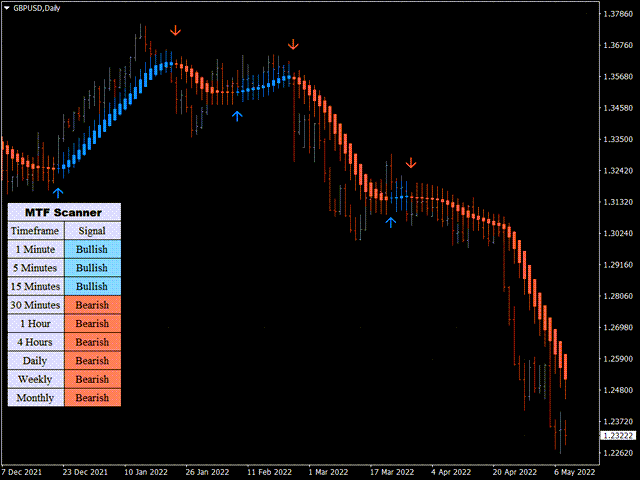
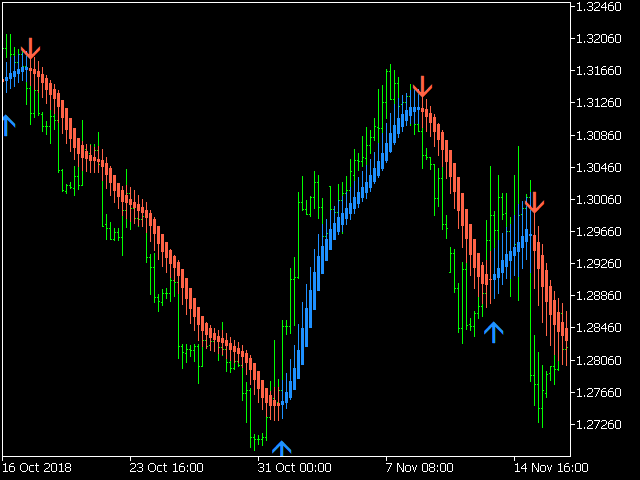
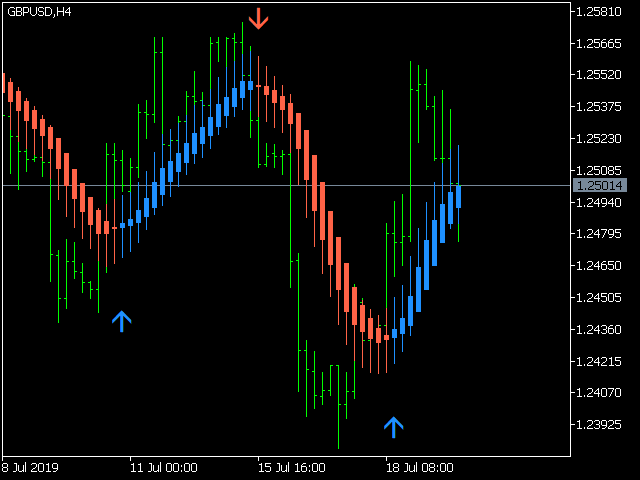
KT Heiken Ashi Smoothed est une version lissée du Heiken Ashi classique ; il trace également des flèches d’achat/vente lors d’un changement de tendance.
- Une flèche d’achat apparaît quand l’état passe de baissier à haussier.
- Une flèche de vente apparaît quand l’état passe de haussier à baissier.
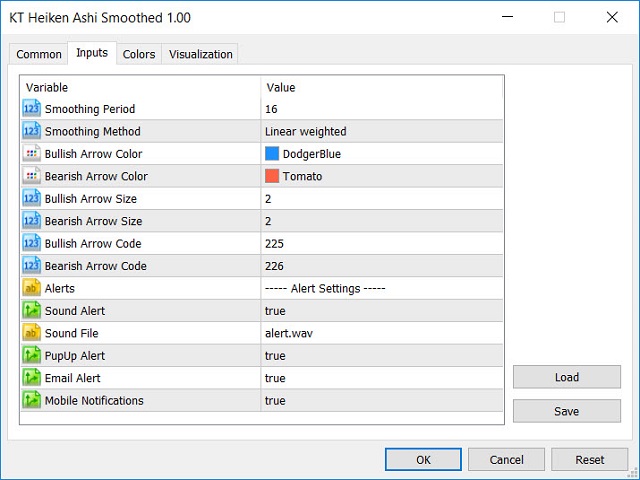
- Alertes mobiles, email, sonores et fenêtres pop-up incluses.
Qu’est-ce que le Heiken Ashi Smoothed ?
Il élimine les faux signaux et le bruit du Heiken Ashi standard en appliquant deux moyennes mobiles pour lisser les prix. Malgré un léger retard, il permet de repérer les points de swing et les tendances naissantes, révélant des dynamiques invisibles à l’œil nu. Les traders peuvent alors ajuster leurs stratégies.
Applications
L’indicateur s’utilise sur Forex, matières premières et actions. Voici cinq usages principaux pour déceler des opportunités.
- Bougies bleues sans ombre basse : forte tendance haussière.
- Bougies rouges sans ombre haute : forte tendance baissière.
- Un changement de tendance survient souvent avec une petite bougie et de longues mèches.


L'utilisateur n'a laissé aucun commentaire sur la note