AIS Sliding Median and Moving Average MT5
- Göstergeler
- Sürüm: 2.0
- Güncellendi: 18 Kasım 2024
- Etkinleştirmeler: 5

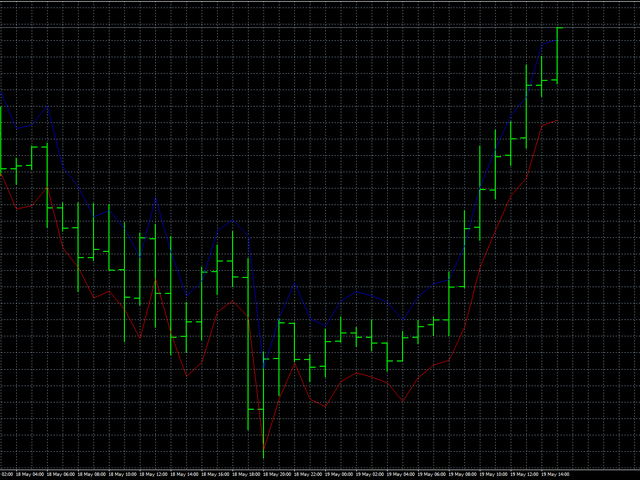
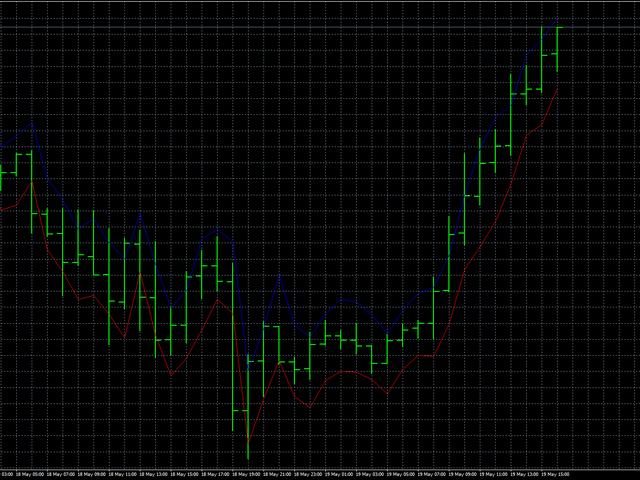
The indicator is based on the analysis of interaction of two filters.
The first filter is the popular Moving Average. It helps to identify linear price movements and to smooth minor price fluctuations.
The second filter is the Sliding Median. It is a non-linear filter. It allows to filter out noise and single spikes in the price movement.
A predictive filter implemented in this indicator is based on the difference between these filters.
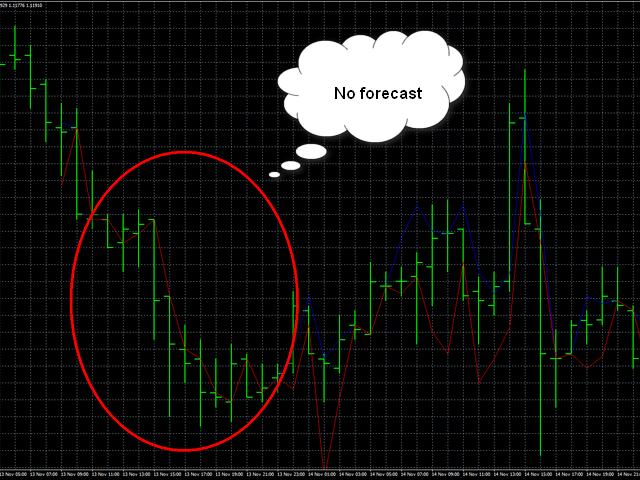
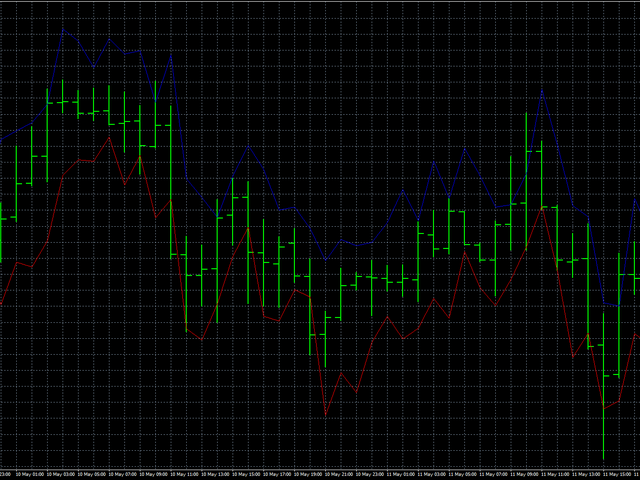
The indicator is trained during operation and is therefore very sensitive to history. If a chart contains few bars, forecast may not be available in some cases. This situation is shown in the first figure. If there are two many bars, there can be a slight delay during indicator start.
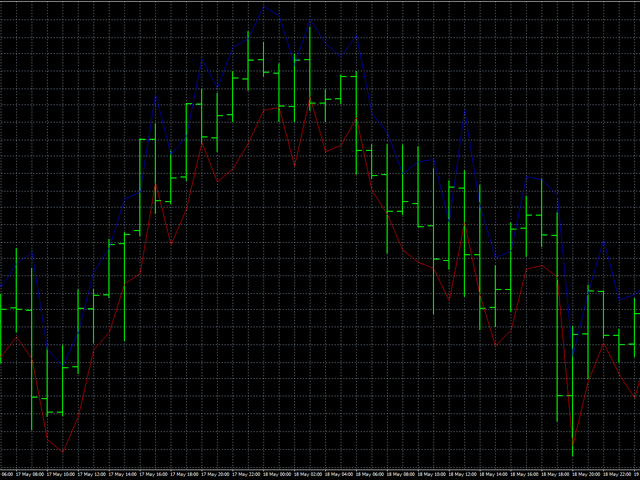
Filter level - the parameter allows to configure the indicator operation. The value is set between 0 and 255. It allows toy to select the number of bars to be processed by the indicator.
Since the number of bars must be strictly odd, their number is calculated by the formula Filter level * 2 + 1.
If Filter level = 0, it will be a "trustful" averager and repeater of previous values. As this parameter increases, the number of factors taken into account increases, which allows you to track global price movements. A value for this parameter should be selected based on the volatility of the currency pair, the timeframe and your own preferences.