AIS Sliding Median and Moving Average MT5
- Indikatoren
- Version: 2.0
- Aktualisiert: 18 November 2024
- Aktivierungen: 5

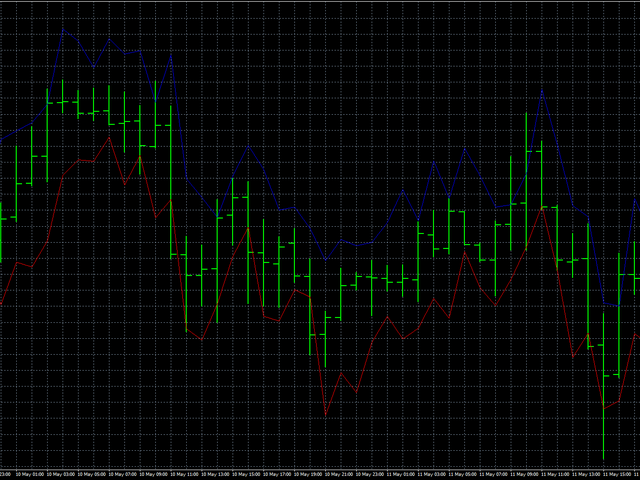
Der Indikator basiert auf der Analyse der Interaktion von zwei Filtern.
Der erste Filter ist der beliebte Gleitende Durchschnitt. Er hilft dabei, lineare Kursbewegungen zu erkennen und kleinere Kursschwankungen zu glätten.
Der zweite Filter ist der gleitende Median. Er ist ein nichtlinearer Filter. Er ermöglicht es, Rauschen und einzelne Ausschläge in der Kursbewegung herauszufiltern.
Ein in diesem Indikator implementierter Vorhersagefilter basiert auf der Differenz zwischen diesen Filtern.
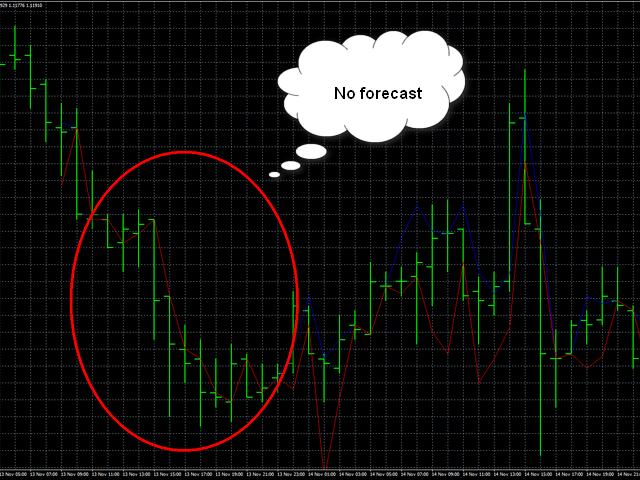
Der Indikator wird während des Betriebs trainiert und ist daher sehr empfindlich gegenüber der Historie. Wenn ein Diagramm nur wenige Balken enthält, ist eine Vorhersage in manchen Fällen nicht möglich. Diese Situation ist in der ersten Abbildung dargestellt. Wenn es zwei oder mehr Balken gibt, kann es zu einer leichten Verzögerung beim Start des Indikators kommen.
Filterniveau - der Parameter ermöglicht die Konfiguration des Indikatorbetriebs. Der Wert wird zwischen 0 und 255 eingestellt. Er erlaubt es, die Anzahl der vom Indikator zu verarbeitenden Balken zu wählen.
Da die Anzahl der Balken streng ungerade sein muss, wird ihre Anzahl nach der Formel Filterstufe * 2 + 1 berechnet.
Wenn der Filterlevel = 0 ist, handelt es sich um einen "vertrauenswürdigen" Mittelwertbildner und Wiederholer früherer Werte. Mit steigendem Wert dieses Parameters erhöht sich die Anzahl der berücksichtigten Faktoren, wodurch Sie globale Preisbewegungen verfolgen können. Der Wert für diesen Parameter sollte auf der Grundlage der Volatilität des Währungspaares, des Zeitrahmens und Ihrer eigenen Präferenzen gewählt werden.