Market State Intelligence Nexus
- Uzmanlar
- Sürüm: 1.3
- Etkinleştirmeler: 5

MSI-Nexus (MSI BB-LRMA Bi-Drive)
What It Does and Why It Matters
The problem it solves
Bollinger Bands tell you the envelope. LRMA tells you the trend. On their own they answer one question: is LRMA above or below the band middle? Traders who rely on that alone may enter or exit late, and cannot efficiently tell whether a signal is fresh or stale across the timeframes that matter.
MSI-Nexus (MSI BB-LRMA Bi-Drive) answers the questions that come after that one.
| Trader's question | What answers it |
|---|---|
| Is a cross actually coming, or is the gap just drifting? | PROXIMITY |
| Is the trend still building? | SLOPE |
| Which side is LRMA on? | SIGNAL (doubles as Regime) |
| Is the band compressing or expanding? | BAND |
| Has price escaped the band, and is that escape valid? | BREAK |
| Do the higher timeframes agree? | HTF filter |
| Is this signal still valid or has it aged out? | Signal Age |
| Which direction does the evidence favour right now? | Trend / Revert meter |
| Why did the EA not take that trade? | Status line |
The BBMA colour (intuitive regime reading)
A visual detail worth knowing before the layer table: the BBMA changes colour when LRMA crosses it. Bullish when LRMA is above, bearish when below. The regime is visible at a glance on the chart (with an arrow plot), without reading the panel.
Five signal layers
Each layer measures a different property of the same LRMA-vs-BBMA relationship. They are independent and can agree, disagree, or split.
SIGNAL: LRMA crossed its BBMA. Doubles as the regime indicator: BULL means BUY is the allowed direction, BEAR means SELL.
PROXIMITY: LRMA is closing on its BBMA. Detects the approach, not the arrival. The earliest actionable warning the EA produces.
SLOPE: LRMA is trending up or down over the last three bars. Confirms the move is still in motion.
BAND: Bollinger Band width is compressed, normal, or expanded. Context for whether the trend will continue or a reversal is building.
BREAK: price has escaped the band, held until SLOPE flips and price returns inside. No arbitrary time decay.
Each can be toggled on or off. Each contributes a fixed weight to the confidence scores when enabled.
Confluence, not coincidence
A single layer firing is one opinion. Two or more agreeing is a decision.
The meter aggregates the enabled layers into two independent readings: Trend (how aligned the current direction is) and Revert (how much evidence there is for a reversal). The weights are fixed and disclosed:
| Layer | Trend weight | Revert weight |
|---|---|---|
| SIGNAL | 25 | — |
| SLOPE | 20 | — |
| BREAK | 25 | — |
| PROXIMITY (diverging) | 15 | — |
| PROXIMITY (converging) | — | 15 |
| BAND (expanding) | 15 | — |
| BAND (compressed) | — | 15 |
The two readings do not sum to 100 and are not opposites. Both can be high when the trend is strong but the gap is closing, that is exactly the moment to stand aside. Both low means no edge. The meter shows this instantly.
Entry logic: OR or AND
OR: any enabled layer triggers. More trades, earlier entries.
AND: all enabled layers must agree. Fewer trades, tighter filter.
A single input toggles between them. No code editing.
The HTF filter — five modes, one input
The EA reads one column across three higher timeframes and votes 2-of-3 or 3/3 (panel background changes colour to visually alert user).
| Mode | What it filters on | Temporal role |
|---|---|---|
| SLOPE | Trend consensus | Earliest physical event — the movement |
| PROXIMITY | Cross-imminent consensus | Intermediate — the closing gap |
| SIGNAL | LRMA-vs-BBMA consensus | Latest — the actual crossing |
| BAND | Context only — no directional filter | Independent of direction |
| BREAK | Active-breakout gate | Independent — the escape |
The three directional layers form a causal sequence: SLOPE describes whether LRMA is moving, PROXIMITY describes whether it is closing on its BBMA, and SIGNAL describes the crossing itself. Each can flip independently of the others depending on the market profile — in a decelerating market SLOPE turns first, in an accelerating market SIGNAL can cross before the smoothed 3-bar SLOPE has caught up. This is why the layers are weighted independently rather than ranked in a pipeline.
BULLISH consensus allows BUY, blocks SELL. BEARISH does the opposite. NEUTRAL allows both (if yu set it do so).
Event mode vs State mode (one switch)
| Mode | Behaviour |
|---|---|
| STATE-DRIVEN | Re-enters on the next bar if signals stay aligned. Pyramids into a running trend. |
| EVENT-DRIVEN | One entry per signal transition. Waits for the state to flip before entering again. |
Both modes respect every filter. The switch changes how often entries occur, not whether they are filtered.
Trade lifecycle management
The EA runs the position from open to close, not just at entry.
-
Take profit and stop loss — set at entry, enforced against broker minimum distance.
-
Breakeven — moves the stop to entry plus a buffer once profit reaches a threshold. Percentage of TP or fixed points.
-
Trailing stop — activates at a defined profit level and trails with a step filter to prevent churn. Can be held back until breakeven.
-
Partial close — closes a portion at defined profit levels. Fixed points or percentage of TP.
-
Reversal — when an exit signal fires and the opposite direction is valid, the EA closes and reverses in one operation.
Every management step respects the broker's stops level and freeze level.
Risk management
-
Position limits — separate caps for BUY and SELL. Set either to zero for long-only or short-only.
-
Lot sizing — fixed lots, percent of balance risked against the stop, or percent of equity.
-
Margin safety — before every order, required margin is checked against free margin. If it does not fit, lot is reduced or the trade is skipped.
-
Spread filter — blocks entries when spread exceeds a threshold you set.
-
Session filter — restrict trading to chosen hours, or leave it 24/7.
-
Entry spacing — minimum distance between same-direction entries prevents clustering many trades in the same price zone. Reduces over-trading during fast markets and keeps entries distributed across the move rather than stacked on one bar.
-
No-money cooldown — 10-second pause on insufficient-funds errors to prevent retry storms.
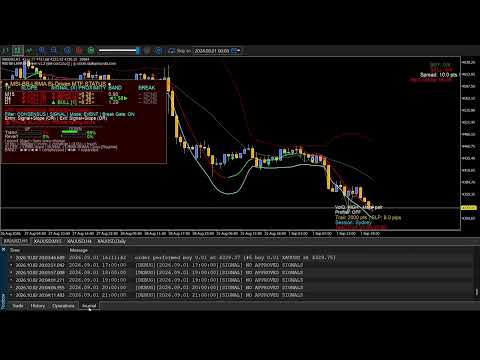
The panel — what the trader sees
One panel, read top-down.
Multi-timeframe table — five layers for each of the three HTFs, colour-coded, with ages.
HTF consensus — current vote.
Configuration summary — what is enabled, in what logic.
Status line — one of three states, shown only when relevant:
-
⛔ TRADE BLOCKED: <reason> (red)
-
✕ TRADE CLOSED: <reason> (sky-blue)
-
✅ TRADE ALLOWED (green)
PROXIMITY footer — names the timeframes where a cross is imminent. Shown only when applicable.
Trend / Revert meter — two independent rows, UP and DOWN batteries on each.
Nothing is shown unless it means something. The panel is quiet when nothing is happening and informative when something is.
The PROXIMITY layer (the edge)
The classic LRMA-BBMA crossover plots on the closed candle. By the time it appears, the move has begun.
PROXIMITY measures whether LRMA is closing on its BBMA. It detects the approach and reads the direction from the sign of the gap:
-
LRMA above BBMA and closing → down-cross imminent → revert-down precursor
-
LRMA below BBMA and closing → up-cross imminent → revert-up precursor
The distance is normalised by LRMA's own recent volatility, so the same thresholds work on gold, FX, indices, and crypto without re-tuning. Two safeguards filter false starts:
-
A touch band — when the gap is inside it, the state goes neutral because direction is ambiguous.
-
A minimum convergence count — require N consecutive converging bars before reporting.
The result is a signal that arrives before the plotted crossover without firing on every LRMA wiggle.
The BAND layer — the context
Bollinger Band width compared to its own recent average tells you whether the market is coiling or expanding.
-
Compressed → a breakout or reversal is building
-
Expanded → the trend is in force and continuation is more likely
-
Normal → no strong volatility signature
Compression amplifies revert confidence. Expansion amplifies trend confidence. Neither is a trigger — BAND tells you which of the other layers to trust more.
Configuration
The signal engine is controlled by a small set of inputs:
| Input | What it does |
|---|---|
| EventDrivenMode | State or event entry behaviour |
| EntryLogic / ExitLogic | OR or AND |
| UseEntry / UseExit | Which layers participate |
| HTFColumn | Which column the HTF filter reads |
| UseBreakGate | Require active breakout for entry |
| ProximityTouchNorm / ProximityVeryCloseNorm | Touch band and footer threshold |
| ProximityATRLen / ProximityMinConvergeBars | Normalisation length and confirmation |
| BandAvgPeriod / BandCompression / BandExpansion | Band context thresholds |
Everything else is risk, display, or notification, and all of it has a working default. The EA trades out of the box with no configuration change. Tuning is optional, not required.
What it does not claim
It does not predict price. It does not guarantee profit. It does not publish a win rate. It aggregates market state across five independent layers, weights them, filters them, and acts when the aggregate meets your configured logic. Whether that produces an edge on your instrument and timeframe is a question only your own testing can answer. We do transparency differently and don't embellish. But do let us know what you think of our work, even criticism is welcome.
Who it is for
The trader who already uses Bollinger Bands and Linear Regression (or wants to learn how to automate their combination) and wants them to answer more than one question at a time. The trader who wants a multi-timeframe view without maintaining three charts. The trader who values a status line that says why the EA did nothing, as much as one that says what it did and why. The trader who wants the signal engine disclosed, weighted, and visible, not hidden behind a black box.
More detailed how-to-use guide available on request upon purchase.