Multi Time Frame VWAP

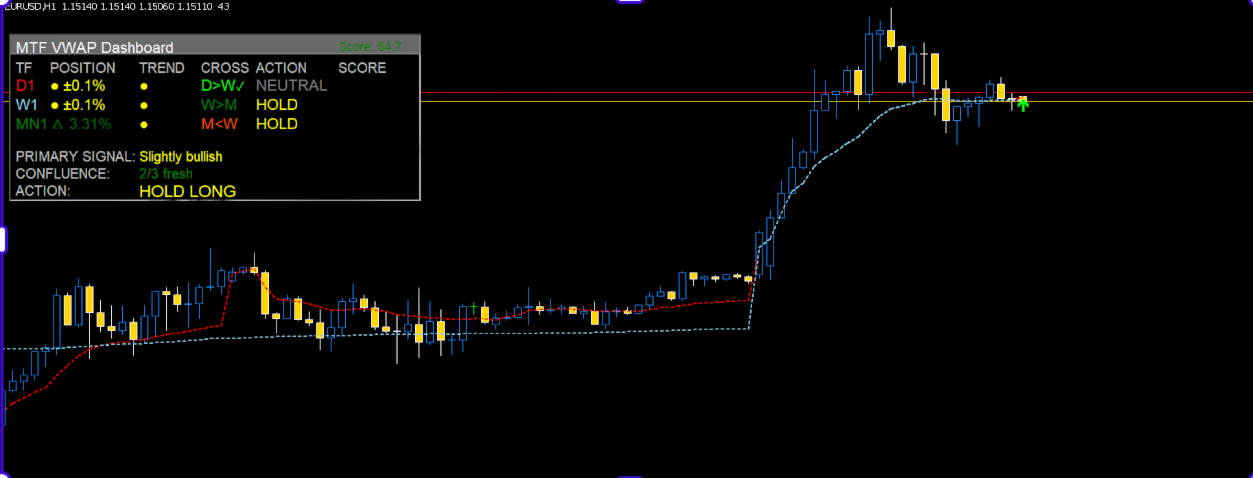
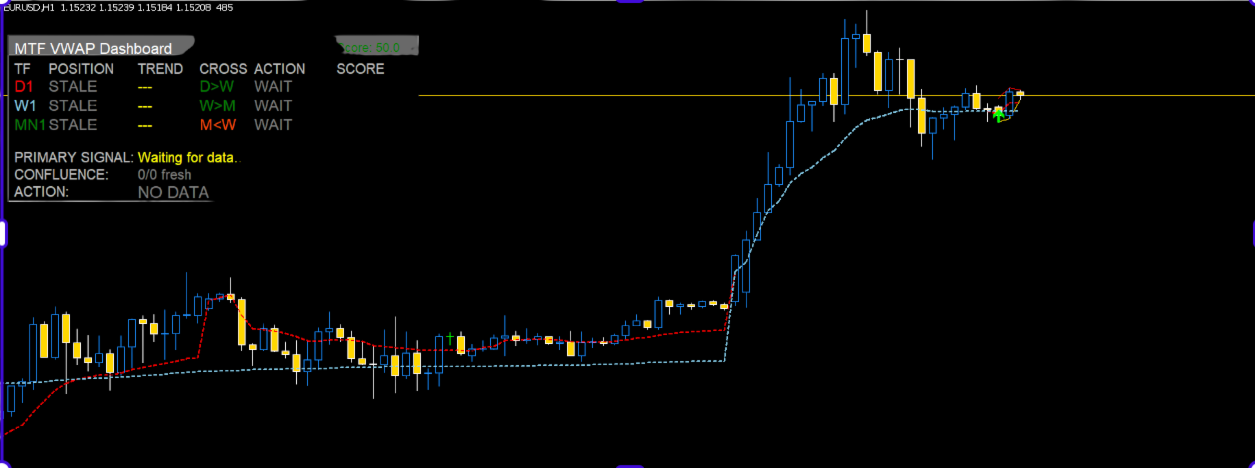
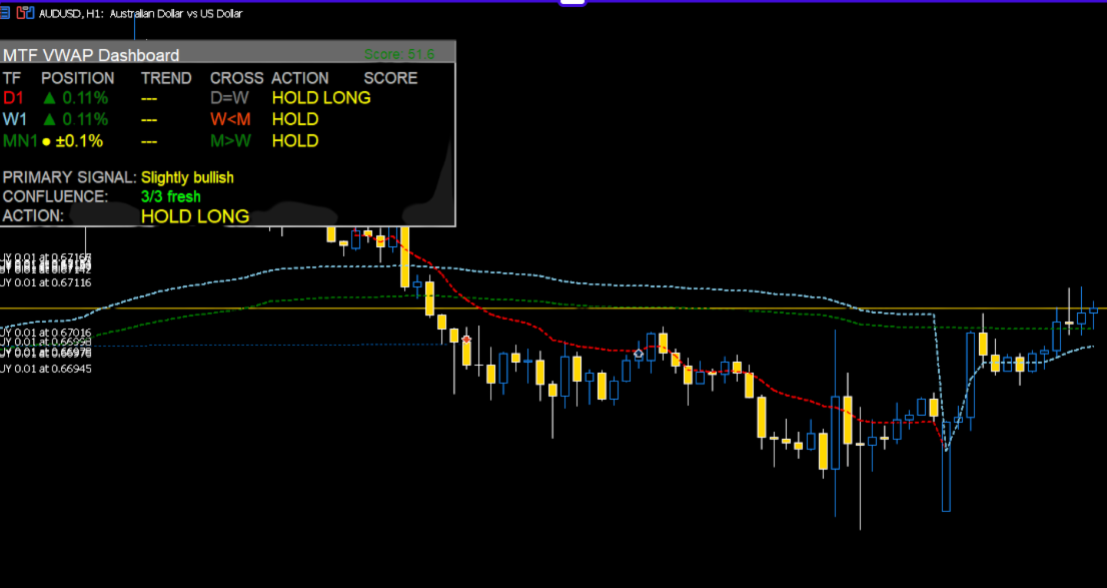
MTF VWAP Indicator - Quick Overview


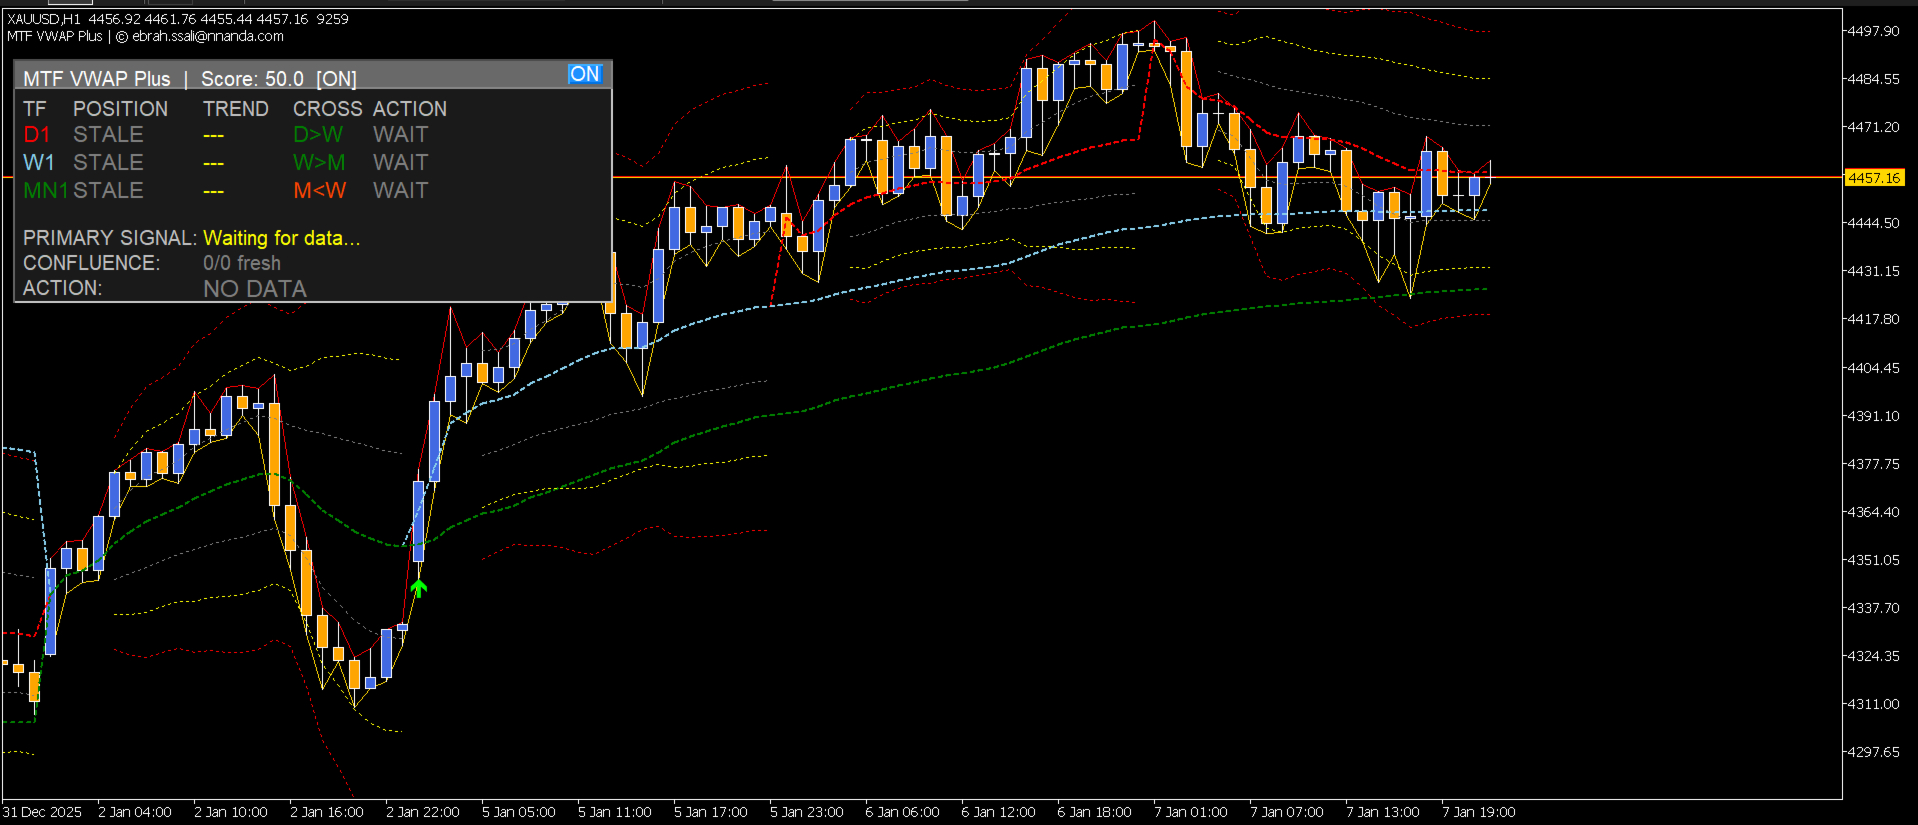
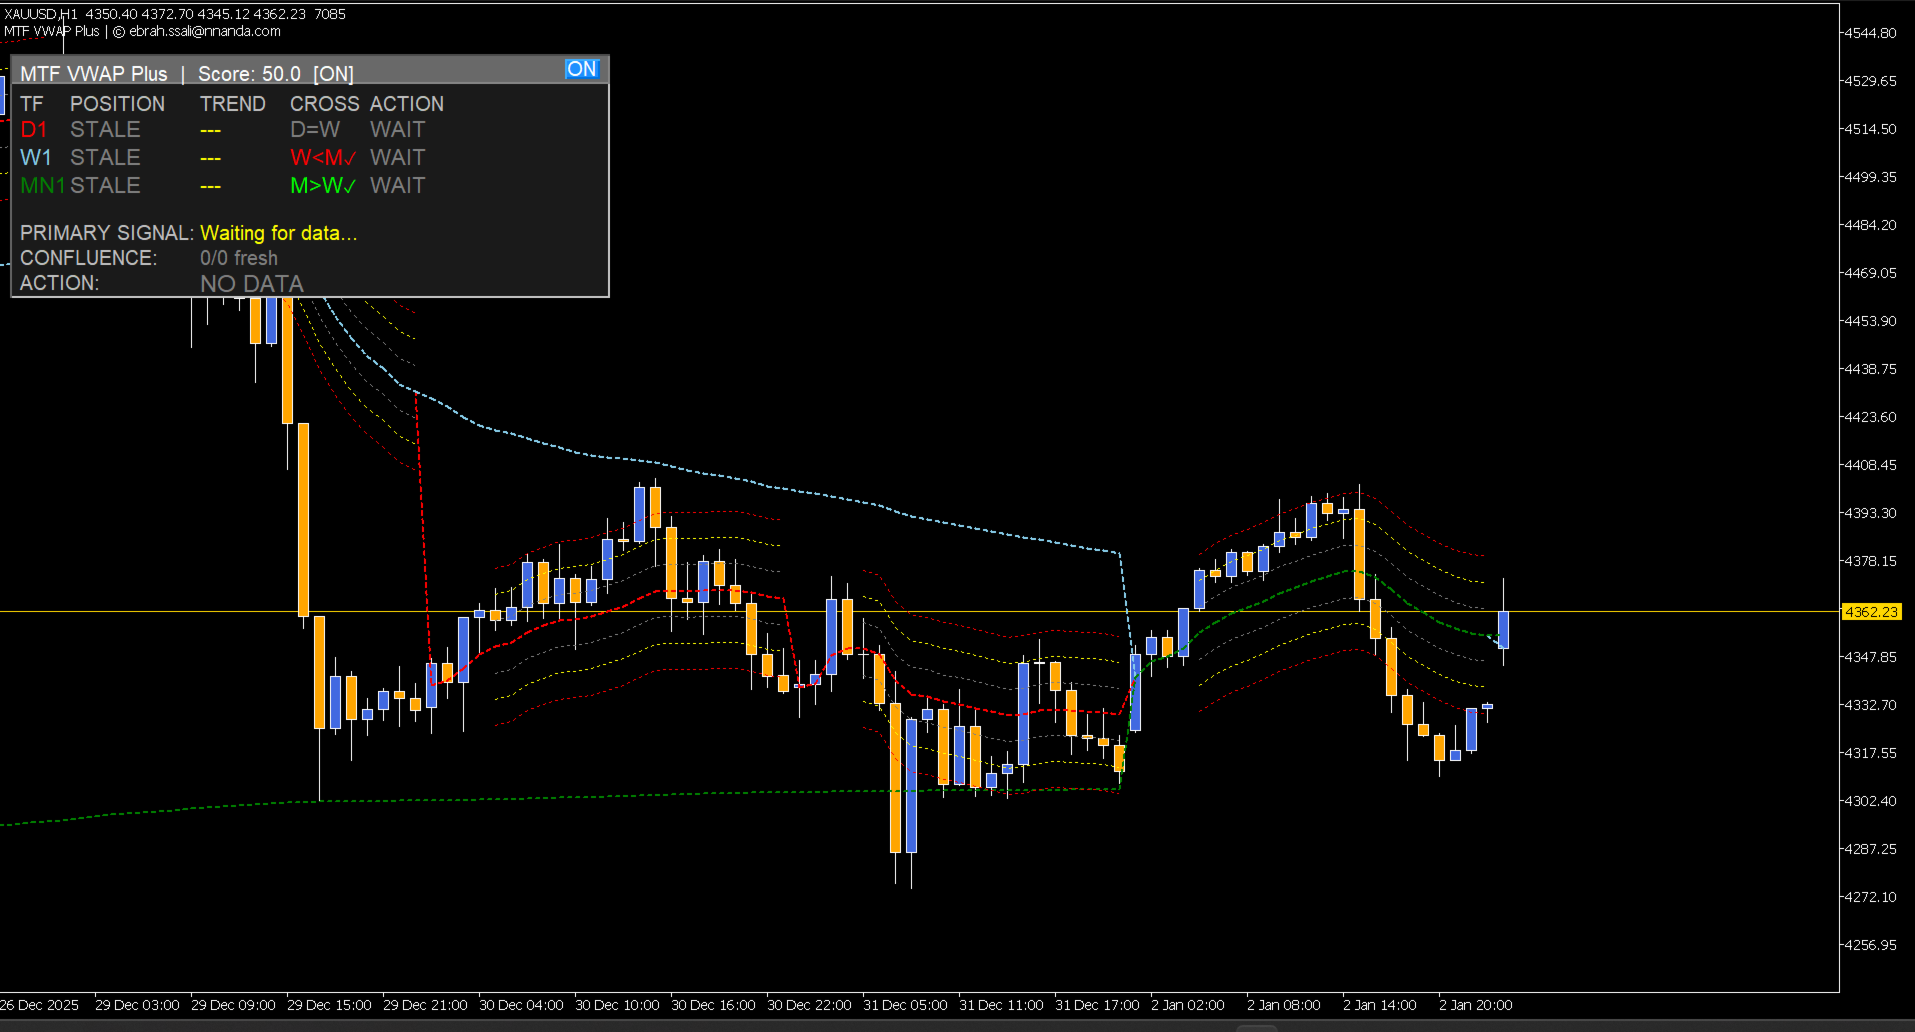
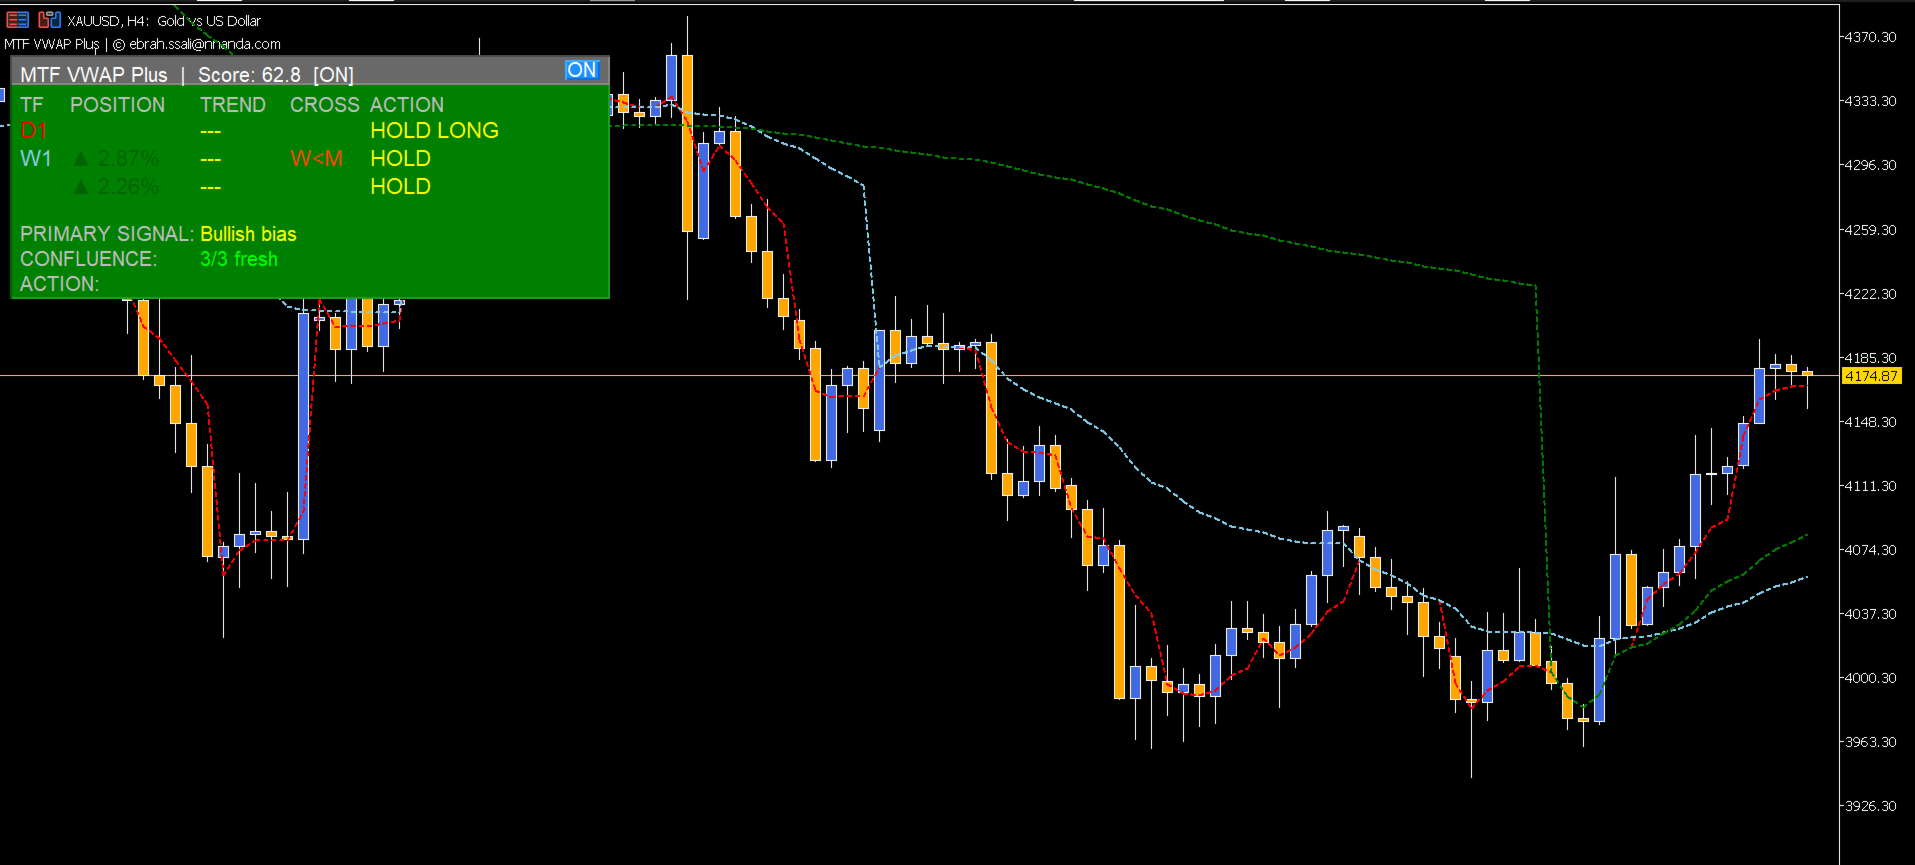
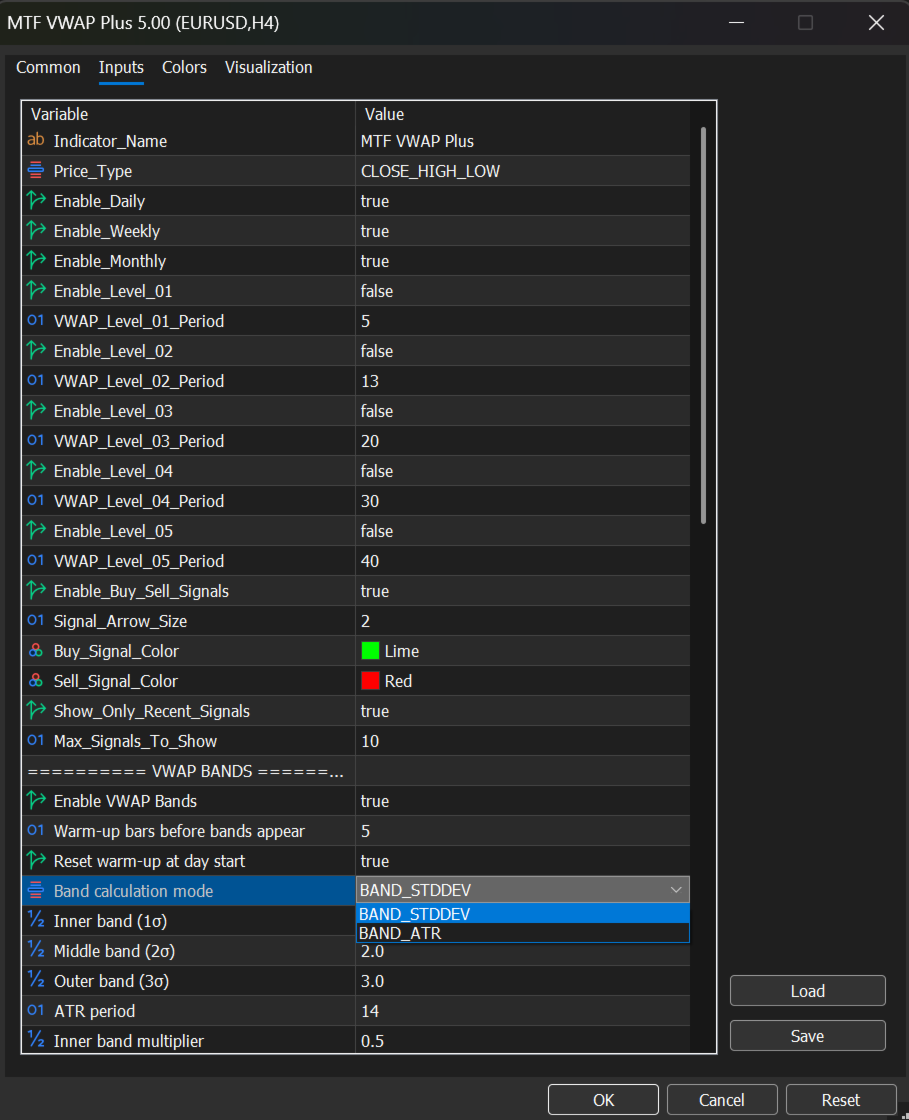
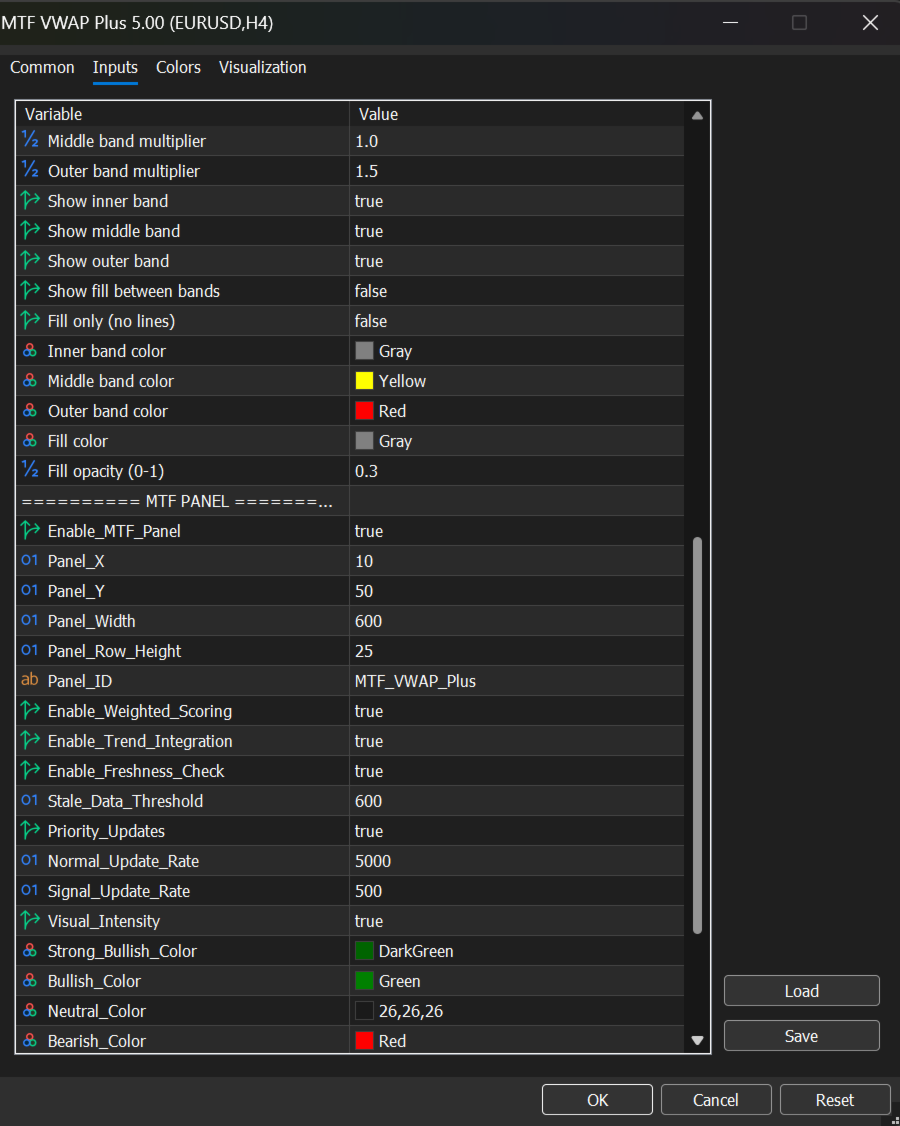
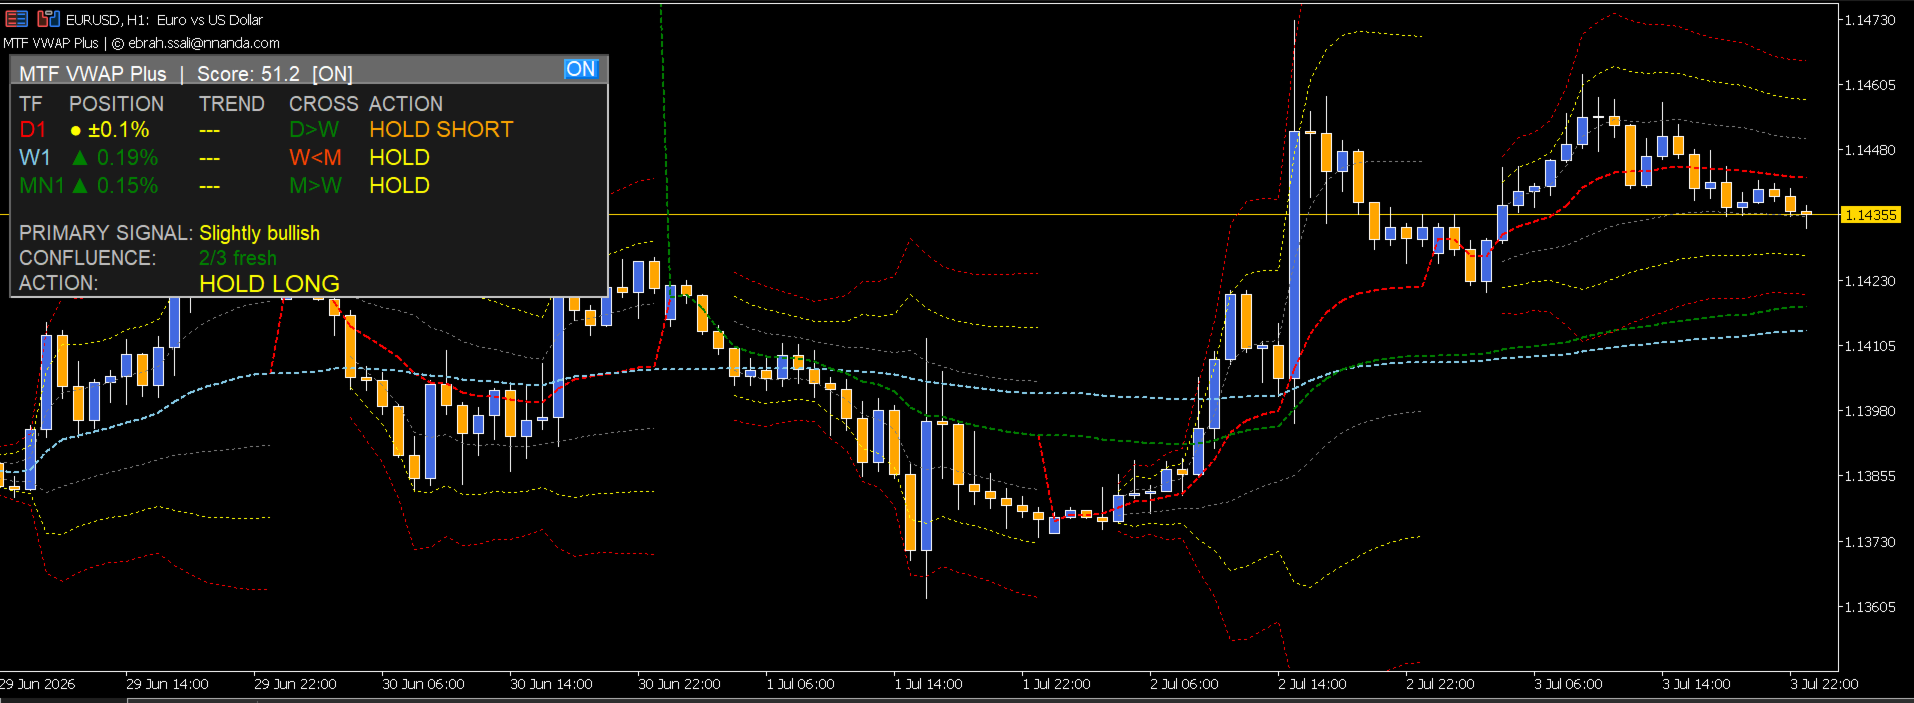
This indicator shows you where institutional money is flowing across multiple timeframes using Volume Weighted Average Price (VWAP) to identify high-probability trading zones.


 What It Actually Does:


 1. Tracks Smart Money Levels:

- Shows Daily, Weekly, and Monthly VWAP lines where big players (banks, funds) are trading

- Tells you if price is above or below these key institutional levels

- Shows distance from VWAP as a percentage (tells you how extended price is)


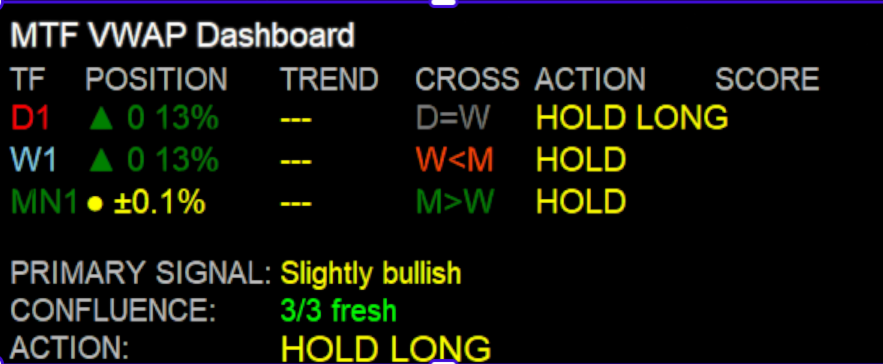
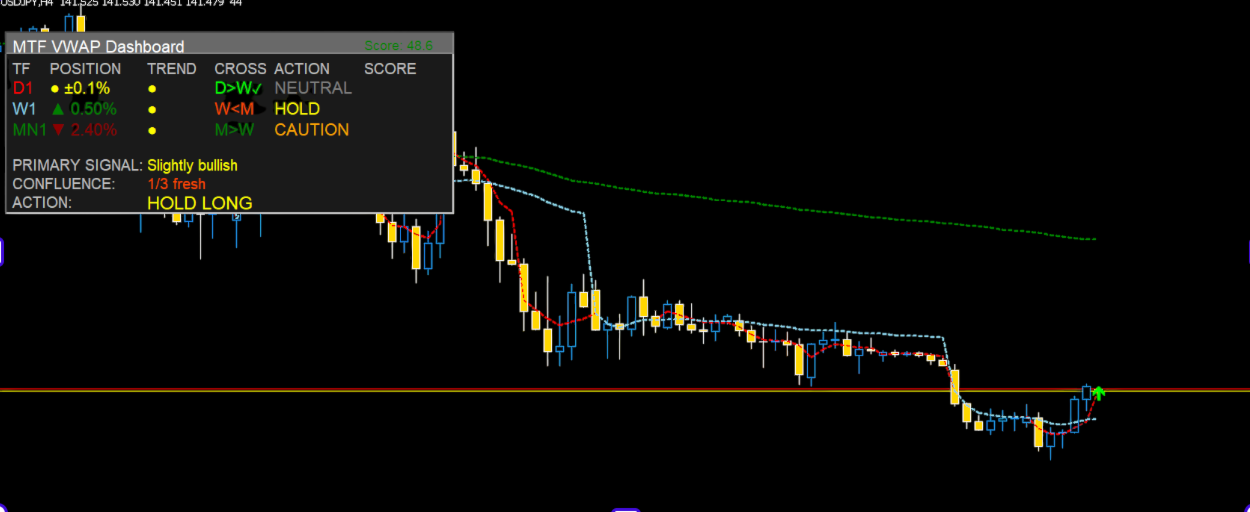
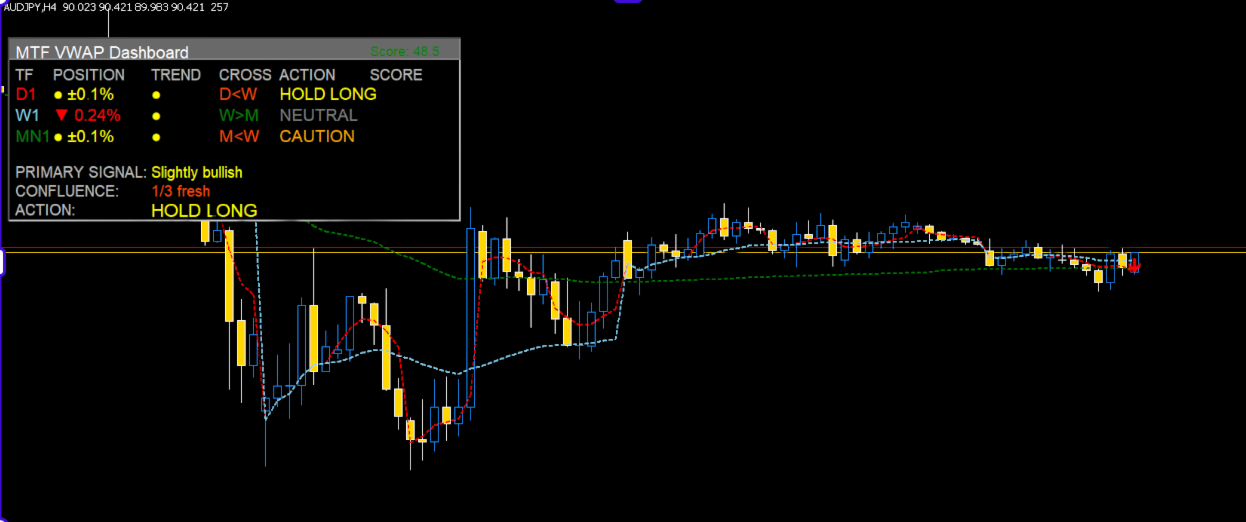
 2. Reveals Timeframe Confluence:

- Tells you when multiple timeframes agree (e.g., Daily AND Weekly both bullish)

- Shows when timeframes disagree (warning sign of choppy markets)

- Scores market bias from 0-100 based on overall alignment


 3. Provides Clear Trading Actions:

- Gives specific ACTION signals (BUY, SELL, HOLD, WAIT) based on rules

- Shows throttled trend direction with arrows (▲▲ = strong uptrend, = downtrend)

- Highlights fresh crosses () when Daily crosses above/below Weekly


 4. Manages Risk Visually:

- Stop losses are obvious (below Daily VWAP for longs, above for shorts)

- Targets are clear (next VWAP level above/below)

- Risk:Reward is visible (distance between VWAP levels)


 For Traders, It Means:


 If you're confused about direction:

→ Look at the ACTION column and Score - tells you what to do


 If you don't know where to enter:

→ Buy when price bounces off Daily VWAP with bullish action

→ Sell when price rejects at Daily VWAP with bearish action


 If you don't know where to exit:

→ Take profit at next VWAP level (Weekly for Daily trades)

→ Stop loss below/above Daily VWAP


 If you're unsure about risk:

→ Large position when 3/3 timeframes agree

→ Small position when only 2/3 agree

→ No position when timeframes disagree


 Bottom Line:

This indicator turns complex multi-timeframe analysis into simple color-coded signals that tell you:

- WHAT to do (Buy/Sell/Hold)

- WHEN to do it (on crosses/bounces)

- WHERE to place stops/targets (at VWAP levels)

- HOW MUCH to risk (based on confluence)


Think of it as: Your personal institutional flow tracker that shows where the smart money is positioned across different time horizons.


Önerilen ürünler
The   Visual Volatility Clustering   indicator clusters the market based on volatility. The indicator does not redraw and gives accurate data, does not use closing prices. Uses the opening prices or the highs or lows of the previous completed bar. Therefore, all information will be clear and unambiguous. The essence of the indicator is to divide the price market into certain areas according to a similar type of volatility. This can be done in any way. In this example, the indicator is configure
The "MR Volume Profile 5" indicator is a charting tool that displays trading volume at different price levels rather than time intervals. A key concept in volume profile is the point of control (POC)—the price level with the highest volume traded during the session or time range. While tools like VWAP or OBV provide volume trends, the "MR Volume Profile 5" indicator offers granular detail about where the most market activity occurs at specific price levels. This makes it a more precise tool for
Do you use volume in your reading of the market? Certainly many traders use it, and do not imagine operating without it. The Color Histogram Volume Set indicator allows the user to choose the value that he considers interesting to monitor. When you pass this you will have visual confirmation and if you want you will also have the audible alert that is given by the indicator. Of course, there are other ways to try to find a high volume, such as assessing whether the volume is above av
Daily & Composite Volume Profile   This is a professional-grade market profile tool designed for MetaTrader 5. It utilizes a   Dual-Profile System   to visualize supply, demand, and liquidity concentrations. Key Features Left Side: Daily Session Profiles Automatically identifies the start and end of every trading day. Generates a unique Volume Profile for each individual day. Allows you to see how value migrated from yesterday to today (e.g., Is today's volume higher or lower than yesterday?).
Each VolumeProfile holds: The price range for a given period Buy/sell volume for each price level Calculated POC, VAH, VAL, Delta, and Imbalance Indicator Logic Summary Divide data by timeframe (e.g., one H1 profile per hour). Aggregate volumes for each price level. Separate buy and sell volumes using tick or trade direction. Compute Delta (Buy − Sell) and Imbalance (dominance ≥70%). Detect POC, VAH, VAL to outline the Value Area. Draw graphical profiles beside price candles using color-co
Buy Sell Visual MTF V2 for MT5
Naththapach Thanakulchayanan
This MT5 indicator, Bull Bear Visual MTF V2, summarize the strength color graphic and percentages of power for both  Bull and Bear in current market emotion stage which will show you in multi timeframes (21) and sum of the total Bull and Bear power strength which is an important information for traders especially you can see all Bull and Bear power in visualized graphic easily, Hope it will be helpful tool for you for making a good decision in trading.
VWAP Level MT5
Francesco Lenza
4.5 (2)
The VWAP Level indicator is a technical analysis tool that calculates the weighted average price for the traded volumes of a specific asset. The VWAP provides traders and investors with the average price of an asset over a specific time frame. It is commonly used by investors to compare data on "passive" trading operations, such as pension funds and mutual funds, but also by traders who want to check if an asset has been bought or sold at a good market price. To calculate the VWAP level we us
FREE
Blahtech Supply Demand MT5
Blahtech Limited
4.54 (13)
Was: $299  Now: $99  Supply Demand uses previous price action to identify potential imbalances between buyers and sellers. The key is to identify the better odds zones, not just the untouched ones. Blahtech Supply Demand indicator delivers functionality previously unavailable on any trading platform. This 4-in-1 indicator not only highlights the higher probability zones using a multi-criteria strength engine, but also combines it with multi-timeframe trend analysis, previously confirmed swings a
This product is designed for the MT5 platform and offers two key features: VWAP (Volume Weighted Average Price) calculation and Volume Profile analysis. Advantages: VWAP Calculation: The product calculates the VWAP, which is a popular indicator used by traders to determine the average price of a security based on its trading volume. It helps identify potential buying or selling opportunities by comparing the current price to the average price weighted by volume. Volume Profile Analysis: The prod
Volume Profile Canvas - Professional Volume Profile Indicator for MetaTrader 5 DESCRIPTION Volume Profile Canvas is a professional volume profile indicator for MetaTrader 5 that renders directly on the chart using a high-performance Canvas engine. It calculates and displays the volume distribution across price levels, identifying the Point of Control (POC), Value Area High (VAH) and Value Area Low (VAL) in real time. This is a pure analysis tool. It does not trade. It gives you an instant vi
Market Profile Osw MT5
William Oswaldo Mayorga Urduy
Kullanım Kılavuzu: Market Profile Osw Market Profile Osw, belirli bir dönemdeki hacim ve fiyat dağılımını görselleştirmenize olanak tanıyan gelişmiş bir müzayede analizi aracıdır. Geleneksel mum grafiklerinin aksine bu sistem, ticaret faaliyetinin en yoğun olduğu yerleri ortaya çıkararak gerçek piyasa katılımına dayalı psikolojik destek ve direnç bölgelerinin belirlenmesine olanak tanır. 1. Parametre Kılavuzu (Girişler Menüsü) Genel Ayarlar Show Market Profile: Grafikte profil görselleştirmesi
Was: $249  Now: $99   Market Profile defines a number of day types that can help the trader to determine market behaviour. A key feature is the Value Area, representing the range of price action where 70% of trading took place. Understanding the Value Area can give traders valuable insight into market direction and establish the higher odds trade. It is an excellent addition to any system you may be using. Inspired by Jim Dalton’s book “Mind Over Markets”, this indicator is designed to suit the
Breakout Boxes with Volume Pressure This indicator automates the identification of key consolidation zones (Supply and Demand) based on Market Pivots and Volatility (ATR). Unlike standard support/resistance tools, this indicator provides a unique   Volume Pressure Analysis   inside every box, giving you insight into the battle between Buyers and Sellers before a breakout occurs. Key Features Automated Supply & Demand Zones:   Automatically detects significant Pivot Highs and Lows to draw dyna
Mean Volume indicator for MT5
Renaud Herve Francois Candel
Mean Volume Most indicators are based on price analysis. This indicator is based on volume. Volume is overlooked piece of information in most trading systems. And this is a big mistake since volume gives important information about market participants. Mean Volume is an indicator that can be used to spot when volume is above average. It usually means that institutional traders are active. Peak in volume can be used to confirm an entry since increased volume can sustain the move in one or anot
Poc volume honeyflow
Ali Abdalrasool Ai-sayyd Sobai
POC Highlighter - Volume Profile Indicator This indicator displays the Volume Profile and clearly marks the Point of Control (POC) with a prominent yellow horizontal line. The POC represents the price level with the highest traded volume within the visible chart range or selected period. Key Features: - Automatic calculation and display of Volume Profile histogram at the right side of the chart. - Highlights the POC level with a customizable yellow line (default: solid yellow). - Adjustable p
Fixed Volume Profile
Carlos Pascual Perez Maturano
This indicator, titled "Fixed Volume Profile.mq5", is a custom tool for MetaTrader 5 (MQL5) designed to calculate and display a Volume Profile over a user-defined fixed time range. The Volume Profile shows the distribution of trading volume at different price levels during a specific period, helping to identify areas of high activity (such as Points of Control or POCs) and volume-based support/resistance areas. Main Functionality: Interactive Range: The indicator creates two vertical lines on
FREE
WAPV Weis Wave Chart Forex
Eduardo Da Costa Custodio Santos
MT5 için Weis Wave Chart Forex bir Fiyat ve Hacim göstergesidir. Fiyat ve Hacim okuması, Richard Demille Wyckoff tarafından oluşturulan üç yasaya dayalı olarak geniş çapta dağıtıldı: Arz ve Talep, Neden ve Etki ve Çabaya Karşı Sonuç. 1900'de R.Wyckoff, analizlerinde dalga grafiğini zaten kullanmıştı. Yıllar sonra, 1990 civarında, David Weis Otomatikleştirilmiş R. Wyckoff'un dalga grafiği ve bugün size David Weis'in dalga grafiğinin evrimini sunuyoruz. Varlıkta üretilen dalga ile ilgili Hacim mik
Weis Wave Scouter
Jean Carlos Martins Roso
MetaTrader 5 için geliştirilen Weis Wave Scouter ile gelişmiş hacim analizinin gücünü keşfedin! Bu devrim niteliğindeki gösterge, Wyckoff yönteminin ve Hacim Yayılımı Analizinin (VSA) kanıtlanmış ilkelerini birleştiriyor. Operasyonlarında doğruluk ve derinlik arayan yatırımcılar için tasarlanmıştır ve kümülatif hacim dalgası analizi yoluyla piyasanın taktiksel bir okumasını sunar. Weis Wave Scouter, Classic, NightVision ve OceanBreeze gibi özelleştirilebilir renk temaları ile renkli histogramlar
Introducing   Volume Orderflow Profile , a versatile tool designed to help traders visualize and understand the dynamics of buying and selling pressure within a specified lookback period. Perfect for those looking to gain deeper insights into volume-based market behavior! MT4 Version -  https://www.mql5.com/en/market/product/122656/ The indicator gathers data on high and low prices, along with buy and sell volumes, over a user-defined period. It calculates the maximum and minimum prices during t
BoxChart MT5
Evgeny Shevtsov
5 (7)
The market is unfair if only because 10% of participants manage 90% of funds. An ordinary trader has slim changes to stand against these "vultures". This problem can be solved. You just need to be among these 10%, learn to predict their intentions and move with them. Volume is the only preemptive factor that faultlessly works on any timeframe and symbol. First, the volume appears and is accumulated, and only then the price moves. The price moves from one volume to another. Areas of volume accumu
1.       Overview The Volume Pressure Histogram (VPH) is a custom indicator for MetaTrader 5 (MT5) that measures buying and selling pressure based on tick or real volume. It highlights extreme buying/selling moments and provides a smoothed signal line for trend detection. 2.       Indicator Components ·          Volume Pressure Histogram (Colored): o    Green: Extreme buying pressure o    Lime: Buying pressure o    Red: Extreme selling pressure o    Yellow: Selling pressure ·          Signal Li
Enigmera MT5
Ivan Stefanov
3.67 (3)
ENIGMERA: Piyasanın özü (Bu, manuel bir indikatördür ve bazı özellikler mevcut MetaTrader test ortamı tarafından desteklenmeyebilir) Giriş Bu indikatör ve ticaret sistemi, finansal piyasalara benzersiz bir yaklaşım sunar. ENIGMERA, destek ve direnç seviyelerini hassas bir şekilde hesaplamak için fraktal döngüler kullanır. Gerçek bir birikim (akümülasyon) aşamasını gösterir ve yön ile hedefleri belirtir. Hem trend hem de düzeltme dönemlerinde çalışan bir sistemdir. Nasıl çalışır İndikatörün çoğu
Atlantis Pro Indicator — Tick Bazlı Hassas Analiz ve Portföy Gücü Atlantis Pro Indicator, gerçek zamanlı tick verilerini kullanarak kritik fiyat seviyelerini ve yüksek olasılıklı dönüş bölgelerini olağanüstü bir hassasiyetle tespit eden gelişmiş ve çok yönlü bir araçtır. Piyasadaki her tick hareketini sürekli analiz ederek alım ve satım baskısındaki önemli değişimleri belirler ve grafikte net Alış/Satış oklarını anında gösterir — varsayılan olarak görünür, böylece hemen harekete geçebilirsiniz.
Cumulative Volume Delta MAX MTF Pro v4.4 — Hacim Tabanlı İşlemlerde Nihai Avantaj Tümüne Hükmedecek Tek Gösterge: Piyasanın GERÇEKTE ne düşündüğünü görün Tahmin yürütmeyi bırakın ve fiyat hareketlenmeden önce kurumsal oyuncuların ne yaptığını bilmeye başlayın. CVD MAX MTF Pro v4.4, karmaşık verileri net ve uygulanabilir sinyallere dönüştüren hacim analizi teknolojisinin zirvesini temsil eder. Bu versiyon, fiyat hareketlerini yönlendiren gizli güçleri her zamankinden daha hassas bir şekilde ortay
Buy Sell Smart
Syamsurizal Dimjati
BUY and SELL smart The BUY and SELL Smart Indicator is a next-generation trading tool engineered for precision scalpers, intraday strategists, and professional analysts who demand both speed and clarity in market visualization. It seamlessly integrates smart candle-based analytics, adaptive ATR logic, and real-time economic event awareness — giving you a fully synchronized view of market volatility and momentum. Through an elegant and optimized interface, FlashScalp delivers   instant signal fee
Phantom Edge SMC
Nattapon Chuekamhod
Phantom Edge SMC — The Ultimate Smart Money Indicator for MT5 Tired of manually drawing structures while trading SMC or ICT concepts? Let Phantom Edge SMC do the heavy lifting for you. Key Features Internal & Swing Structure: Automatically detects BOS and CHoCH across two structural levels. Order Blocks (OB): Identifies Internal and Swing OBs with automated mitigation tracking. Equal Highs / Lows: Highlights EQH / EQL to pinpoint Liquidity pools. Fair Value Gaps (FVG): Displays FVGs with
Turkish Bu indikatör, Grafik Formasyonları (Chart Patterns) ile işlem yapmayı seven yatırımcılar için gelişmiş bir grafik analiz asistanı olarak işlev görür. Görsel analiz yükünü azaltmak ve kâr elde etmede doğruluğu artırmak için tasarlanmıştır. Pratik kullanım açısından bu indikatörün temel özellikleri: 1. Otomatik Formasyon Tespiti (Automated Pattern Detection) Zaman kazandırır ve önyargıyı (Bias) azaltır: Trend çizgilerini manuel olarak çizmenize gerek kalmaz. İndikatör, fiyat dalgalanmaları
Institutional Flow Dashboard is a comprehensive technical analysis tool that combines two powerful methodologies: Volume Profiling and Relative Currency Strength . This all-in-one interface is designed to help traders identify high-liquidity price levels and market momentum in real-time. Key Features: Volume Profile Analysis: Visualizes the distribution of volume across price levels, identifying the Point of Control (POC) and Value Area (VA) . Multi-Currency Strength Meter: Analyses 8 major curr
Intraday Vwap Orion
Joao Paulo Botelho Silva
Theory VWAP is a volume-weighted moving average, bringing greater relevance to prices. The VWAP base calculation follows the classic formula described in Investopedia ( https://www.investopedia.com/terms/v/vwap.asp ). VWAP = sum(typical price[i]*volume[i]) / sum(volume[i]) Functionalities Orion Intraday VWAP innovates by allowing the user to choose between the conventional Daily, Weekly and Monthly periods, also having the option of calculating the Intraday indicator, as used in other platform
Bu ürünün alıcıları ayrıca şunları da satın alıyor
Divergence Bomber
Ihor Otkydach
4.9 (87)
Bu göstergeyi satın alan herkese aşağıdaki ekstra içerikler ücretsiz olarak sunulmaktadır: Her işlemi otomatik olarak yöneten, Stop Loss ve Take Profit seviyelerini ayarlayan ve işlemleri strateji kurallarına göre kapatan özel yardımcı araç: "Bomber Utility" Göstergenin farklı varlıklar üzerinde kullanılmasına yönelik ayar dosyaları (set dosyaları) Bomber Utility için 3 farklı modda kullanım sunan ayar dosyaları: "Minimum Risk", "Dengeli Risk" ve "Bekle-Gör Stratejisi" Bu ticaret stratejisini hı
Grabber System MT5
Ihor Otkydach
4.83 (23)
Size mükemmel bir teknik gösterge olan Grabber’ı tanıtıyorum. Bu araç, kullanıma hazır bir “her şey dahil” işlem stratejisi olarak çalışır. Tek bir yazılım kodu içinde güçlü piyasa teknik analiz araçları, işlem sinyalleri (oklar), uyarı işlevleri ve push bildirimleri entegre edilmiştir. Bu göstergeyi satın alan herkes aşağıdaki hediyeleri ücretsiz olarak alır: Açık emirleri otomatik yönetmek için Grabber Yardımcı Aracı Kurulum, yapılandırma ve nasıl işlem yapılacağını adım adım anlatan video kıl
SignalTech MT5 is a trading system for EURUSD, USDCHF, USDJPY, AUDUSD, NZDUSD, EURJPY, AUDJPY, NZDJPY, CADJPY H2 and H3 Timeframe.  It can generate signals with Buy/Sell Arrows and Pop-Up/Sound Alerts. Each signal has clear Entry and Stop Loss levels, which should be automatically flagged on the chart, as well as potential Targets 1, 2, and 3. The Entry and TP levels are fixed after the trade is taken. The exit level is dynamic. If there are signs of a potential short-term trend reversal, the
Btmm state engine pro
Garry James Goodchild
5 (4)
BTMM State Engine Pro is a MetaTrader 5 indicator for traders who use the Beat The Market Maker approach: Asian session context, kill zone timing, level progression, peak formation detection, and a multi-pair scanner from a single chart. It combines cycle state logic with a built-in scanner dashboard so you do not need the same tool on many charts at once. What it does Draws the Asian session range; session times can follow broker server offset or be set in inputs. Tracks level progression (L
Tanıtım       Quantum Breakout PRO   , Breakout Bölgeleri ile ticaret yapma şeklinizi değiştiren çığır açan MQL5 Göstergesi! 13 yılı aşkın ticaret tecrübesine sahip deneyimli tüccarlardan oluşan bir ekip tarafından geliştirilmiştir.       Kuantum Breakout PRO       yenilikçi ve dinamik koparma bölgesi stratejisiyle ticaret yolculuğunuzu yeni zirvelere taşımak için tasarlanmıştır. Kuantum Breakout Göstergesi, size 5 kar hedefi bölgesi ile kırılma bölgelerinde sinyal okları ve kırılma kutusuna da
Top indicator for MT5   providing accurate signals to enter a trade without repainting! It can be applied to any financial assets:   forex, cryptocurrencies, metals, stocks, indices .  Watch  the video  (6:22) with an example of processing only one signal that paid off the indicator! MT4 version is here It will provide pretty accurate trading signals and tell you when it's best to open a trade and close it. Most traders improve their trading results during the first trading week with the help of
Quantum TrendPulse
Bogdan Ion Puscasu
5 (23)
SuperTrend   ,   RSI   ve   Stochastic'in   gücünü tek bir kapsamlı göstergede birleştirerek işlem potansiyelinizi en üst düzeye çıkaran nihai işlem aracı olan   Quantum TrendPulse'u   tanıtıyoruz. Hassasiyet ve verimlilik arayan yatırımcılar için tasarlanan bu gösterge, piyasa trendlerini, momentum değişimlerini ve en uygun giriş ve çıkış noktalarını güvenle belirlemenize yardımcı olur. Temel Özellikler: SuperTrend Entegrasyonu:   Güncel piyasa trendlerini kolayca takip edin ve karlılık dalgası
Azimuth Pro
Ottaviano De Cicco
5 (7)
Azimuth Pro V2: Synthetic Fractal Structure and Confirmed Entries for MT5 Overview Azimuth Pro is a multi-level swing structure indicator by Merkava Labs . Four nested swing layers, swing-anchored VWAP, ABC pattern detection, three-timeframe structural filtering, and closed-bar confirmed entries — one chart, one workflow from micro-swings to macro-cycles. This is not a blind signal product. It is a structure-first workflow for traders who care about location, context, and timing. V2 Launch Offe
OmniSync Projection
Antonio-alin Teculescu
5 (1)
Chronos Fractal Engine is an innovative price projection indicator for MetaTrader 5, designed to transform your technical analysis by intelligently identifying and projecting historical price patterns. Built upon an advanced correlation algorithm and the fractal principles of the market, this powerful tool visualizes potential future price movements, giving you a unique edge in your trading decisions. What is Chronos Fractal Engine? At its core, the Chronos Fractal Engine employs a sophisticat
RelicusRoad Pro: Kantitatif Piyasa İşletim Sistemi ÖMÜR BOYU ERİŞİMDE %70 İNDİRİM (SINIRLI SÜRE) - 2.000+ TRADER'A KATILIN Neden çoğu trader "mükemmel" indikatörlere rağmen başarısız olur? Çünkü tekil kavramları boşlukta trade ederler. Bağlamı olmayan bir sinyal kumardır. Sürekli kazanmak için KONFLÜANS (UYUM) gerekir. RelicusRoad Pro basit bir ok indikatörü değildir. Tam bir Kantitatif Piyasa Ekosistemi dir. Tescilli volatilite modellemesini kullanarak fiyatın ilerlediği "Adil Değer Yolu"nu har
Bill Williams Advanced
Siarhei Vashchylka
5 (11)
Bill Williams Advanced is designed for automatic chart analysis using Bill Williams' "Profitunity" system. The indicator analyzes four timeframes at once. Manual (Be sure to read before purchasing) Advantages 1. Analyzes the chart using Bill Williams' "Profitunity" system. Signals are displayed in a table in the corner of the screen and on the price chart. 2. Finds all known AO and AC signals, as well as zone signals. Equipped with a trend filter based on the Alligator. 3. Finds "Divergence Bar
ARICoins
Temirlan Kdyrkhan
ARICoin is a powerful trading companion designed to generate high-probability entry signals with dynamic TP/SL/DP levels based on volatility. Built-in performance tracking shows win/loss stats, PP1/PP2 hits, and success rates all updated live. Key Features: Buy/Sell signals with adaptive volatility bands Real-time TP/SL/DP levels based on ATR Built-in MA Filter with optional ATR/StdDev volatility Performance stats panel (Success, Profit/Loss, PP1/PP2) Alerts via popup, sound, push, or email Cust
Advanced Supply Demand MT5
Bernhard Schweigert
4.53 (15)
Herhangi bir Acemi veya Uzman Tüccar için En İyi Çözüm! Bu gösterge benzersiz, yüksek kaliteli ve uygun fiyatlı bir ticaret aracıdır çünkü bir dizi tescilli özelliği ve yeni bir formülü bir araya getirdik. Bu güncelleme ile çift zaman dilimi dilimlerini gösterebileceksiniz. Yalnızca daha yüksek bir TF gösteremeyeceksiniz, aynı zamanda TF grafiğini ve ARTIK daha yüksek TF'yi de gösterebileceksiniz: YUVARLAK BÖLGELERİ GÖSTERMEK. Tüm Arz Talebi tüccarları buna bayılacak. :) Önemli Bilgiler Açıkland
Gartley Hunter Multi
Siarhei Vashchylka
5 (11)
Gartley Hunter Multi - An indicator for searching for harmonic patterns simultaneously on dozens of trading instruments and on all possible timeframes. Manual (Be sure to read before purchasing) | Version for MT4 Advantages 1. Patterns: Gartley, Butterfly, Shark, Crab. Bat, Alternate Bat, Deep Crab, Cypher 2. Simultaneous search for patterns on dozens of trading instruments and on all possible timeframes 3. Search for patterns of all possible sizes. From the smallest to the largest 4. All fou
META Points PRO MT5
Polina Balahura
5 (1)
META Puanları PRO   — Piyasa hareketlerini takip eden ve alım satım işlemlerinde tahmini ortadan kaldıran, piyasanın kararını çoktan vermiş olduğu noktaları gösteren bir araçtır. Bu gösterge, trendlerin, eğilimlerin ve yapıların değiştiği kilit noktaları belirler ve fiyatın büyük oyuncuların pozisyon alması için geri döndüğü alanları vurgular. Sadece hareketi görmüyorsunuz, arkasındaki mantığı da anlıyorsunuz. Tüm sinyaller mum çubuğu kapandıktan sonra kaydedilir, yeniden çizilmez ve grafiğe kay
" Dynamic Scalper System MT5 " göstergesi, trend dalgaları içinde işlem yapmak için scalping yöntemi için tasarlanmıştır. Başlıca döviz çiftleri ve altın üzerinde test edilmiştir, diğer işlem araçlarıyla uyumluluğu mümkündür. Ek fiyat hareketi desteğiyle trend boyunca pozisyonların kısa vadeli açılması için sinyaller sağlar. Göstergenin prensibi. Büyük oklar trend yönünü belirler. Küçük oklar şeklinde scalping için sinyaller üreten bir algoritma trend dalgaları içinde çalışır. Kırmızı oklar yü
Meravith MT5
Ivan Stefanov
5 (1)
Göstergе, herhangi bir noktadan hacmi analiz eder ve bu hacim için piyasanın tükeniş seviyelerini hesaplar. Meravith’in ana çizgileri: Boğa hacim tükeniş çizgisi – hedef olarak kullanılır. Ayı hacim tükeniş çizgisi – hedef olarak kullanılır. Trend çizgisi – piyasa trendini gösterir. Piyasanın boğa mı ayı mı olduğuna bağlı olarak rengi değişir ve trend desteği görevi görür. Nasıl kullanılır: Mor dikey çizgiye çift tıklayın ve istediğiniz konuma taşıyın. Her şeyi analiz edebilirsiniz – trendleri v
Berma Bands
Muhammad Elbermawi
5 (8)
Berma Bantları (BB'ler) göstergesi, piyasa trendlerini belirlemeyi ve bunlardan yararlanmayı amaçlayan yatırımcılar için değerli bir araçtır. Fiyat ile BB'ler arasındaki ilişkiyi analiz ederek, yatırımcılar bir piyasanın trend veya aralıklı fazda olup olmadığını ayırt edebilir. Daha fazla bilgi edinmek için [ Berma Home Blog ] adresini ziyaret edin. Berma Bantları üç belirgin çizgiden oluşur: Üst Berma Bandı, Orta Berma Bandı ve Alt Berma Bandı. Bu çizgiler fiyatın etrafına çizilir ve genel tren
Öncelikle, bu Ticaret Aracının Non-Repainting, Non-Redrawing ve Non-Lagging Gösterge olduğunu vurgulamakta fayda var, bu da onu profesyonel ticaret için ideal hale getiriyor. Çevrimiçi kurs, kullanıcı kılavuzu ve demo. Akıllı Fiyat Hareketi Kavramları Göstergesi, hem yeni hem de deneyimli tüccarlar için çok güçlü bir araçtır. İleri ticaret fikirlerini, Inner Circle Trader Analizi ve Smart Money Concepts Ticaret Stratejileri gibi 20'den fazla kullanışlı göstergeyi bir araya getirerek bir araya
RFI levels PRO MT5
Roman Podpora
3.67 (3)
Bu gösterge, fiyat dönüş noktalarını ve fiyat geri dönüş bölgelerini doğru bir şekilde gösterir.       Başlıca oyuncular   . Yeni trendlerin nerede oluştuğunu görüyorsunuz ve her işlem üzerinde kontrolü elinizde tutarak, azami hassasiyetle kararlar alıyorsunuz. TREND LINES PRO   göstergesiyle birlikte kullanıldığında maksimum potansiyelini ortaya koyar.  VERSION MT4 Göstergenin gösterdiği şey: Yeni bir trendin başlangıcında aktivasyonla birlikte tersine dönüş yapıları ve tersine dönüş seviyeler
KT Alpha Hunter Arrows MT5
KEENBASE SOFTWARE SOLUTIONS
Çoğu ok göstergesi size yalnızca bir sinyal verir ve geri kalan her şeyi sizin çözmenizi bekler. KT Alpha Hunter Arrows ise size tam bir işlem planı sunar. Her sinyal oku, hazır çizilmiş tam bir planla birlikte görünür: giriş çizgisi, stop loss, dört take profit seviyesi ve bu sembol ile zaman diliminin o anda işlem yapmaya değer olup olmadığını gösteren canlı edge değerlendirmesi. Dahil edilen Trade Manager EA, siz işleme girdikten sonra yönetimi üstlenir. Böylece piyasa gürültülü ve stresli ha
CGE Trading Suite
Carl Gustav Johan Ekstrom
5 (2)
Institutional-Grade Analytics for MT5 C GE Trading Suite delivers the analytical edge typically reserved for professional trading desks. The platform integrates a full suite of analytical tools into one seamless workflow: dynamic grid mapping, liquidity behavior analysis, ECM, trend lines, MIDAS, trade cycles, and directional channel projections. Together, these provide a unified view of market structure and momentum. Directional clarity is further enhanced by the capital flow index, which meas
PZ Day Trading MT5
PZ TRADING SLU
2.83 (6)
Effortless trading: non-repainting indicator for accurate price reversals This indicator detects price reversals in a zig-zag fashion, using only price action analysis and a donchian channel. It has been specifically designed for short-term trading, without repainting or backpainting at all. It is a fantastic tool for shrewd traders aiming to increase the timing of their operations. [ Installation Guide | Update Guide | Troubleshooting | FAQ | All Products   |  Get Help ] Amazingly easy to tr
Route Lines Prices MT5 , potansiyel işlem sinyallerini bulmak için tasarlanmış bir göstergedir. Basit arayüzü, birden fazla fiyat davranışı algoritmasının yanı sıra sinyal uç noktası tespiti ve tamamlanmış yörüngelerin hesaplamalarını içerir. Algoritmalar, kullanılan zaman dilimlerine bağlı olarak volatilite ve fiyat düzeltme hesaplamalarını içerir. Göstergenin değerlerini değiştirmek için birincil bir parametresi vardır: " Calculating price values ." Varsayılan 1 değeri, dengeli bir otomatik h
AriX
Temirlan Kdyrkhan
1 (4)
AriX Indicator for MT5 A powerful trend-following and signal-evaluation tool AriX is a custom MT5 indicator that combines Moving Averages and ATR-based risk/reward logic to generate clear buy/sell signals. It visualizes dynamic SL/TP levels, evaluates past trade outcomes, and displays win/loss statistics in a clean on-chart panel. Key features include: Buy/Sell signals based on MA crossovers ATR-based SL/TP1/TP2/TP3 levels with visual lines and labels Signal outcome tracking with real-time stat
Weltrade Spike Sentinel
Batsirayi L Marango
5 (1)
Introducing Indicator for PainX and GainX Indices Traders on Weltrade Get ready to experience the power of trading with our indicator, specifically designed for Weltrade   broker's PainX and GainX Indices.  Advanced Strategies for Unbeatable Insights Our indicator employs sophisticated strategies to analyze market trends, pinpointing optimal entry and exit points.  Optimized for Maximum Performance To ensure optimal results, our indicator is carefully calibrated for 5-minute timeframe charts on
TREND ÇİZGİLERİ PRO       Piyasanın gerçek yön değiştirdiği noktayı anlamaya yardımcı olur. Gösterge, gerçek trend dönüşlerini ve büyük oyuncuların piyasaya yeniden girdiği noktaları gösterir. Anlıyorsun   BOS hatları   Daha yüksek zaman dilimlerindeki trend değişiklikleri ve önemli seviyeler, karmaşık ayarlar veya gereksiz gürültü olmadan gösterilir. Sinyaller yeniden çizilmez ve çubuk kapandıktan sonra grafikte kalır. MT4 SÜRÜMÜ   -   RFI LEVELS PRO   göstergesiyle   birlikte kullanıldığında m
Stop guessing the market. Start trading mathematical probabilities with Machine Learning. The Titan NPC Pro (Neural Probability Channel) is not just another moving average or standard deviation band. It is a highly advanced institutional-grade indicator powered by a Kernel Regression Engine . By utilizing a Rational Quadratic Kernel function, the algorithm calculates the true "Fair Value" of the asset and plots dynamic probability boundaries to pinpoint exact Mean Reversion (Overbought/Oversold)
Ziva LSE System
Hassan Abdullah Hassan Al Balushi
ZIVA LSE System A Professional Liquidity & Structure Execution Framework Executive Overview ZIVA LSE System is a professionally engineered analytical framework designed to interpret market behavior through structural logic and liquidity dynamics. It is not positioned as a conventional indicator. Rather, it functions as a structured execution environment that organizes price action into a clear, disciplined decision-making model. The system is built to deliver consistency, clarity, and controlled
ICT PO3 (Power of 3) AMD Protocol Framework Indicator True Time & Structure Integration   |  Non-Repainting | Real-Time  | Multi-Asset  | MT4 Version Available Full Setup Guide & Strategy Playbook: https://www.mql5.com/en/blogs/post/768683 MT4 Version: https://www.mql5.com/en/market/product/171742 Indicator Overview The ICT PO3 AMD Protocol Framework is a complete structural overlay for MetaTrader 5 that maps the True Daily Cycle directly onto your lower-timeframe execution chart. It projects
Yazarın diğer ürünleri
QQE Kalman Hybrid  Smarter Trend Detection. Faster Entries. Cleaner Decisions. QQE Kalman Hybrid is built to help you act on what’s happening now. This momentum and trend confirmation indicator combines the proven structure of classic QQE logic with a modern Kalman adaptive engine designed to reduce lag, smooth noise, and surface high-quality trade opportunities earlier. The result is a clean, decision-focused tool that helps traders identify:  What’s the trend structure?  Where’s the best
FREE
T3 MTF PureMaths: Çoklu Zaman Dilimi Tillson T3 İndikatörü İnteraktif Panelli Sıfır Gecikmeli (Zero-Lag) Konfluans Ticaret Sistemi Çoklu Zaman Dilimi Analizinin Sağladığı Ticari Avantaj T3 MTF Pure Maths , Aylık grafiklerden 5 dakikalık grafiklere kadar 8 zaman dilimindeki piyasa yapısını eş zamanlı olarak bir araya getiren profesyonel düzeyde bir ticaret panelidir. Grafik değiştirmeye veya zihinden hesaplama yapmaya gerek kalmadan anlık ve uygulanabilir bilgiler sunar. Saf matematik optimizasy
The Ultimate Ichimoku MTF Dashboard: Your All-In-One Trading Edge Transform Your Trading with One Powerful Indicator Imagine having a professional trading assistant that monitors multiple timeframes simultaneously, identifies high-probability entries, warns you of potential reversals, and provides clear risk management guidance-all in one clean, intuitive display. That's exactly what the Ichimoku MTF Dashboard delivers.     Why This Isn't Just Another In
Cumulative Volume Delta MAX MTF Pro v4.4 — Hacim Tabanlı İşlemlerde Nihai Avantaj Tümüne Hükmedecek Tek Gösterge: Piyasanın GERÇEKTE ne düşündüğünü görün Tahmin yürütmeyi bırakın ve fiyat hareketlenmeden önce kurumsal oyuncuların ne yaptığını bilmeye başlayın. CVD MAX MTF Pro v4.4, karmaşık verileri net ve uygulanabilir sinyallere dönüştüren hacim analizi teknolojisinin zirvesini temsil eder. Bu versiyon, fiyat hareketlerini yönlendiren gizli güçleri her zamankinden daha hassas bir şekilde ortay
Cumulative Volume Delta (CVD) MA-X: Akıllı Emir Akışı Duyarlılık Aracı Cumulative Volume Delta (CVD) MA-X ile piyasanın gizli mekanizmalarını keşfedin. Standart hacim göstergeleri size yalnızca ne kadar işlem yapıldığını söylerken, CVD MA-X size alıcılar ve satıcılar arasındaki savaşı KİMİN , NE ZAMAN kazandığını söyler. Tick düzeyindeki fiyat hareketlerini ve hacim dağılımını bir araya getiren bu gösterge, piyasa inancı ve tükenmişliği hakkında kristal netliğinde bir harita sunar. İşlemcinin A
MTF Candlestick Patterns Detector: Nihai Price Action Komuta Merkeziniz Hızlı tempolu ticaret dünyasında, tek bir dönüş formasyonunu kaçırmak, kârlı bir hafta ile kaçırılmış bir fırsat arasındaki fark olabilir. MTF Candlestick Patterns Detector , tüm zaman dilimlerinde 24'ten fazla efsanevi mum çubuğu formasyonunu aynı anda taramak, tespit etmek ve bir araya getirmek için tasarlanmış profesyonel düzeyde bir MQL5 göstergesidir. Grafikler arasında avlanmayı ve tahmin yürütmeyi bırakın. Algoritman
MTF WAD Simplified Indicator - Professional Trading Solution     Overview The MTF WAD Simplified is a sophisticated multi-timeframe volume-based indicator designed to track smart money flow across financial markets. By monitoring the Williams Accumulation/Distribution (WAD) across 8 different timeframes, this tool provides traders with unprecedented insight into institutional accumulation and distribution patterns.     Core Benefits for Traders     1. Smart Money Tracking - Detect Institutional
TDI MTF: Comprehensive Market Sentiment & Trend Framework The TDI MTF  is a multi-layered (captures Trend, Channels, Oscillates, levels, multi-timeframe) technical indicator designed to provide a clear view of market structure. By combining RSI momentum with volatility analysis, it helps traders identify where price is relative to its "mean" and whether current momentum is sustainable. This tool is good for traders who want an  all-in-one separate window to filter out market noise and focus on h
FREE
Critical Market Session Information with a Single Glance Stop juggling multiple tools and squinting at time zone converters. The SessionInfoDisplay Indicator is your new, indispensable trading co-pilot that puts real-time market intelligence directly on your chart.   What It Does: Your Essential Trading Dashboard   This intelligent indicator provides three critical pieces of information at a glance: 1. Real-Time Session Detection    - Automatically identifies which major financial session is act
FREE
RSI v SMA MTF Indicator : Professional Trading Edge in One Tool   Summary The RSI v SMA MTF Indicator is a sophisticated, multi-timeframe momentum analysis tool that transforms the traditional RSI into a powerful, actionable trading system. By combining RSI slope analysis with SMA crossover signals, divergence detection, and real-time multi-timeframe confluence, this indicator provides traders with a more comprehensive view of market momentum across all relevant timeframes.     Core Utility an
Clr-Dynamic RSI v SMA Indicator: A Comprehensive Analysis of Features and Advantages The Clr-Dynamic RSI v SMA indicator represents a significant evolutionary leap in technical analysis tools, transforming the classic Relative Strength Index (RSI) from a potentially ambiguous oscillator into a sophisticated, multi-dimensional trading system. At its core, this indicator retains the mathematical foundation of the RSI, measuring the speed and change of price movements, but radically enhances its
Indicator Overview This is a sophisticated Multi-Timeframe (MTF) indicator that not only applies the classic Fisher Transform formula but integrates it into a comprehensive trading system featuring a real-time dashboard. The indicator excels at pinpointing reversals through advanced divergence detection and providing a clear, multi-timeframe view of market structure.     How It Works: Core Fisher Logic   1.   Normalization and Signal Generation         The indicator transforms price (using med
MTF Connecting Fractals Multi-Timeframe Market Structure. One Glance. Real Decisions. MTF Connecting Fractals is not just another arrow-printing indicator. It’s a complete multi-timeframe market structure intelligence system designed to answer the most important trading questions in real time - clearly, visually, and without clutter. Built around fractals as objective structure anchors, this tool gives traders a decisive edge by combining price action, structural context, proximity risk, and
Multi-Timeframe Money Flow Index (MTF MFI) with Smart Divergence and Dashboard Unlock the flow of institutional money across every timeframe. Are you tired of guessing the trend only to be trapped by a sudden reversal? The Multi-Timeframe Money Flow Index (MTF MFI) is a professional-grade trading tool designed to provide a bird's-eye view of market liquidity and momentum. By aggregating volume-weighted data from W1 down to M1, this indicator eliminates noise and highlights high-probability tra
MTF Parabolic SAR Maximize your trading efficiency with the Multi-Timeframe Parabolic SAR Trend and Momentum Dashboard. Designed for serious traders who value clarity over clutter, this tool aggregates price action across six timeframes into a single, sleek visual interface.  By combining that reliable classic Parabolic SAR logic with advanced momentum scoring and risk assessment, this indicator transforms raw data into actionable trade signals.  The Strategic Edge: Why This Indicator? Most tra
Multi-Timeframes Heiken Ashi Dashboard : The Trend is your Friend Indeed Confluence Trading System     Transform Your Trading with Crystal-Clear Market Structure Visualization Tired of confusing charts and conflicting signals? The Multi-Timeframe Heiken Ashi Dashboard is your complete solution for professional-grade market analysis. This all-in-one indicator combines smoothed Heiken Ashi candles with an intelligent multi-timeframe panel to give you unprecedented clarity in any market condition
Hybrid BB-LRMA [Trend and Volatility Engine]   Master the markets with the Hybrid BB-LRMA, a professional-grade technical analysis tool that fuses the volatility-tracking power of Bollinger Bands (BB) with the hyper-responsive Linear Regression Moving Average (LRMA) to eliminate lag and pinpoint high-probability entries with arrow Signals   Why Hybrid BB-LRMA? Most moving averages are too slow, and Bollinger Bands alone can be noisy. The Hybrid BB-LRMA solves this by using a gradient-based LRMA
Hybrid FATL Fractal: Professional Digital-Signal Logic   Simplify the Complexity of Market Structure.   Unlock the power of digital signal processing combined with price action geometry. The Hybrid FATL Fractal is a professional-grade technical analysis tool designed to eliminate market noise and pinpoint high-probability institutional turning points. By merging the Fast Adaptive Trend Line (FATL) algorithm with Dynamic Fractal Breakout logic, this indicator provides a dual-layered filter that a
VOLUME PROFILE SAF-XII                            Professional Market Profile Analysis for MT5           WHAT IS VOLUME PROFILE? Volume Profile is a professional institutional tool that displays trading activity at specific price levels, unlike traditional volume indicators that show volume over time. It reveals WHERE trading occurred, within your window of choice, helping identify:   • FAIR VALUE AREAS (VAH/VAL) - Price levels where most trading occurred • POINT OF CONTROL (POC) - The
Fisher Transform MTF Pro v4.03 Professional Multi-Timeframe Trading Decision System Fisher Transform MTF Pro turns complex multi-timeframe data into clear, actionable trade decisions in seconds. It answers instantly:  What’s the trend?  Where’s the entry?  How strong is the setup?  What are the risks?  Should I buy, sell, or wait?  The Edge   Zero-Line Filter (Trend Protection) Prevents counter-trend trades by default:  No buys above zero  No sells below zero This forces alignment with th
Turtles Professional v2.0 The Legendary Turtle Strategy, Reimagined for the Modern Trader Turtles Pro transforms the iconic 1980s Turtle Trading System into a high-performance, multi-timeframe decision engine. It eliminates guesswork by providing institutional-grade analysis on trend structure, entry quality, and volatility all on a single chart. The Strategic Edge Turtles Professional uses a Smart Weighted Bias Engine to prioritize higher time frames, ensuring your trades align with the d
Hybrid Hull-LSMA : The Trend Meets Momentum Powerhouse Are you struggling with moving averages that are either too slow to react or too noisy to trust? The Hybrid Hull-LSMA is a solution, engineered to solve the "lag vs. noise" dilemma. By fusing the ultra-smooth Hull Moving Average (HMA) with the predictive Least Squares Moving Average (LSMA), this indicator delivers a high-definition view of market structure and entry timing. Why the Hybrid Hull-LSMA? Standard indicators follow the market; t
Divergent Fisher Transform MT5  Precision Momentum. Intelligent Filtering. EA-Ready Automation. The Divergent Fisher Transform for MT5 is a professional-grade momentum trading indicator designed to help traders answer the most important question in the market: “What should I do right now?” It transforms raw price into high-probability, structured trading decisions using a powerful combination of:  Fisher Transform momentum modeling  Zero-line structural filtering  Multi-level overbought/o
Divergent Stochastic Filter II Catch Reversals Early, Filter Noise, Trade with Confidence The Edge: Why This Stochastic is Different  Every trader knows the Stochastic oscillator. But knowing when to trust its signals, that's the real challenge. The Divergent Stochastic Filter II transforms this classic indicator into a precision reversal detection system by adding critical elements: divergence intelligence, signal filtering and exhaustion detection.  While standard Stochastic oscillators fire s
Cumulative Volume Delta (CVD) MA-X Plus: Nihai Order Flow Çerçevesi CVD MA-X Plus ile piyasanın gizli mekanizmalarını ortaya çıkarın. Standart hacim göstergeleri size sadece ne kadar işlem yapıldığını söylerken, CVD MA-X Plus savaşı kimin kazandığını, ne zaman kazandığını ve "akıllı paranın" (smart money) nerede konumlandığını söyler. Tick düzeyinde fiyat hareketlerini (Hisse Senetleri/Vadeli İşlemler/Altın gibi düzenlenmiş piyasalarda Gerçek Hacim'e ayarlanabilir) ve çok katmanlı hacim dağılımı
Hybrid FATL-LRMA : Digital Precision Meets Statistical Certainty The Ultimate Trend-Momentum Convergence System with clear action protocols. Why Hybrid FATL-LRMA? The Edge some Traders Miss Are you tired of lagging indicators that signal entries after the move has already happened? Frustrated by noisy oscillators that keep you in chop while trends pass you by? The Hybrid FATL-LRMA is a dual-engine trading system that bridges the gap between high-frequency digital signal processing and stat
ADX ClrDynamic: The Gradient-Aware, Low-Lag Trend and Momentum ADX/DMI Evolution Tired of lagging indicators that signal a trend only after the move is over? Most ADX indicators are too slow for modern markets. ADX Gradient-Aware solves this by fusing Hull-style low-lag smoothing with a unique Gradient Momentum Logic. This isn't just an indicator; it's a complete decision-engine that identifies trend structure, measures strength, and pinpoints high-probability entries using dual-slope detection.
ADX ClrDynamic  MTF Dashboard: The Ultimate Multi-Timeframe Trend and Momentum Command Center Tired of switching between timeframes to get the full market picture? Most ADX indicators show you only one timeframe at a time, forcing you to piece together the puzzle manually.   ADX ClrDynamic MTF indicator   changes everything by displaying up to 8 timeframes simultaneously in a single, elegant dashboard. This isn't just an indicator; it's your complete multi-timeframe decision-engine that identifi
SERA - Sigma-Enhanced Regression Analysis – The Non-Repaint, Early-Entry MTF Trading System The Problem with Most Regression Tools (And How We Solved It) Traditional regression indicators lie to you. They repaint, they lag, and distort actionable data. Their flaws cost you in false back-tests, late entries/exits and therefore missed profits. Avoid catching a falling knife or chasing a train with SERA, she eliminates ALL three problems. One-Click Trading Style Selection – Choose Conservative, R
Streamlined Tri-Color Band Logic prioritizes price action visibility while maintaining the Squeeze detection. 1.The Philosophy Switch: Trade Your Way The   SignalMode   setting lets you choose how the indicator reads band touches. Think of it as your trading personality: When Price Hits The... BREAKOUT Mode (You're a Trend Trader) BOUNCE Mode (You're a Reversal Hunter) AUTO Mode (You Want Both) Upper Band   BUY   – "Momentum is accelerating, ride it!"   SELL   – "Price is stretched, time
Filtrele:
Değerlendirme yok
Değerlendirmeye yanıt