Quant Lab
- Göstergeler
- Sürüm: 1.0
- Etkinleştirmeler: 5

Quant Lab — Genetic Strategy Builder for MetaTrader 5
What Quant Lab Is
Quant Lab is a genetic-algorithm-driven strategy builder that runs directly on your MetaTrader 5 chart. Instead of hand-coding an Expert Advisor and guessing at parameters, you let an evolutionary search process discover a combination of entry logic, exit logic, a market filter, and a position-sizing rule that performs well on your chart's real historical data — then export that discovery as a standalone, compilable MQL5 EA.
Quant Lab doesn't invent trading ideas from nothing. It works from a defined set of building blocks and searches the space of ways to combine and parameterize them:
- Entry module — the signal that triggers a trade: MA Crossover, RSI Mean-Reversion, Donchian Breakout, or Bollinger Band Reversion
- Exit module — how a trade closes: Fixed Stop-Loss/Take-Profit, Trailing Stop, Opposite-Signal, or Time-Based
- Filter module — an optional veto layer applied before any entry: None, Trend filter, or Volatility filter
- Money management module — position sizing that scales with your account balance (compounding), with an evolved cap to prevent runaway sizing
Each candidate strategy is a "chromosome" made of one gene from each of those four modules, plus that module's specific parameters (periods, thresholds, point distances). The genetic algorithm doesn't test every possible combination — it evolves toward good ones through selection, crossover, and mutation, the same way biological evolution favors traits that work.
Step-by-Step: How to Use It
1. Attach it to the right chart. Open the exact symbol and timeframe you actually intend to trade live. Quant Lab pulls real price data directly from this chart — it does not use synthetic or third-party data, so the chart you attach it to determines everything downstream.
2. Reload live data. Click "Reload Live Data." This pulls the number of bars set in InpHistoryBars (3000 by default) directly from the chart via CopyClose / CopyHigh / CopyLow . The dashboard's "Source" label will show you the exact date range loaded — note this range, because you'll need it later to validate results.
3. Review your GA settings before running. Key inputs:
- InpPopulationSize / InpGenerations — bigger and longer search more thoroughly but take longer to run
- InpMinTrades — rejects any strategy that doesn't generate at least this many trades over the test window (protects against low-sample-size flukes)
- InpMaxDrawdownCap — rejects any strategy whose backtested drawdown exceeds this dollar figure
- InpAccountRef — the starting balance the GA assumes for compounding position sizing. Write this number down — you will need to set MetaTrader's Strategy Tester "Initial Deposit" to this exact figure later.
- InpSpreadPoints — set this to your actual broker's typical spread on this symbol. Underestimating spread makes the backtest look better than reality will be.
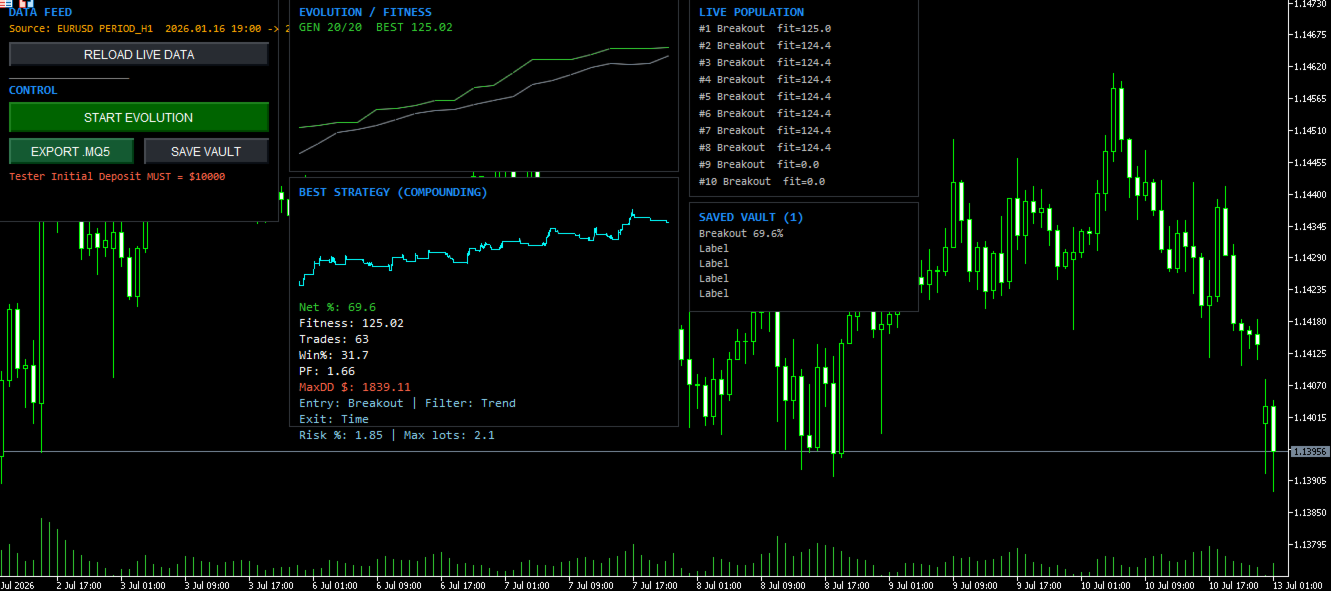
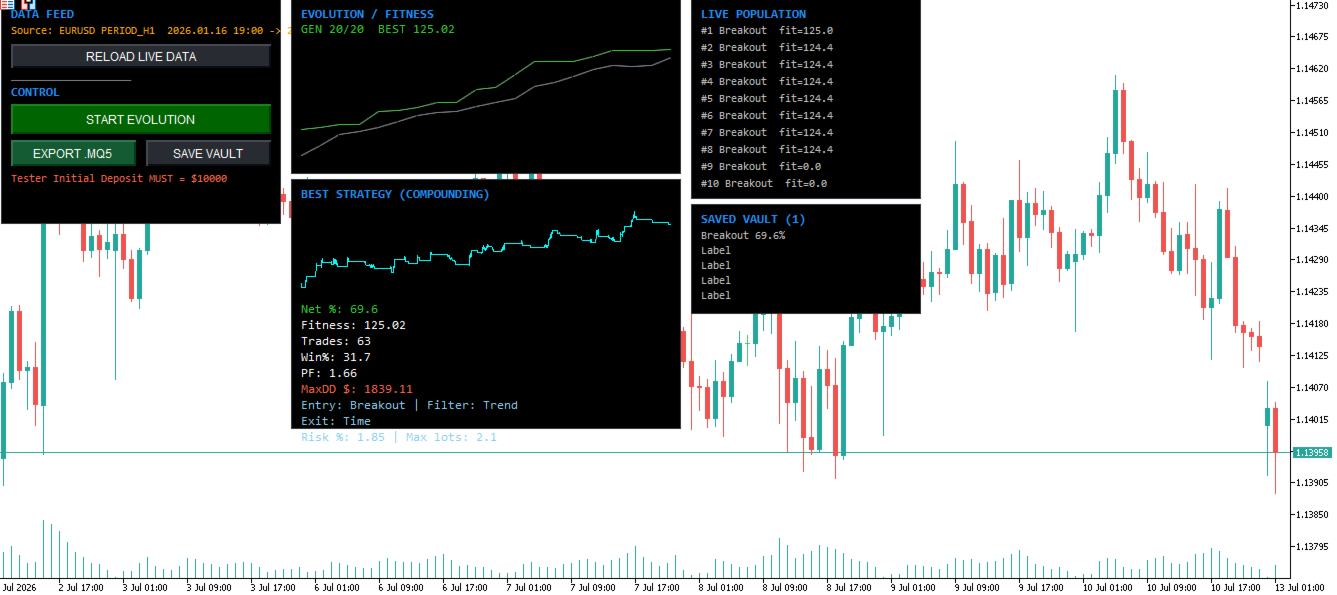
4. Click "Start Evolution." The dashboard updates live: the fitness chart shows the best and average fitness climbing generation by generation, and the "Live Population" panel shows the current top candidates. Let it run to completion — stopping early gives the algorithm less time to converge on a genuinely good combination.
5. Read the result. When evolution finishes, the "Best Strategy" panel shows the winning entry/exit/filter combination, its evolved parameters, and its backtested stats: net %, profit factor, win rate, max drawdown, and trade count. The equity curve chart shows the shape of that backtest.
6. Export the EA. Click "Export .MQ5." This writes a complete, standalone Expert Advisor to MQL5\Files\. Look for the name generated in the Expert Advisor section in toolbox and that is the name of the EA you will find in the IDE. You then open the code, copy it and paste it into a brand new indicator window, then compile it and this is your EA.
7. Compile and test. Open MetaEditor, navigate to the moved file, press F7 to compile, then open it in Strategy Tester.
How to Get the Closest Match Between Backtest and Live Results
This is the part most builders skip, and it's the difference between a strategy that "works" only in Quant Lab's dashboard versus one that behaves the same way when you actually run it.
- Match the symbol and timeframe exactly. The strategy was evolved on one specific chart. Attaching the exported EA to a different symbol or timeframe means it's trading against different price behavior than what it was optimized for.
- Match the date range. Quant Lab prints the exact bar range it evolved against (visible on the dashboard and in the Experts log). Set Strategy Tester's "From" and "To" dates to that same range for the most directly comparable test.
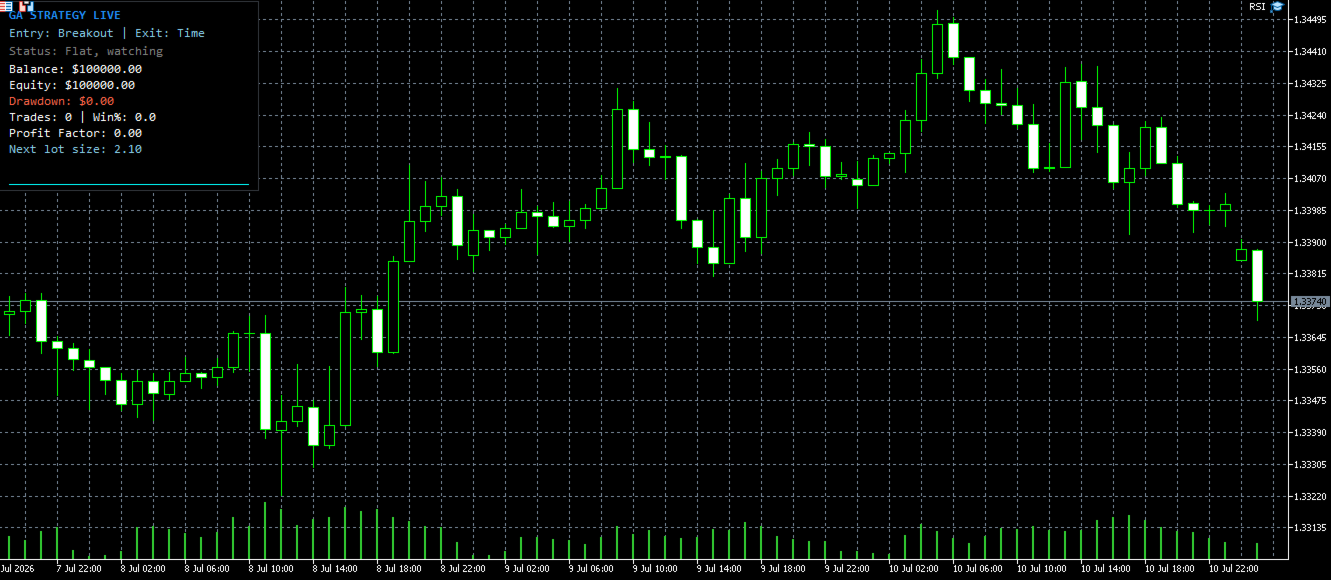
- Match the Initial Deposit. Because position sizing compounds off the account balance, Strategy Tester's starting deposit must equal InpAccountRef exactly. A mismatch here means every lot-size calculation from trade one onward will differ from what the GA scored — and because it compounds, that gap grows with every subsequent trade rather than staying constant. The generated EA checks this on startup and prints a warning to the Journal if the balance doesn't match.
- Use a tick model close to what the backtest assumed. Quant Lab's engine checks stop-loss/take-profit against each bar's high/low (a realistic intrabar fill), not just its close. In Strategy Tester, "1 Minute OHLC" or "Every tick based on real ticks" will get you closest to this; "Open prices only" will diverge more.
- Set your spread input honestly. If InpSpreadPoints doesn't reflect your broker's real typical spread on that symbol, the backtest cost model won't match what you actually pay live.
Why Results Will Still Vary — and Why That's Expected, Not a Bug
Even with all of the above matched exactly, don't expect the numbers to be bit-for-bit identical between Quant Lab's internal backtest, MetaTrader's Strategy Tester, and eventual live/demo trading. Several real, unavoidable sources of variation:
- Broker-to-broker differences. Spread, commission structure, swap rates, execution latency, and requote behavior all differ between brokers — sometimes significantly. A strategy evolved with a 20-point spread assumption will perform differently on a broker whose real spread is 8 points or 35 points.
- Tick data granularity. Strategy Tester's synthetic tick generation (used to simulate intrabar price movement between OHLC bars) is a statistical approximation, not a perfect reconstruction of what actually happened tick-by-tick in the real market. Two different tick-generation modes in the same tester can produce slightly different fills on the same bar.
- Slippage and requotes in live/demo trading, which no backtest — Quant Lab's or MetaTrader's — fully captures, since they depend on real-time liquidity conditions at the moment of execution.
- Lot-size rounding. Different brokers have different minimum lot steps and maximum position sizes; Quant Lab normalizes to your connected broker's actual volume constraints, but a strategy evolved on one broker's lot step will size very slightly differently on another.
None of this means the tool is broken — it means backtesting of any kind, on any platform, from any vendor, is a model of the market, not a recording of it. The goal of matching symbol/timeframe/date range/deposit isn't to eliminate variation, it's to reduce it to the irreducible minimum so you're comparing like-for-like as closely as the platform allows.
Further Optimization You Should Do Before Trusting a Result
Treat Quant Lab's first output as a candidate, not a finished product:
- Re-run evolution multiple times. Genetic algorithms involve randomness in initialization, mutation, and crossover — running the same settings twice can converge on different (sometimes very different) winning strategies. If a particular entry/exit combination keeps winning across several independent runs, that's a much stronger signal than a single lucky result.
- Check out-of-sample performance, not just the in-sample fitness score. A strategy that only looks good on the exact bars it was evolved against may be overfit to noise in that specific window. Test the exported EA on a date range outside what Quant Lab trained on.
- Vary the starting conditions. Try a longer or shorter InpHistoryBars window, a different population size, or a different symbol/timeframe entirely, and see whether similar strategy types keep emerging as winners — consistency across variations is more trustworthy than one strong run.
- Forward-test on a demo account before committing real capital. No backtest, however carefully matched, substitutes for watching the strategy trade in real market conditions with real (if simulated) fills over weeks or months.
- Understand what Quant Lab does not do. It runs a single in-sample/out-of-sample split. Further optimization should be done in strategy tester