KS Day Week MultitimeFrame Candle
- Göstergeler
- Sürüm: 1.13
- Etkinleştirmeler: 5

KS Day Week Multi TimeFrame (Yorumlarda ayrıca şu adla geçer: Period Box + Corner Multi-TF Live Candles)
Temel Amaç
Bu, yatırımcıların aşağıdaki bilgileri hızlıca görmelerine yardımcı olmak üzere tasarlanmış, görsel nitelikli bir çoklu zaman dilimi (multi-timeframe) bilgi ve bağlam göstergesidir:
Seçilen daha üst bir zaman dilimine ait güncel piyasa yapısı ve genel eğilim (renkli aralık/dönem kutuları aracılığıyla)
Grafiğin bir köşesinde derli toplu bir şekilde görüntülenen; dört önemli üst zaman dilimine (H4, D1, W1, MN1) ait mevcut canlı mum durumu
Özellikle, grafikler arasında geçiş yapmaya gerek kalmadan, üst zaman dilimlerine dair net bir piyasa bağlamı elde etmek isteyen ICT / SMC / arz-talep / kurumsal yatırımcılar arasında oldukça popülerdir. İki Ana Görsel Bileşen
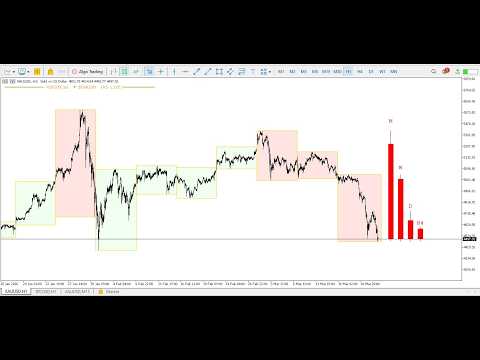
1. Dönem Kutuları (Daha Yüksek Zaman Dilimi Aralık Dikdörtgenleri)
Kullanıcı tarafından seçilen zaman diliminde, geriye doğru N dönemlik yarı saydam dikdörtgen kutular çizer.
Varsayılan zaman dilimi = W1 (haftalık); ancak H4, D1, W1, MN1 seçeneklerini tercih edebilirsiniz.
Kutu sayısı = InpLookback (varsayılan olarak geriye dönük 10 dönem)
Her bir kutunun gösterdiği bilgiler:
Kutu Bölümü | Anlamı | Görsel Stili | Tam Dikdörtgen | İlgili dönemin En Yüksek–En Düşük (High–Low) aralığı | Yarı saydam dolgu (varsayılan %85) | Dolgu Rengi (Yükseliş) | Kapanış ≥ Açılış | Açık yeşil (özelleştirilebilir) | Dolgu Rengi (Düşüş) | Kapanış < Açılış | Açık kırmızı / pembemsi (özelleştirilebilir) | Kenarlık | En Yüksek, En Düşük, Açılış zamanı ve Kapanış zamanı seviyelerinde ince çizgiler | Varsayılan olarak altın rengi, kalınlığı ayarlanabilir
En güncel (canlı) kutu, ayrıca ayrıntılı bir metin bilgi paneli de görüntüler (bu özellik kapatılabilir).
Bilgi paneli içerik örneği (Haftalık için):
2. Köşe Çoklu Zaman Dilimi Canlı Mumları (mini güncel mumlar)
Aşağıdaki zaman dilimlerine ait, henüz tamamlanmamış güncel barı temsil eden dört adet küçük canlı mum görüntüler:
H4
D1
W1
MN1
İki görüntüleme modu (InpPinToCorner parametresi ile kontrol edilir):
Mod | InpPinToCorner | Mumların Göründüğü Yer | En Uygun Kullanım Alanı | Köşeye Sabitlenmiş Mod | true | Sabit piksel konumu (sağ üst/sol köşe) | Temiz görünüm, grafik üzerinde karmaşa yaratmaz | Fiyat Seviyesinde Yüzen Mod | false | Gerçek fiyat seviyelerinde, gelecekteki barların üzerine yansıtılır | Tam güncel fiyat bağlamını görmek istendiğinde
Mini mumların görsel özellikleri:
Gövde = Güncel Açılış – Kapanış aralığı
Fitil = Güncel En Yüksek – En Düşük aralığı
Yeşil = Şu ana kadar yükseliş yönlü (bullish) mum
Kırmızı = Şu ana kadar düşüş yönlü (bearish) mum
Her mumun üzerinde veya yanında küçük bir etiket (H4 / D / W / M) bulunur
Temel Davranışsal Özellikler
Akıllı / verimli yeniden çizim — yalnızca fiyat veya daha yüksek zaman dilimi mumu gerçekten değiştiğinde güncellenir
Köşe mumlarını canlı tutmak ve kaydırma/yakınlaştırma işlemleri sırasında (özellikle sabitlenmiş modda) konumlarını doğru şekilde ayarlamak için bir zamanlayıcı (1 saniye) kullanır
Grafikten kaldırıldığında, kendisine ait tüm nesneleri temizler
Nesneler, artık ihtiyaç duyulmadığında silinmek yerine gizlenir (daha iyi performans sağlar)
Tipik Kullanım Senaryoları
Mevcut haftanın/ayın yükseliş mi yoksa düşüş yönlü mü olduğunu bir bakışta görmek
Hızlı çoklu zaman dilimi uyum kontrolü (H4 / Günlük / Haftalık / Aylık zaman dilimlerinin hepsi aynı yönü mü gösteriyor?) yön?)
Daha düşük zaman dilimlerinde işlem yaparken, daha yüksek zaman dilimi bağlamını görünür tutmak
Çok sayıda gösterge içermeyen, sade ve gösterge paneli tarzı grafik
Temel Amaç
Bu, yatırımcıların aşağıdaki bilgileri hızlıca görmelerine yardımcı olmak üzere tasarlanmış, görsel nitelikli bir çoklu zaman dilimi (multi-timeframe) bilgi ve bağlam göstergesidir:
Seçilen daha üst bir zaman dilimine ait güncel piyasa yapısı ve genel eğilim (renkli aralık/dönem kutuları aracılığıyla)
Grafiğin bir köşesinde derli toplu bir şekilde görüntülenen; dört önemli üst zaman dilimine (H4, D1, W1, MN1) ait mevcut canlı mum durumu
Özellikle, grafikler arasında geçiş yapmaya gerek kalmadan, üst zaman dilimlerine dair net bir piyasa bağlamı elde etmek isteyen ICT / SMC / arz-talep / kurumsal yatırımcılar arasında oldukça popülerdir. İki Ana Görsel Bileşen
1. Dönem Kutuları (Daha Yüksek Zaman Dilimi Aralık Dikdörtgenleri)
Kullanıcı tarafından seçilen zaman diliminde, geriye doğru N dönemlik yarı saydam dikdörtgen kutular çizer.
Varsayılan zaman dilimi = W1 (haftalık); ancak H4, D1, W1, MN1 seçeneklerini tercih edebilirsiniz.
Kutu sayısı = InpLookback (varsayılan olarak geriye dönük 10 dönem)
Her bir kutunun gösterdiği bilgiler:
Kutu Bölümü | Anlamı | Görsel Stili | Tam Dikdörtgen | İlgili dönemin En Yüksek–En Düşük (High–Low) aralığı | Yarı saydam dolgu (varsayılan %85) | Dolgu Rengi (Yükseliş) | Kapanış ≥ Açılış | Açık yeşil (özelleştirilebilir) | Dolgu Rengi (Düşüş) | Kapanış < Açılış | Açık kırmızı / pembemsi (özelleştirilebilir) | Kenarlık | En Yüksek, En Düşük, Açılış zamanı ve Kapanış zamanı seviyelerinde ince çizgiler | Varsayılan olarak altın rengi, kalınlığı ayarlanabilir
En güncel (canlı) kutu, ayrıca ayrıntılı bir metin bilgi paneli de görüntüler (bu özellik kapatılabilir).
Bilgi paneli içerik örneği (Haftalık için):
2. Köşe Çoklu Zaman Dilimi Canlı Mumları (mini güncel mumlar)
Aşağıdaki zaman dilimlerine ait, henüz tamamlanmamış güncel barı temsil eden dört adet küçük canlı mum görüntüler:
H4
D1
W1
MN1
İki görüntüleme modu (InpPinToCorner parametresi ile kontrol edilir):
Mod | InpPinToCorner | Mumların Göründüğü Yer | En Uygun Kullanım Alanı | Köşeye Sabitlenmiş Mod | true | Sabit piksel konumu (sağ üst/sol köşe) | Temiz görünüm, grafik üzerinde karmaşa yaratmaz | Fiyat Seviyesinde Yüzen Mod | false | Gerçek fiyat seviyelerinde, gelecekteki barların üzerine yansıtılır | Tam güncel fiyat bağlamını görmek istendiğinde
Mini mumların görsel özellikleri:
Gövde = Güncel Açılış – Kapanış aralığı
Fitil = Güncel En Yüksek – En Düşük aralığı
Yeşil = Şu ana kadar yükseliş yönlü (bullish) mum
Kırmızı = Şu ana kadar düşüş yönlü (bearish) mum
Her mumun üzerinde veya yanında küçük bir etiket (H4 / D / W / M) bulunur
Temel Davranışsal Özellikler
Akıllı / verimli yeniden çizim — yalnızca fiyat veya daha yüksek zaman dilimi mumu gerçekten değiştiğinde güncellenir
Köşe mumlarını canlı tutmak ve kaydırma/yakınlaştırma işlemleri sırasında (özellikle sabitlenmiş modda) konumlarını doğru şekilde ayarlamak için bir zamanlayıcı (1 saniye) kullanır
Grafikten kaldırıldığında, kendisine ait tüm nesneleri temizler
Nesneler, artık ihtiyaç duyulmadığında silinmek yerine gizlenir (daha iyi performans sağlar)
Tipik Kullanım Senaryoları
Mevcut haftanın/ayın yükseliş mi yoksa düşüş yönlü mü olduğunu bir bakışta görmek
Hızlı çoklu zaman dilimi uyum kontrolü (H4 / Günlük / Haftalık / Aylık zaman dilimlerinin hepsi aynı yönü mü gösteriyor?) yön?)
Daha düşük zaman dilimlerinde işlem yaparken, daha yüksek zaman dilimi bağlamını görünür tutmak
Çok sayıda gösterge içermeyen, sade ve gösterge paneli tarzı grafik