DynamicBreakoutBoxTrading

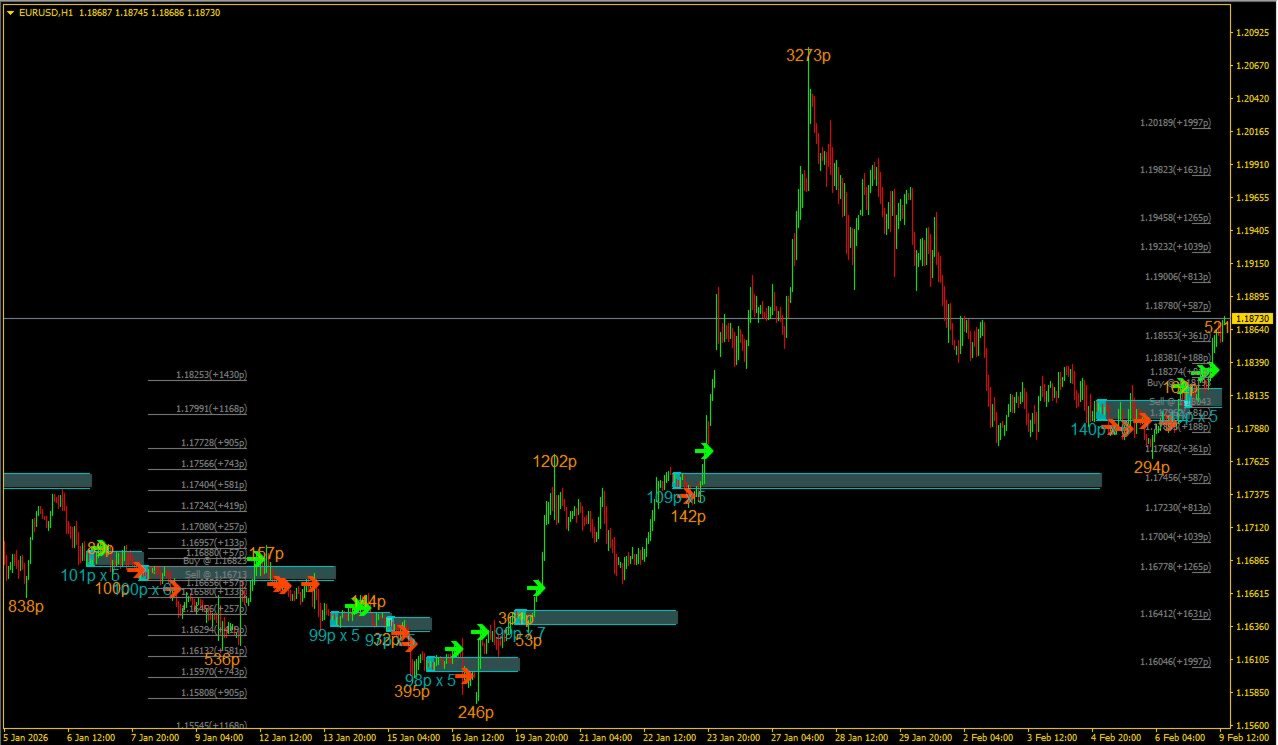
DynamicBreakoutBoxTrading is a professional breakout-box indicator for MetaTrader that automatically detects “congestion zones” (price compression ranges) and builds a breakout box around them. The box expands forward in time until price breaks out, then the indicator prints breakout levels, optional continuation box, take-profit projections, and trade-signal arrows.

The main goal is to provide a clean, objective structure for range → breakout → continuation workflows, suitable for both manual trading and EA integration via indicator buffers.

How the box is built (Core Logic)

  1. Choose the working timeframe for the box
    The box can be calculated on a dedicated timeframe ( BoxTimeFrame ) even if your chart is different.

  2. Detect a “congestion zone” dynamically
    The indicator searches for the minimal number of bars (but not less than the configured minimum) where the High–Low range remains below a specified threshold (Box Range).

  • If the range stays “small enough”, it is considered a congestion zone.

  • When the range grows beyond the threshold, the congestion zone ends.

  1. Breakout levels (BO lines) + buffer

  • The raw congestion zone edges define the breakout area.

  • BoxBufferPips  shifts breakout trigger lines away from the box edges for cleaner entries and fewer false breakouts.

  1. Breakout confirmation
    You can require N bars closed outside the breakout level before the signal is printed:

  • MinBarsClosedOutsideBO = 0  → signal immediately on first breakout

  • MinBarsClosedOutsideBO >= 1  → signal after N closes outside BO

  1. Targets (TP levels)
    Optional TP projections are displayed using:

  • Factor-based targets (multipliers of the box size), OR

  • Fixed pips targets (absolute pips from the entry)

The mode is automatically selected per TP using the  TP_is_pips_above  threshold (explained below).

Signals and EA usage

The indicator can print BUY/SELL arrows when breakout conditions are satisfied.
It also provides EA-ready buffers (via  iCustom ) so you can read signals programmatically.

Optional notifications:

  • Popup alert

  • Sound

  • Push notification

  • Email
    (with built-in cooldown protection to avoid alert spam)

Inputs (All Parameters Explained)

A) Box Detection

  • BoxLength
    Minimum congestion duration in “BoxTimeFrame bars”. Higher value → fewer but stronger boxes.

  • BoxTimeFrame
    Timeframe (in minutes) used to calculate boxes (e.g., 15 = M15). Set to 0 to use current chart timeframe.

  • BoxRange
    Congestion threshold (in pips). Smaller → tighter boxes, more frequent signals. Larger → wider boxes, fewer signals.

  • AutoBoxRange
    If true, the box size is calculated dynamically from Daily ATR instead of fixed  BoxRange .

  • AutoBoxRangeDailyATRperiod
    ATR period on D1 used for automatic range calculation.

  • AutoBoxRangeDailyATRfactor
    Multiplier applied to Daily ATR to obtain dynamic BoxRange (volatility-adaptive).

  • BoxBufferPips
    Distance (pips) between the real box edges and breakout trigger lines (BO lines). Helps filter noise.

  • DaysBack
    How many days of history to scan and draw boxes for.

B) Breakout Confirmation / Entry Logic

  • MinBarsClosedOutsideBO
    Number of fully closed bars that must close outside the breakout level to trigger a signal.
    0  = enter immediately on breakout.

C) Display / Panel / TP Levels

  • ShowDisplayPanel
    Shows/hides the information panel (if enabled in this build).

  • ShowTPLevels
    Enables TP projections on the chart.

  • ShowTPLevelsOnLastBoxOnly
    If true, TP levels are drawn only for the most recent box (cleaner chart).

  • TP1 … TP9
    Target values. Each TP can be interpreted in two ways (see  TP_is_pips_above  below).

  • TPLevelColor
    Color of TP/Fibo levels.

  • TP_is_pips_above
    Threshold that defines how TP values are interpreted:

    • If  TPx < TP_is_pips_above  → TPx is treated as a factor of box size (e.g., 0.618, 1.382, 2.618, etc.)

    • If  TPx >= TP_is_pips_above  → TPx is treated as fixed pips from entry (absolute pips target)

D) Signal Arrows (Visual)

  • BuySignalArrowCode / SellSignalArrowCode
    Wingdings arrow codes used for signals.

  • BuySignalArrowColor / SellSignalArrowColor
    Arrow colors.

E) Alerts / Notifications

  • SignalMail
    Send email on a new signal.

  • SignalAlert
    Show popup alert on a new signal.

  • SignalSound
    Play sound on a new signal.

  • SignalSoundFile
    Sound file name (e.g.,  alert.wav ) placed in the terminal sounds folder.

  • SignalPush
    Send push notification to MetaQuotes ID.

  • SignalCooldownSec
    Cooldown (seconds) to prevent repeated alerts for the same breakout.

F) Statistics / Export

  • CreateStatisticsFile
    If true, the indicator creates/updates a CSV statistics file (for analysis).

G) Styling / Colors / Objects

  • BreakoutBoxFontSize
    Font size for box labels.

  • BreakoutBoxColor
    Main box color.

  • BreakoutBoxContColor
    Continuation box color.

  • BreakoutBoxContFullColored
    If true, continuation box is fully colored.

  • BreakoutBoxContPriceColor
    Color of continuation box price labels.

  • BreakoutPriceColor
    Color of breakout price labels/lines.

  • BreakoutPriceWidth
    Thickness/visibility of breakout price labels/lines.

  • StatsColor / StatsBGColor
    Panel text/background colors.

  • StatsCorner
    Panel corner location (0..3).

  • BoxVerticalLineDelimiter
    Draws vertical delimiters for boxes (optional).

  • BoxVerticalLineColor
    Color of vertical delimiters.

  • SwingLabelsFontSize / SwingLabelsColor
    Swing/label styling (if enabled in your build).

  • Fonts
    Font name (e.g., Arial).

  • debug
    Debug mode (0 = off). Use only for troubleshooting.

Notes

  • Works on any symbol (including CFDs and metals) and timeframe.

  • Breakout confirmation and volatility-adaptive range make it suitable for both conservative and aggressive breakout styles.

  • EA-ready buffers allow integration into automated strategies via  iCustom .


Önerilen ürünler
Parabolik SAR ve Destek/Direnç Seviyeleri, forex ticaretinde potansiyel trend dönüşlerini ve giriş ve çıkış noktalarını belirlemek için kullanılan bir teknik analiz göstergesi olmakla kalmayıp aynı zamanda hazır bir otonom ticaret stratejisidir. Gösterge, grafiğe dinamik destek ve direnç seviyeleri ekleyerek PSAR göstergesini temel alır ve bu da yatırımcıların piyasanın potansiyel olarak tersine dönebileceği önemli fiyat seviyelerini belirlemesine yardımcı olabilir. Yatırımcılar bu göstergeyi
Acemi veya Profesyonel, en çok satan çok zaman dilimli Pivot Prof, alış ve satışlarınızı güzelleştirecek ve uzmanların kullandığı Destek ve Direnç katmanlarıyla size birinci sınıf değişim olanakları sunacaktır. Pivot alış ve satış, anahtar aralıklarda piyasaya giriş ve çıkış yapmak için kolay ve güzel bir tekniktir ve yetkililer tarafından uzun süredir kullanılmaktadır ve tüm semboller üzerinde çalışmaktadır: Forex, Kripto, Hisse Senetleri, Endeksler vb. Pivot Prof top getiriyor Katmanları bayi
PX Trend
Vitalii Zakharuk
PX Trend is a technical indicator that mathematically transforms the price of a currency pair in the form of signaling arrows on the chart, it is used to predict the direction of the market movement. This tool is basic for the interpretation of the parameters of the graphs in technical analysis. PX Trend refers to an arrow indicator Forex - a tool that gives unambiguous signals to buy or sell currencies using arrows. An arrow directed upwards recommends buying, downward - selling. The indicato
This indicator is meant for Harmonic Traders, it helps them in identifying the formed patterns by analyzing the market past data, looking for Harmonic Patterns. The Patterns that this indicator can detect are: AB=CD Butterfly Gartely Crab Bat The indicator shows the following: The completed pattern, with the critical zone highlighted in Gray box The suggested 3 take profit levels (in green) The Suggested Stop Loss level (in Red) The formed pattern ratios can be checked by hovering the mouse on t
Price Strength
Vincenzo Maria Arricale
This indicator computes two lines representing the price bar strength. Close, high and low of each bar are compared with the highest high and lowest low of the last N bars, where N is a parameter set by user. Two lines are computed, a red one and a green one, with values between 0 and 100. High values of the red line means that close is very far from the bar high, while high value of the green line means price  is very far from the bar low . The indicator provides alerts when red or green line a
Indicators 14 in 1
Makarii Gubaydullin
5 (1)
Kolay işlem için 14 gösterge ve yardımcı araç Bu yardımcı program, trader'ın belirli eylemleri için yararlı olabilecek 14 ek araç içerir,   böylece işlem sürecini basitleştirir ve hızlandırır. Benim  #1 Trade Manager 'ıma göz atın: 66+ özellik ve gösterge içerir  |   Bana ulaşın  sorularınız varsa Farklı monitör çözünürlükleri nedeniyle, bazı kullanıcılar etiketlerin üst üste göründüğünü veya çok küçük olduğunu fark edebilir. Bu sorunu yaşarsanız, yazı boyutunu ayarlayabilirsiniz: giriş değişken
Fibo Panda is an indicator that can help you predict the end of daily trends. If the daily price has reached the END L4 or END H4, means the Daily volume is enough. If the daily price has reached the Highest or Lowest, means the price has reached the highest or lowest level. Price must touch the End Hi or End Low Level to complete the price movement of each timeframe. A conclusion can be made whether to buy or sell. If the price is in the High Guard and Low Guard areas it means the price is now
This is indicator for checking your trades. Please see the pictures attachment, the indicator show info about: - Breakeven Level; - Margin Call Level; - Two volume info, past and current (With color exchange base on the past volume); - Spreads; - Swap Long and Swap Short (With color change, positive and negative swap); - Running Price; -Today High Low Pips; - Today Open to Current Running Price pips. This indicator not for trading entry, only to assist your trade management Regards
This indicator is a proof of concept of pyramid trading strategy. It draws fibonacci level automatically from higher high to lower low or from lower low to higher high combinate with Pyramid Trading Strategy for better risk reward ratio. What is Pyramid Trading Strategy? The pyramid forex trading strategy is a something every forex trader should know about because it makes the difference between making some pips with some risk in only one trade or some pips with less the risk by applying the pyr
This indicator was created to spot potential reversals in the market. It will help you find the edge while trading which is required to be profitable. The indicator does what its good at, processing data objectively and presents you with the results once a new setup has been formed. It can send you a notification or email and such, so you are not required to follow the market every move. This, coupled with the edge it gives, give you the time and rest to take the appropriate action. The Engulfi
My Point MT4
Claudia Ramona Angerer
4 (1)
Diagnosis of major and minor pivot Trend detection with many signals Can be used in all symbols Can be used in all time frames Settings: Back Show: The number of candles it displays If you need any adjustments, or have any questions or suggestions, message me How to trade: Blue: sell signal Red: buy signal Blue and red at the same time: no signal Exit signal: Opposite signal
Note : The slow loading of the indicator issue has been addressed . This new version loads fast and does not slow the platform. Version 1.3 : We have updated the indicator to include an historical bar scanning option . So instead of scanning all bars in the history (which can make the indicator slow sometimes ) , you can select the maximum number of bars it can scan which can increase the performance and make the indicator faster. This indicator scans the 1-3 Trendline pattern . The indicato
MoveWave
Andriy Sydoruk
MoveWave - Moving waves are very handy indicators for determining pivot levels. Most Forex traders make decisions based on technical analysis. This type of analysis determines patterns and trends in the market. With the help of complex mathematical equations that are combined and made out in the form of this indicator, the trader will be able to more accurately determine the price reversal levels. Wave theory mathematically represents various behavioral models of the market. It is used as the ba
Session Kill zones with panel for quick changes. Asia Killzone London Killzone New York Killzone London Close Killzone In this indicator GMT+2 timings are used that are most common among many brokers. read the image attached in the screenshots to know more about sessions adjustments Session timings can be changed according to your broker timings and day light savings. Thank you :) Always open to feedback and criticism if it helps me provide you more value. - Rahul  My other indicators you may l
ROC acceleration-deceleration is the manual system for medium-term scalping. Indicator based on custom ROC system which defines bullish/bearish market and especially  acceleration-deceleration of tendention in the market's main direction. Buy arrow is plotted during bearish market when current trend decelerates and sell  arrow is plotted during bullish market when current trend decelerates. Main Indicator's Features Signals are not repaint,non-late or disappear(exept cases when system recalculat
Ska ZigZag BuySell
NKATEKO VUKOSI LEROY MASANGO
Ska ZigZag BuySell indicator determines the overbought and oversold regions within a trend. The indicator determines the overbought region by the candlestick high and the oversold region by the candlestick low. This indicator only gives signals with arrow and audible alerts each and every time when a new candlestick appear. To utilize the full strategy i recommend using "Ska ZigZag BuySell" together with "Ska ZigZag Line". The Ska ZigZag Line indicator is available for free. NOTE: Indicator is h
Machine Learning Adaptive SuperTrend - Take Your Trading to the Next Level! Introducing the   Machine Learning Adaptive SuperTrend , an advanced trading indicator designed to adapt to market volatility dynamically using machine learning techniques. This indicator employs k-means clustering to categorize market volatility into high, medium, and low levels, enhancing the traditional SuperTrend strategy. Perfect for traders who want an edge in identifying trend shifts and market conditio
Candle Inside indicator - draws Japanese candlesticks of a higher timeframe on the chart. Now, after loading the indicator, it is possible to see what is happening inside each candle. In addition to the standard buttons for selecting the timeframe in the MT-4 terminal, additional buttons are added, when clicked, an older period is selected to display Japanese candles or zones. For example, if you select the standard period M1 and the period of the indicator M5, then the chart will display minute
The "One-Click" Breakout Monitor Never Miss a Breakout Again. Price Alert Line   is designed for traders who need speed and simplicity. Instead of navigating complex menus to set price alerts, this tool places a button directly on your chart. With a single click, you can deploy a horizontal line that monitors price action and alerts you immediately when the price crosses it. New Feature (Smart UI):   The control buttons now automatically adapt to match your line colors. If you set your resis
HF SuperZig
Wong Sze Wai
5 (2)
This SuperZig indicator is special design for some trader trade with  ZigZag  and  Fibonacci . ( !!! NEW !!! +++ Support and Resistance +++ ) It will draw least two Fibonacci automatically in your chart period. Alerts when Created/Touced the Support/Resistance Box, it will send phone push/email notification to you at the same time. ZigZag + Fibo + BreakOutLine + SupportResistance = SuperZig !!! Input Parameter: " Show ZigZag " ::  Show ZigZag indicator with your own style ; " Show BreakOut Lin
Range one
Abdiasis Omar Hassan
Range one indicator MT4, for any instruments and it alerts instant, suitable and works best timeframes (4H) and higher 1 . to trade as trend you will need to have Confirmation technical indicator called PARABOLIC SAR Periods step = 0.9 and Maximum = 0.2  Go buy if PSAR is Trending (if PSAR is greater then previous PSAR)  and Go Sell (if PSAR is lower then previous ) 2. Range one indicator is for One candle to trade when it alerts you Buy Go Buy for One candle and Sell Respectively 3 see the pi
This is indicator signals entry buy or sell for trader. It notification price entry to trader and price Stop Loss and price Take Profit. Indicator price for entry orders Pending Limit. Input Parameters On Alert - true/false (Displays a message in a separate window.) On Send Notification - false/true. (Sends push notifications to the mobile terminals, whose Meta Quotes IDs are specified in the "Notifications" tab. (Strict use restrictions are set for the SendNotification() function: no more than
The indicator compares pattern found on chart history with the current price movement. Since history repeats itself, then, by comparing the two patterns, indicator can predict the further movement of the price. The indicator allows you to overlay highlighted history pattern with current movement and you will visually see this movement and will be able to compare the past and the present. To compare two patterns, you need: It is necessary to find and highlight a pattern on the history chart of a
Indicador de sesion de trabajo
Edmundo Antonio Bazan Garcia
Permite ver el horario comprendido entre la hora inicial que indique el usuario y la hora final, de esa manera, si el usuario desea ver sobre el grafico una sesion de trabajo, solo tiene que indicar la hora incial y la hora final de la sesion que desee. Esto permite que el usuario identifique con mayor facilidad el horario que comprenda la sesion de trabajo que el usuario desee vigilar, o trabajar, o simplemente tener como referencia.
Alert Up Down MT4
William Oswaldo Mayorga Urduy
ALERT UP - DOWN FOR METATRADER 5 This indicator generates an alert when the price leaves the zone between the UP and DOWN lines. You can generate alerts of various types such as: > Sound > Message box > Message in the expert box > Mail (previously configured) > PUSH notifications (previously configured) The lines must be configured from the indicator properties and not from the lines properties, since if it is done from the lines properties, the finonacci may be affected. Among the s
Fibonacci colores
Carlos Augusto Cedeno Rocha
Fibonacci por color en niveles para aplicar estrategia profesional inicialmente se coloca en el punto mas alto del dia y mas bajo con esto es para ubicar operaciones a una distancia exacta con lo cual se busca generar ganancias residuales internas en el mismo dia con esto las lineas fusias es para colocar las entrdas sell y las lineas verdes amarillas van los buy
Simple Candlestick Timer – Free MT4 Indicator Simple Candlestick Timer is a lightweight and easy-to-use MT4 indicator that displays a precise countdown until the current candlestick closes. This tool helps traders improve timing, discipline, and decision-making by showing exactly how much time remains before the next candle begins. Key Features: Clean countdown display directly on your chart. Helps with entry and exit timing. Lightweight, simple, and beginner-friendly. Works on all symbols and t
FREE
This is an indicator that helps you to scan the whole timeframe then informs you about the last candle position Engulfing Candlestick pattern was formed. The indicator also send alert to your mobile when a new engulfing candle is formed.  For the visual; 1. Green up arrow indicates a bullish engulfing candlestick pattern  2. Red down arrow indicates a bearish engulfing candlestick pattern
FREE
Fibo Reversals is an indicator which has carefully been put together to attempt to indicate a time period in which an ongoing trend is most probably exhausted and a new trend (actually a reversal trend) inadvertently begins. At this, it should be okay for the manual trader to be on the look out for good trading opportunities. Input Settings Father Fibo  – This Input Determines The Highest Price For The Chosen Input Period. Son Fibo  - This Input Determines The Lowest Price For The Chosen Input
Market Profile
Artem Titarenko
5 (1)
The "Market Profile" indicator displays the profiles and volumes of periods – weekly, daily, session (8-hour), 4-hour, hour, summary. The VAH/VAL price area is automatically highlighted by a dotted line for each profile (except for the summary). The indicator includes chroma Delta, which colors the profile areas. The areas of prevailing Buys is colored in green, that of Sells - in red. The intensity histogram features blue/red respectively. In the filter mode, the indicator displays the volume a
Bu ürünün alıcıları ayrıca şunları da satın alıyor
Gann Made Easy
Oleg Rodin
4.81 (156)
Gann Made Easy , bay teorisini kullanarak ticaretin en iyi ilkelerine dayanan, profesyonel ve kullanımı kolay bir Forex ticaret sistemidir. WD Gann. Gösterge, Zararı Durdur ve Kâr Al Seviyeleri dahil olmak üzere doğru SATIN AL ve SAT sinyalleri sağlar. PUSH bildirimlerini kullanarak hareket halindeyken bile işlem yapabilirsiniz. LÜTFEN ÜCRETSİZ OLARAK TİCARET İPUÇLARI, BONUSLAR VE GANN MADE EA ASİSTANI ALMAK İÇİN SATIN ALIMDAN SONRA BENİMLE İLETİŞİME GEÇİN! Muhtemelen Gann ticaret yöntemlerini b
M1 Sniper
Oleg Rodin
4.89 (18)
M1 SNIPER kullanımı kolay bir işlem göstergesi sistemidir. M1 zaman dilimi için tasarlanmış bir ok göstergesidir. Gösterge, M1 zaman diliminde scalping için bağımsız bir sistem olarak kullanılabilir ve mevcut işlem sisteminizin bir parçası olarak kullanılabilir. Bu işlem sistemi özellikle M1'de işlem yapmak için tasarlanmış olsa da, diğer zaman dilimleriyle de kullanılabilir. Başlangıçta bu yöntemi XAUUSD ve BTCUSD ticareti için tasarladım. Ancak bu yöntemi diğer piyasalarda işlem yaparken de ya
Volatility Trend System - girişler için sinyaller veren bir ticaret sistemi. Oynaklık sistemi, trend yönünde doğrusal ve noktasal sinyaller ve ayrıca yeniden çizme ve gecikme olmaksızın trendden çıkmak için sinyaller verir. Trend göstergesi, orta vadeli trendin yönünü izler, yönünü ve değişimini gösterir. Sinyal göstergesi volatilitedeki değişikliklere dayalıdır ve piyasa girişlerini gösterir. Gösterge, çeşitli uyarı türleri ile donatılmıştır. Çeşitli alım satım araçlarına ve zaman dilimlerine
Smc Blast Signal
Mohit Dhariwal
5 (3)
Full Fledged EA and Alert plus for alerts will also be provided in this offer along with the purchase of Indicator. Limited copies only at this price and Ea too. Grab your copy soon Alert plus for indicator with set file is kept in comment section with the image  SMC Blast Signal with FVG, BOS and trend Breakout The SMC Blast Signal is a Precise trading system for Meta Trader 4 that uses Smart Money Concepts (SMC), including Fair Value Gaps (FVG) and Break of Structure (BOS), to identify high-pr
Scalper Inside PRO
Alexey Minkov
4.74 (69)
An exclusive indicator that utilizes an innovative algorithm to swiftly and accurately determine the market trend. The indicator automatically calculates opening, closing, and profit levels, providing detailed trading statistics. With these features, you can choose the most appropriate trading instrument for the current market conditions. Additionally, you can easily integrate your own arrow indicators into Scalper Inside Pro to quickly evaluate their statistics and profitability. Scalper Inside
First 25 copies at $80, after that price becomes $149 (3 copies left) Gold Signal Pro is a powerful MT4 indicator designed to help traders spot strong price reactions in the market. It focuses on clear wick rejections , showing when price strongly rejects a level and often continues in the same direction. Gold Signal Pro is mainly built for scalping gold (XAUUSD) and works best on lower timeframes like M5 and M15 , where timing matters most. That said, it can also be used on any forex pair, a
Trend Screener
STE S.S.COMPANY
4.79 (95)
Trend Göstergesi, Trend Alım Satım ve Filtreleme için Çığır Açan Benzersiz Çözüm, Tüm Önemli Trend Özellikleriyle Tek Bir Araç İçinde Yerleştirildi! Forex, emtialar, kripto para birimleri, endeksler ve hisse senetleri gibi tüm sembollerde/araçlarda kullanılabilen %100 yeniden boyamayan çoklu zaman çerçevesi ve Çoklu para birimi göstergesidir. SINIRLI SÜRELİ TEKLİF: Destek ve Direnç Tarama Göstergesi sadece 50$ ve ömür boyu mevcuttur. (Orijinal fiyat 250$) (teklif uzatıldı) Trend Screener, grafik
Trend indicator AI
Ramil Minniakhmetov
4.7 (80)
Trend Ai göstergesi, trend tanımlamasını işlem yapılabilir giriş noktaları ve geri dönüş uyarılarıyla birleştirerek bir yatırımcının piyasa analizini geliştirecek harika bir araçtır. Bu gösterge, kullanıcıların forex piyasasının karmaşıklıklarında güvenle ve hassasiyetle yol almalarını sağlar. Birincil sinyallerin ötesinde, Trend Ai göstergesi geri çekilmeler veya düzeltmeler sırasında ortaya çıkan ikincil giriş noktalarını belirleyerek, yatırımcıların belirlenen trend içindeki fiyat düzeltmele
Bu gösterge paneli, seçilen semboller için mevcut en son harmonik kalıpları gösterir, böylece zamandan tasarruf edersiniz ve daha verimli olursunuz / MT5 sürümü . Ücretsiz Gösterge: Basic Harmonic Pattern Gösterge sütunları Symbol : seçilen semboller görünecektir Trend: yükseliş veya düşüş Pattern : desen türü (gartley, kelebek, yarasa, yengeç, köpekbalığı, cypher veya ABCD) Entry : giriş fiyatı SL: zararı durdur fiyatı TP1: 1. kar alma fiyatı TP2: 2. kar alma fiyatı TP3: 3. kar alma fiyatı
RFI levels PRO
Roman Podpora
5 (1)
Önceden gösterge   Piyasa dönüş seviyelerini ve bölgelerini belirler , fiyatın seviyeye geri dönmesini beklemenize ve yeni bir trendin başlangıcında, sonunda değil, işleme girmenize olanak tanır. Gösteriyor   tersine çevirme seviyeleri       Piyasanın yön değişikliğini teyit ettiği ve daha fazla hareket oluşturduğu yer. Bu gösterge yeniden çizim gerektirmeden çalışır, her türlü enstrüman için optimize edilmiştir ve en yüksek potansiyelini bir enstrümanla birlikte kullanıldığında ortaya koyar.
Dynamic Forex28 Navigator
Bernhard Schweigert
4.43 (7)
Dynamic Forex28 Navigator - Yeni Nesil Forex Ticaret Aracı. ŞU ANDA %49 İNDİRİM. Dynamic Forex28 Navigator, uzun zamandır popüler olan göstergelerimizin evrimidir ve üçünün gücünü tek bir göstergede birleştirir: Gelişmiş Döviz Gücü28 Göstergesi (695 inceleme) + Gelişmiş Döviz İMPULS ve UYARI (520 inceleme) + CS28 Kombo Sinyalleri (Bonus). Gösterge hakkında ayrıntılar https://www.mql5.com/en/blogs/post/758844 Yeni Nesil Güç Göstergesi Ne Sunuyor?  Orijinallerde sevdiğiniz her şey, şimdi yeni
TPSpro RFI Levels
Roman Podpora
4.85 (27)
TALİMATLAR RUS  /  TALİMATLAR   ENG  /  Sürüm MT5 Ana fonksiyonları: Satıcı ve alıcıların aktif bölgelerini görüntüler! Gösterge, satın alma ve satışlar için tüm doğru ilk dürtü seviyelerini/bölgelerini görüntüler. Giriş noktaları arayışının başladığı bu seviyeler/bölgeler etkinleştirildiğinde, seviyeler renk değiştirir ve belirli renklerle doldurulur. Ayrıca, durumun daha sezgisel bir şekilde algılanması için oklar görünür. LOGIC AI - Bir şablonu etkinleştirirken giriş noktalarını aramak için
Bu indikatörü satın alırsanız, Profesyonel Trade Manager’ımı  + EA   ÜCRETSİZ olarak alacaksınız. Öncelikle, bu Ticaret Sistemi'nin Non-Repainting, Non-Redrawing ve Non-Lagging Göstergesi olduğunu vurgulamak önemlidir, bu da hem manuel hem de robot ticareti için ideal hale getirir. Online kurs, kılavuz ve ön ayarları indir. "Smart Trend Trading System MT5", yeni ve deneyimli tüccarlar için özelleştirilmiş kapsamlı bir ticaret çözümüdür. 10'dan fazla premium göstergeyi birleştiriyor ve 7'den faz
System Trend Pro
Aleksandr Makarov
5 (2)
System Trend Pro - This is the best trend trading indicator!!! The indicator no repaint!!!  The indicator has   MTF   mode, which adds confidence to trading on the trend (   no repaint   ). How to trade? Everything is very simple, we wait for the first signal (big arrow), then wait for the second signal (small arrow) and enter the market in the direction of the arrow. (See screens 1 and 2.) Exit on the opposite signal or take 20-30 pips, close half of it, and keep the rest until the opposite
Şu anda %40 İNDİRİMLİ! Herhangi bir Acemi veya Uzman Tüccar için En İyi Çözüm! Bu gösterge paneli yazılımı 28 döviz çifti üzerinde çalışıyor. Ana göstergelerimizden 2'sine (Gelişmiş Para Birimi Gücü 28 ve Gelişmiş Para Birimi Dürtüsü) dayanmaktadır. Tüm Forex piyasasına harika bir genel bakış sağlar. Gelişmiş Para Birimi Gücü değerlerini, para birimi hareket hızını ve tüm (9) zaman dilimlerinde 28 Forex çifti için sinyalleri gösterir. Trendleri ve / veya scalping fırsatlarını belirlemek için
ŞU ANDA %40 INDIRIMLI !!! Yeni Başlayanlar veya Uzman Tüccarlar için En İyi Çözüm! Bu gösterge benzersiz, yüksek kaliteli ve uygun fiyatlı bir ticaret aracıdır çünkü bir dizi tescilli özellik ve gizli bir formül ekledik. Yalnızca BİR grafikle 28 döviz çiftinin tümü için Uyarılar verir. Yeni bir trendin veya scalping fırsatının tam tetik noktasını belirleyebildiğiniz için ticaretinizin nasıl gelişeceğini hayal edin! Yeni temel algoritmalar üzerine inşa edilen bu sistem, potansiyel işlemlerin
PRO Renko Sistemi, RENKO grafikleri ticareti için özel olarak tasarlanmış son derece hassas bir ticaret sistemidir. Bu, çeşitli ticaret araçlarına uygulanabilen evrensel bir sistemdir. Sistemi etkin piyasa sana doğru ters sinyallerine erişim hakkı denilen ses nötralize eder. Göstergenin kullanımı çok kolaydır ve sinyal üretiminden sorumlu tek bir parametreye sahiptir. Aracı, seçtiğiniz herhangi bir ticaret aracına ve renko çubuğunun boyutuna kolayca uyarlayabilirsiniz. Yazılımımla karlı bir
Pulse Scalping Line - an indicator for identifying potential pivot points. Based on this indicator, you can build an effective Martingale system. According to our statistics, the indicator gives a maximum of 4 erroneous pivot points in a series. On average, these are 2 pivot points. That is, the indicator shows a reversal, it is erroneous. This means that the second signal of the indicator will be highly accurate. Based on this information, you can build a trading system based on the Martingale
Slayer Scalping
Abdulkarim Karazon
5 (2)
Bu gösterge, iki kar alma seviyesine ve çok sıkı stoploss noktasına odaklanır; tüm amaç, m15 ve daha yüksek zaman dilimlerinde piyasayı skalize etmek; çünkü bu zaman dilimleri spread ve broker komisyonu tarafından çok fazla etkilenmez; gösterge, fiyat ayrışması stratejisine dayalı olarak al/satım sinyalleri verir ve bir yükseliş divergens koşulları tam olarak sağlandığında tp/sl seviyeleriyle bir satın alma oku çizer. Aynı şey satış okları için de geçerli, ok mum kapanışında baskı yapar ve canlı
MetaForecast M4
Vahidreza Heidar Gholami
5 (2)
MetaForecast, fiyat verilerindeki harmonileri kullanarak herhangi bir piyasanın geleceğini tahmin eder ve görselleştirir. Piyasa her zaman tahmin edilemezken, fiyatlarda bir desen varsa, MetaForecast geleceği mümkün olduğunca doğru bir şekilde tahmin edebilir. Benzer ürünlere göre, MetaForecast piyasa eğilimlerini analiz ederek daha kesin sonuçlar üretebilir. Giriş Parametreleri Past size (Geçmiş boyut) MetaForecast'ın gelecekteki tahminler oluşturmak için kullandığı çubuk sayısını belirtir. Mo
FX Power MT4 NG
Daniel Stein
4.95 (21)
FX Power: Daha Akıllı Ticaret Kararları için Para Birimlerinin Gücünü Analiz Edin Genel Bakış FX Power , her piyasa koşulunda başlıca para birimlerinin ve altının gerçek gücünü anlamak için vazgeçilmez bir araçtır. Güçlü para birimlerini alıp zayıf olanları satarak, FX Power ticaret kararlarınızı basitleştirir ve yüksek olasılıklı fırsatları ortaya çıkarır. İster trendlere sadık kalın ister Delta'nın aşırı değerlerini kullanarak tersine dönüşleri öngörün, bu araç ticaret tarzınıza mükemmel bir
Shogun Trade
Yuki Miyake
5 (2)
SHOGUN Trade - The Shocking Truth of 16 Years Unoptimized. Shogun Trading February Special Sale – Only $99 (Regular Price $199)! This special offer is available until February 28th . As we are dedicated to further product development and optimization , we are offering this discount in exchange for your valuable feedback. Your insights will directly influence our next round of updates and feature enhancements. Price: $99 (Special discount from $199) Requirement: Please leave a review and share
ŞU ANDA %40INDIRIMLI Yeni Başlayanlar veya Uzman Tüccarlar için En İyi Çözüm! Bu Gösterge benzersiz, yüksek kaliteli ve uygun fiyatlı bir ticaret aracıdır çünkü bir dizi tescilli özellik ve yeni bir formül ekledik. Sadece BİR grafik ile 28 Forex çifti için Döviz Gücünü okuyabilirsiniz! Yeni bir trendin veya scalping fırsatının tam tetik noktasını belirleyebildiğiniz için ticaretinizin nasıl gelişeceğini hayal edin? Kullanım kılavuzu: buraya tıklayın Bu ilk olan, orijinal! Değersiz bir özent
Trend Arrow Super
Aleksandr Makarov
5 (2)
Trend Arrow Super The indicator not repaint or change its data. A professional, yet very easy to use Forex system. The indicator gives accurate BUY\SELL signals. Trend Arrow Super is very easy to use, you just need to attach it to the chart and follow simple trading recommendations. Buy signal: Arrow + Histogram in green color, enter immediately on the market to buy. Sell signal: Arrow + Histogram of red color, enter immediately on the market to sell.
Grafikleri yapılandıran ve döngüsel fiyat hareketlerini belirleyen teknik bir gösterge. Herhangi bir grafik üzerinde çalışabilirim. Birkaç çeşit bildirim var. Grafiğin kendisinde ek oklar var. Tarihe yeniden bakmadan, mumun kapanışına dair çalışmalar. M5 ve üzeri TF önerilir. Kullanımı ve yapılandırması kolay parametreler. Farklı parametrelere sahip 2 indikatörü kullanırken, bunları diğer indikatörler olmadan da kullanabilirsiniz. 2 giriş parametresi vardır Döngüsellik ve Sinyal Süresi Bu 2 pa
Binary FX Ideal
Yaroslav Varankin
5 (1)
great tool for any trader for both Forex and binary options suitable for any trader no need to configure anything, everything has been perfected by time and experience The tool combines 5 indicators and 3 proprietary strategies works great during flats and trends It indicates a trend reversal at its very beginning, it works well with the trend Trading Recommendations The signal is formulated on the current candle You should enter the trade at the next Possible recount (rare)
Wave Anatomy
Trade The Volume Waves Single Member P.C.
5 (1)
Wave Anatomy Visit:   http://www.tradethevolumewaves.com   for more information Construct your own 5 Waves and analyze the price movements stages: Easy Movement Hard time to move Fast move This indicator is based on Wyckoff’s, David’s Weis and my Speed Index Theory. This indicator will you help analyze what is happening in 5 Price Waves that you can construct yourself. This tool is designed for scalpers and swing traders and will help them to analyze any wave on any timeframe at the same time.
True SnD
Indra Lukmana
5 (1)
This Supply & Demand indicator uses a unique price action detection to calculate and measures the supply & demand area. The indicator will ensure the area are fresh and have a significant low risk zone. Our Supply Demand indicator delivers functionality previously unavailable on any trading platform. Trading idea You may set pending orders along the supply & demand area. You may enter a trade directly upon price hit the specific area (after a rejection confirmed). Input parameters Signal - Set
Meravith
Ivan Stefanov
5 (1)
Gösterge, her noktadan hacmi analiz eder ve bu hacim için piyasa tükenme seviyelerini hesaplar. Üç çizgiden oluşur: Boğa hacmi tükenme çizgisi Ayı hacmi tükenme çizgisi Piyasa trendini gösteren bir çizgi. Bu çizgi, piyasanın boğa mı yoksa ayı mı olduğunu yansıtacak şekilde rengini değiştirir. Piyasayı istediğiniz herhangi bir başlangıç noktasından analiz edebilirsiniz. Bir hacim tükenme çizgisine ulaşıldığında, bir sonraki analize başlamak için yeni bir nokta belirleyin. Herhangi bir şeyi analiz
Volatility Master for MetaTrader is a real-time dashboard tool that scans up to 56 symbols using up to 2 flexible dashboards on different charts to identify high-volatility, trending markets instantly. With clear bullish/bearish signals, customizable alerts, and a user-friendly interface, it helps you avoid range-bound conditions and focus on high-probability trades. Clarity leads to confidence. Trade confidently and protect your capital effectively with this powerful dashboard. Setup & Guide: 
Yazarın diğer ürünleri
The Extreme Spike PRT Indicator   is an effective tool for identifying   sharp market fluctuations .   It performs its calculations using the ATR (Average True Range) indicator and displays candles with extreme volatility in two categories:   primary spikes   and   secondary spikes , within the Metatrader platform oscillator window. This tool assists traders in detecting   intense price movements   and conducting more precise   analyses   based on these fluctuations. Time Frame 15-minute - 1-ho
The TMA Centered Bands Indicator for MT5 draws bands on the chart and shows the overall price trend. It displays three bands - the lower and upper boundaries of the channel and the median.   The bands are made up of moving averages, and each of them has an MA period. The name TMA comes from triangular moving averages, as the indicator draws triangular bands.   The price will fluctuate between these ranges whenever the trend changes direction, thus creating entry and exit points.   How to trade
FREE
This universal Expert Advisor is equally good for both scalping and conservative multi-currency trading of simultaneous trading of several pairs. This  Expert Advisor  is based on its own Algorithm, which is an incredibly effective tool due to the simultaneous operation of a trading strategy based on our   Centered Bands  Indicator  and our proprietary signal filter system together with the Martingale method, which together work out a very interesting hedging system. Traders are also given the
The Channel Sgnals ProfRoboTrading Indicator for MT5 is an effective Forex trading tool designed to track market movements.   The MT5 signal point indicator effectively detects trend reversals after they have already occurred. This Indicator   is a fully automated technical tool that includes a number of parameters to track market trends.   It automatically examines the ever-changing price dynamics of the market, compares the information with earlier data and generates a trading signal. Because
FREE
This universal expert advisor is based on our own Algorithm, which is based on effective and time-tested Elliot Wave Theory.  This   expert advisor   is ideal for working both on a flat and during sharp or protracted trend movements (thanks to the Martingale method, according to which averaging positions are opened in accordance with the multiplier and distance set in the settings for accepting a new signal). ATTENTION! CAREFULLY STUDY THE OPERATING PRINCIPLE AND AVAILABLE SETTINGS OF THE EXPER
The TrendOscillator Indicator is an upgraded version of the traditional Stochastic Oscillator.   It comprises two lines: %K and %D.   The %K line represents the current market position.   In contrast, the %D line is a moving average of the %K line used to generate signals and identify potential entry or exit points. The good thing is the indicator works on all timeframes like the traditional Stochastic.   However, to avoid any false signals, applying the indicator on longer timeframes is better
FREE
Bollinger Bands Stop Indicator holds significant importance for traders navigating the complex world of financial markets. Its relevance lies in several key aspects. Firstly, it aids in trend identification. By analyzing price movements relative to the Bollinger Bands, traders can discern whether the market is in an uptrend, downtrend, or ranging phase. Secondly, the indicator provides valuable insights into market volatility. Wider bands indicate higher volatility, while narrower bands suggest
FREE
Our modernized version of the popular channel TMA_TRUE  indicator for MT4, which provides information on the main points of trend reversal and momentum exhaustion by drawing a channel on the chart, also draws arrows of signals for buy and sell. As a result, traders can identify bullish and bearish price reversal zones and BUY and SELL accordingly. This indicator works well on all instruments and on all Timeframes. This indicator is the basis of our Channel Trigger EA, which you can buy in MQL
FREE
The Kalires Channel Indicator is a technical indicator used to evaluate trend direction and potential trading opportunities. This is a hybrid indicator that combines Kauffman Adaptive Moving Average (KAMA), linear regression and smoothing. The Kalires Channel Indicator consists of two lines: one central and two outer bands. The central line is a smoothed KAMA modified according to the direction of the trend. The outer bars represent two linear regression lines drawn above and below the center l
FREE
This indicator works by plotting fractals on the chart as arrows that can be used as buy or sell signals. It is a great tool for both new and experienced traders as it provides a clear visual representation of the market and helps traders identify fractals. Although it repaints, it can be used quite effectively in conjunction with other tools to filter trading strategies. We use this indicator in this way in our Royal Fractals EA, which you can purchase on the MQL5 Market: https://www.mql5.com
FREE
The Forex Gangster Indicator allows you to determine the current trend. If the Forex Gangster Indicator line has moved below the price and turned blue, then you should open deals for an increase. If the Forex Gangster Indicator line has appeared above the price and turned red, then you should open deals for a decrease: The indicator is suitable for any time frames, but it needs to be supplemented with filtering indicators, since by itself it is late and does not have time to give an accurate si
FREE
This indicator works by plotting fractals on the chart as arrows that can be used as buy or sell signals. It is a great tool for both new and experienced traders as it provides a clear visual representation of the market and helps traders identify fractals. Although it repaints, it can be used quite effectively in conjunction with other tools to filter trading strategies. We use this indicator in this way in our RoyalFractals II Expert Advisor, which you can purchase on the MQL5 Market: https:
FREE
The TMA Centered Bands indicator for MT4 draws bands on the chart and reports the overall price trend, as well as gives arrows signals to buy and sell when the bar closes outside the channel. Unlike many TMAs, our version uses the calculation part of the algorithm without redrawing, and also adds the ability to select a symbol. The bands are made up of moving averages, and each of them has an MA period. The name TMA comes from triangular moving averages, as the indicator draws triangular bands
FREE
The TrendChannelTracker Indicator is an innovative Forex trading tool. This indicator, which is based on the standard Stochastic Oscillator, provides traders with a unique and simplified method for observing market trends. In contrast to the traditional Stochastic Oscillator, which is shown at the bottom of the chart, the TrendChannelTracker Indicator is built into the price action itself. This removes the need for traders to continually switch their attention between the oscillator and the pri
FREE
The Red Dragons Support and Resistance Levels indicator automatically determines support and resistance levels using the proprietary algorithm based on historical and current data, so the levels are dynamic, which allows you to adjust trading targets based on the current price movement. For this reason, we use this indicator in our advisors, for example, Red Dragons, which you can purchase here: https://www.mql5.com/en/market/product/128713?source=Site +Market+MT4+New+Rating006 The panel also
FREE
The BandsFill Indicator is a modified Bollinger Bands with a colored cloud.   It has two adjustable parameters: Period Deviation The cloud is colored as follows: If the price crosses the upper band, the cloud is blue. If the price crosses the lower band, the cloud is pink.   Thanks to this, the BandsFill Indicator provides traders with an easy opportunity to detect various features and patterns in price dynamics that are invisible to the naked eye. Based on this information, traders can predict
FREE
The Teamtrader Channel Stop indicator allows you to determine the current trend. If the Teamtrader Channel Stop indicator line has moved below the price and turned blue, then you should open deals for an increase. If the Teamtrader Channel Stop indicator line has appeared above the price and turned red, then you should open deals for a decrease: The indicator is suitable for any time frames, but it needs to be supplemented with filtering indicators, since by itself it is late and does not have
FREE
Moving Averages Divergence 3x3    Indicator     uses the crossover technique for signaling the market trend and the trade opportunities as well.     It applies 3 formats of the same indicator and allows them to plot the crossover signals which are interpreted as the trade signals along with the direction of the market trend. Moving Averages Divergence 3x3    Indicator   can be applied to trade all kinds of forex currency pairs within the financial markets.  Although, this indicator works well o
FREE
FOREX GANGSTER is a unique Expert Advisor created by a professional prop trader and financial asset manager with many years of experience. This is a solution for those who strive for stable profits without constant control over each transaction or monitoring the work of a trading advisor. Created for optimal conservative trading and investing through exchange instruments with long-term regular profits and minimal risks. The Expert Advisor algorithm is based on a deep understanding of market pat
The Wolf Wave Finder Indicator is a popular indicator, that is useful in identifying potential trading opportunities.   The indicator works by recognizing the Wolf Wave pattern, which is a well-known pattern used by professional traders to identify potential areas of support and resistance.   The indicator is easy to use and provides traders with an easy way to identify potential trades.   The Wolf Wave Finder Indicator is a great tool for traders who are looking for a reliable and accurate way
This indicator is a fusion of the Parabolic SAR and Fibonacci indicators. Fibo is drawn on the last wave, at the peaks the indicator displays prices for convenience. Parabolic SAR helps to define the market trend and generates trends following trade signals.     On the other hand, Fibonacci plots the price retracement levels so that traders can determine a better and safer place to enter the market. Scalping with Parabolic SAR and Fibonacci Overview. For this strategy, in addition to our indica
This is an easy-to-set-up and easy-to-use Expert Advisor that will help you always have the necessary information about your trading account at hand, sending from MetaTrader 4 to you in Telegram: • Account drawdown • Number of open positions • Volume of open positions • Profit per day, week, month How to get an chat ID: - Chat with BotFather to create Bot and get API Token of Bot. If you had Bot, skip the step. - Chat with bot @userinfobot , then the bot will reply your ID. How to setu
The SYMBOL MANAGER symbol change indicator is an effective tool designed to enhance trading convenience and significantly simplify the trader's experience. This indicator allows users to switch seamlessly between currency pairs and timeframes within a single open window of the trading terminal. Importantly, when switching, the associated template, including indicators and current chart settings, is automatically duplicated, ensuring a consistent trading environment.
Morning Star PRT göstergesi sabah düz kırılma ilkesini kullanır. Gösterge sabah düz seviyelerini görüntüler ve olası hedefleri gösterir. Göstergeye ek bir Fibonacci seviyesi eklenmiştir ve ayrıca ayarlarda belirtilen her iki hedef seviyesinin ve gece düz seviyesinin kesişimi hakkında sesli uyarılar vardır. Morning Star PRT göstergesi gecenin sonunda bir gece düz kanalı ve yukarı ve aşağı iki Fibonacci fiyat seviyesi oluşturur. Bu seviyeler hem hedef hem de geri dönüş seviyeleri olarak düşünüle
Gösterge Arz ve Talep bölgeleri PRT– grafiğin arz ve talep bölgelerini işaretlemek için kullanılan özel bir araçtır. Gösterge, direnç/destek seviyelerini ve arz/talep bölgelerini vurgulayan grafikte çizgiler ve dikdörtgenler çizer. Kolaylık olması açısından, hem çizgiler hem de şekiller farklı renklerle boyanmıştır, böylece sinyaller birbirinden kolayca ayırt edilebilir. Gösterge yalnızca yeni seviyeleri, yani henüz kullanılmamış ve fiyatın henüz bunları aşmamış seviyeleri çizer. Hem yeni başla
Bu gösterge, grafik desenlerini belirlemek isteyen yatırımcılar için güçlü bir araçtır ve bunu işlem stratejilerine dahil etmenin sayısız faydası vardır. Bu araç, finansal piyasalardaki potansiyel eğilimleri ve geri dönüşleri etkili bir şekilde belirler ve işaret eder, böylece işlem karlılığını artırır. Gelişmiş algoritması sayesinde gösterge, piyasa verilerini doğru bir şekilde analiz edebilir ve yatırımcılara bilinçli kararlar almalarına yardımcı olabilecek değerli bilgiler sağlar. Bu gösterg
This is the automatic price spike signal indicator for MT4. Plots advance alerts on potential breakouts/pullbacks. Suits forex, stocks & crypto trading strategies. This is a perfect indicator for reversal traders. A spike often indicates a turn-around moment. The best way to use that gauge is to apply it to your favourite trading system as a filter. 這是 MT4 的自動價格飆升訊號指示器。繪製有關潛在突破/回調的預先警報。適合外匯、股票和加密貨幣交易策略。 對於反轉交易者來說,這是一個完美的指標。尖峰通常表示轉變時刻。使用該指標的最佳方法是將其作為過濾器應用到您最喜歡的交易系統中
Parabolik SAR ve Destek/Direnç Seviyeleri, forex ticaretinde potansiyel trend dönüşlerini ve giriş ve çıkış noktalarını belirlemek için kullanılan bir teknik analiz göstergesi olmakla kalmayıp aynı zamanda hazır bir otonom ticaret stratejisidir. Gösterge, grafiğe dinamik destek ve direnç seviyeleri ekleyerek PSAR göstergesini temel alır ve bu da yatırımcıların piyasanın potansiyel olarak tersine dönebileceği önemli fiyat seviyelerini belirlemesine yardımcı olabilir. Yatırımcılar bu göstergeyi
ProfRobotrading'in All Market Channels göstergesi, ekranda oluşan tüm işlem kanallarını otomatik olarak oluşturur ve görüntüler. Bu gösterge, mevcut tüm kanal stratejilerinde işlem yapmak için çok uygundur ve tüm enstrümanlara ve zaman dilimlerine uygulanabilir. Ekran görüntüsüne bakın - size daha fazlasını anlatacaktır :) ProfRoboTrading web sitemizde daha fazla bilgi mevcuttur. The All Market Channels indicator from ProfRobotrading automatically builds and displays all formed trading chann
Bu bir Bollinger Bantları Sıkıştırma göstergesidir. Volatilite sıkıştırmasını ve "bastırılmış momentumun" serbest bırakılmasını tespit eder. Herhangi bir belirli işlem girişiyle çakıştığında kullanılabilir - serbest bırakılan volatilite, makul bir kar elde etme olasılığının daha yüksek olması anlamına gelir. Ayrıca, zayıflığı veya gücü simgeleyen renkli bantlara sahip bir histogram ve sıfır çizgisi geçişi de vardır. Bu nedenle, bu gösterge hem işlem stratejileri içindeki diğer göstergelerle birl
Filtrele:
İnceleme yok
İncelemeye yanıt