YouTube'dan Mağaza ile ilgili eğitici videoları izleyin
Bir alım-satım robotu veya gösterge nasıl satın alınır?
Uzman Danışmanınızı
sanal sunucuda çalıştırın
sanal sunucuda çalıştırın
Satın almadan önce göstergeyi/alım-satım robotunu test edin
Mağazada kazanç sağlamak ister misiniz?
Satış için bir ürün nasıl sunulur?
MetaTrader 5 için Uzman Danışmanlar ve göstergeler - 90

T Manager, the ultimate trade management solution designed by traders for traders. If you are searching for a simple and efficient trade panel, trade manager, or trade assistant, you are at the right place. The market contains a diverse number of those tools , but this one is designed by traders for traders . I designed this tool, and I am using it daily.
Take my advice and stop buying tools blended with un-useful features that you will never use, T Manager provides you with the essential y

MultiTF Trend Indicator for MetaTrader 5 MultiTF Trend is a technical indicator for MetaTrader 5 designed to display trend directions across multiple timeframes on a single chart. It uses Moving Average (MA) slope analysis combined with an ATR-based threshold to help identify periods of directional movement in the market. This tool presents trend information in a structured and easy-to-read format, allowing users to observe trend alignment across various timeframes without switching charts. Mai

The SP_H1_840111471_S_Ke_CF_SQX is an algorithmic trading strategy for MetaTrader, tested on SP using the H1 timeframe from December 7, 2017, to June 2, 2023. There is no need to set up parameters, all settings are already optimized and fine-tuned.
Recommended broker RoboForex because of EET timezone.
You can find the strategy source code for StrategyQuant at the link: https://quantmonitor.net/sp500-keltner-channel-trader/
Key details are:
MagicNumber: 840111471
Main Chart: Current s
FREE

EAVN005 – Trading with RSI Indicator "The image in Tap Screenshots shows the result of an optimization for XAUUSD on the M15 timeframe, configured with BUY-only settings. You may consider adjusting the parameters when trading XAUUSD, as the recent trend favors opening BUY orders." ️ Installation Guide General Settings EA Name : The name of the Expert Advisor. Magic Number : Assign a unique Magic Number for each chart to prevent order conflicts. Trading Settings Position Options : Select whether
FREE

MTF MA Dashboard Pro v1.04 - Türkçe MTF MA Dashboard Pro v1.04 - Profesyonel Çoklu Zaman Dilimi Hareketli Ortalama Analizörü Akıllı Altın Kesişim/Ölüm Kesişimi algılama ve tamamen özelleştirilebilir görsel kontrol paneli ile kapsamlı çoklu zaman dilimi hareketli ortalama analizi sağlayan MT5 için gelişmiş teknik gösterge. Zaman dilimleri arasında geçiş yapmayı bırakın! Aynı anda 4 zaman dilimine kadar analiz edin ve trend hizalamalarını anında tespit edin. TEMEL ÖZELLİKLER ÇOKLU ZAMAN
FREE

//////////////////////////////////////////////// //////////////////////////////////
An improved version of the standard Bulls Power and Bears Power indicators.
Now it's two in one.
The setup is simple - you just need to specify the period. It is also very easy to understand the readings of this indicator, a signal above zero is a buy, and below it is a sell.
//////////////////////////////////////////////// ///////////////////////////////////
I hope this indicator will be very useful to you
FREE

This indicator will draw two lines to represent the adjustment value, which can be used in both the Dollar and the Index.
The main advantage of this indicator is that it has two lines, one representing the adjustment calculated from the previous day and the other representing the adjustment calculated on the current day. The calculation of the adjustment on the current day is a great differential, since it will be possible to make operations in order to sleep bought or sold according to the ad
FREE

パラボリックのデータをもとにトレンドの方向性を1分足から月足まで表示します。 1分足から 月足 まで表示されているので今どの方向に価格が動いているのかがすぐに分かります。
更新はティク毎ではなくディフォルトでは1秒毎、もちろん変更も可能なのでチャートの表示が遅くなるようなことはありません。
機能:
どの通貨でも表示可能になります。
アイコンの色を指定することが可能になります。
表示位置(X軸、Y軸)が変更可能 になります。
表示位置 (左上 、 右上 、 左下 、 右下) が 指定 が可能 になります。
フォント を指定することが可能になります。
フォントサイズ が 変更可能 になります。
アイコンのサイズ が 変更可能 になります。
週足、 月足 の非表示 が 可能 になります。
FREE

RSI Divergence Lite (Free) - MT5 Indicator ------------------------------------------------- This is the Lite (free) version of RSI Divergence.
- Detects basic Bullish and Bearish divergence between price and RSI - Works only on M15 timeframe - No divergence lines, no alerts - Fixed internal settings (RSI 14, pivot sensitivity, thresholds) - For educational and testing purposes
For the full PRO version (multi-timeframe, alerts, divergence lines, advanced UI), please upgrade to RSI Divergence
FREE

1. Move SL to BE On/Off: allow EA move SL to BE or not allow. 2. BE mode: BE Single order: move SL of single order when condition match. BE multi order: Move Sl of multiple orders base on BE of multiple orders. 3. Move SL to BE when profit >= (pips): set how many pips you want EA move SL to BE when profit. 4. Add value from BE: number of pips you want to add from BE (offset). 5. Audible Alert: Enable audible alert on/off. 6. Push notification: Enable Push notification on/off. 7. Three button hel
FREE

Advanced Trade Mirror is a powerful Forex tool designed for traders who need instant, seamless trade replication across multiple terminals on the same machine. With lightning-fast execution, it ensures zero lag in copying trades, maintaining precision and efficiency in high-speed trading environments.
Get the Trade Mirror Follower here: https://www.mql5.com/en/market/product/133890 Specification:
Master ID: Identity value of master terminal, please use a unique value to prevent duplicated mas
FREE
This MQL4 code is a custom indicator that draws multiple colored rectangles on a chart, spaced apart by a defined pip distance, and projected into the future. Here's a brief breakdown: Purpose: Draws several horizontal rectangles (zones) starting from a specified price. Rectangles are spaced apart vertically by a pip distance. Colors alternate between FirstColor and SecondColor . Rectangles can be drawn behind candles and optionally filled. Each rectangle extends into the future for a specif
FREE

ScalpReactor X A Tactical Indicator for Precision Traders The Ritz Scalping Habbit is a powerful MT5 indicator designed to help traders execute disciplined, high-probability trades through clear visual cues and multi-strategy confirmations. Whether you’re an intraday scalper or a swing trader , this tool integrates advanced market analysis into a single, easy-to-use interface. Key Strengths: Smart Buy & Sell Arrows — Based on multi-layer signals from RSI, ATR, EMA, ADX, and price momentum. Colo
Description: Candle Time is a simple and effective tool that shows the remaining time until the current candle closes — directly on your chart. Whether you’re trading fast moves or waiting for confirmations, knowing exactly when the candle ends helps you stay sharp. Main Features: Real-time countdown for the current candle Color adapts to candle direction (bullish, bearish, or neutral) Adjustable font, size, color source, position, and thickness Supports Visual Mode in the Strategy
FREE

SMC Trend Momentum – Adaptive Trend and Momentum Oscillator SMC Trend Momentum is a momentum oscillator plotted in a separate window.
The indicator combines a Donchian position bias with a ZigZag leg normalization and transforms this into a smoothed, color‑coded histogram for assessing trend direction and momentum changes. Optionally, a higher timeframe filter can be applied. The indicator is designed to be flexible for different trading styles (short‑term, swing, indices, FX) using ready‑to‑u
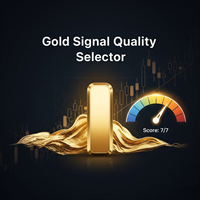
Gold Signal Quality Selector Stop Guessing. Start Trading Gold with Institutional-Grade Clarity. Are you tired of the chaotic nature of the Gold (XAUUSD) market? Frustrated with generic indicators that generate endless false signals and drain your capital? The truth is, Gold doesn't move like other assets. It demands a specialized tool built for its unique volatility and personality. It's time to stop using one-size-fits-all tools and start trading with an intelligent edge. Introducing Gold Sign
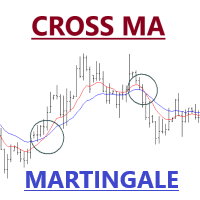
Expert Advisor of Cross two moving averages accompanied by stop loss, take profit, martingale and multi timeframes on each moving averages. You can change all the parameters contained in the moving averages
Please use as appropriate, hopefully can be useful and assist you in the transaction Don't forget to give a review if this product helps you
MA Method 0 = simple 1 = exponential 2 = smoothed 3 = LW
FREE

Versión Beta El indicador técnico Non Lag MA MTF (Non-Lagged Moving Average Multi-Time Frame) es una versión avanzada del Non Lag MA que permite visualizar la media móvil en varios marcos temporales simultáneamente. Pros: - Visión integral: Proporciona una visión más completa al mostrar la media móvil en diferentes marcos temporales en un solo gráfico. - Anticipación de tendencias: Ayuda a anticipar cambios de tendencia al observar la convergencia o divergencia de las medias móviles en distint
FREE
Ratio X Breakout EA — Hassas Breakout Uygulaması Ratio X Breakout EA , mum kırılmaları ile tetiklenen yönlü hareketleri yakalamak için tasarlanmış otonom bir alım-satım sistemidir. Mantığı basit ama sağlamdır: kullanıcı tarafından tanımlanan bir referans mum çerçeveyi belirler ve EA yalnızca fiyat hareketi bu yapıyı net bir şekilde kırdığında piyasaya girer. Sonuç, açıklık ve uyarlanabilirlik için tasarlanmış disiplinli bir breakout metodolojisidir. Temel Metodoloji Sistemin merkezinde bir refe
FREE

Machine Learning Adaptive SuperTrend - Take Your Trading to the Next Level!
Introducing the Machine Learning Adaptive SuperTrend , an advanced trading indicator designed to adapt to market volatility dynamically using machine learning techniques. This indicator employs k-means clustering to categorize market volatility into high, medium, and low levels, enhancing the traditional SuperTrend strategy. Perfect for traders who want an edge in identifying trend shifts and market conditio
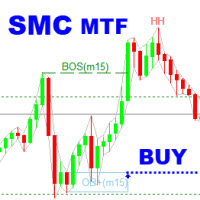
SMC Analyzer Multi-Timeframe is a powerful tool designed to help traders apply Smart Money Concepts (SMC) across multiple timeframes. This indicator identifies key structural points such as market structure shifts (Break of Structure and Change of Character), order blocks, fair value gaps (FVG), and liquidity zones from higher timeframes and overlays them onto the current chart. By aligning these critical SMC signals across multiple timeframes, traders gain a more comprehensive view of instituti

Introducing Gold Sniper for MT5 – Your Ultimate AI-Powered Trading Partner for XAUUSD (Gold)! Gold Sniper is a highly optimized Expert Advisor designed with AI-driven precision and Inner Circle Trading (ICT) concepts to target long-term success in GOLD (XAUUSD) trading.
This EA is engineered for safe , consistent trades , with no risky strategies , and each trade protected by a stop loss with spread taken into consideration . Live Results: [ See Gold Sniper in Action! ] Key Featu
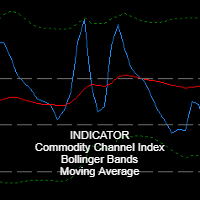
Main Indicator Description: RosMaFin Triple Insight CCI Navigator is an advanced technical indicator that combines the power of three popular indicators - CCI (Commodity Channel Index), Bollinger Bands, and Moving Average - in one comprehensive window. This versatile tool provides traders with a complex view of market conditions and helps identify potential trading opportunities with greater precision. Key Features: Display of all three indicators in one window for efficient analysis Fully custo
FREE

VWAP AI MT5 Expert Advisor — Precision Trading for US30, Gold & NASDAQ Overview:
VWAP AI is a powerful MetaTrader 5 Expert Advisor designed specifically for NASDAQ (US100) and US30 (Dow Jones) indices. Built for precision and performance, this EA leverages Volume Weighted Average Price (VWAP), combined with advanced adaptive algorithms and a smart martingale system to identify high-probability trade entries and exits on the M15 timeframe. This Expert Advisor leverages Artificial Intelligence tec

This is a volume indicator with the addition of a threshold level that can be set to a fixed value chosen personally or obtained from the average of the volume values themselves. The type of averaging method can be selected in the input parameters.
The input parameters are easy to interpret but let's examine them:
1 - Volume type Here you can select the type of volume you want to see represented and there are 2 choices, either TICK volume or REAL volume. Keep in mind that for forex, for examp
FREE
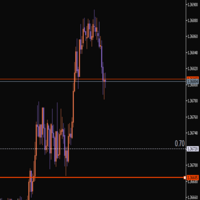
This indicator helps you set and adjust your stop-loss levels. Just move the line to where you usually place your stop, and a second line will automatically appear at a specified distance between the current price and your chosen level. Review your trades on historical data Measure the maximum drawdown from entry to exit Get data that allows you to optimize your stop-loss placement It’s a convenient way to train yourself to use more optimal stops, based on your own trading statistics.
FREE

AliPivot Points is a Meta Trader 5 Indicator that draws you the latest pivot points. You can choose from timeframes ranging from 1 Minute to 1 Month. Calculation methods for pivot points includes: Classic Pivot Points Camarilla Pivot Points Fibonacci Pivot Points Woodie Pivot Points You can personalize the line colors, style, and width to suit your preference. The indicator displays values on the right side of the chart. AliPivot Points values can also be utilized by developers for creating Expe
FREE

MT5 için Kolay Göstergeler
Göstergeleri daha kolay görselleştirmeye yardımcı olan çok basit bir araç. Referans göstergesi çok ince veya okunması zor ise özellikle yararlıdır.
Bu blogda desteklenen farklı gösterge türleri hakkında bilgi edinebilirsiniz (renk tamponlu göstergeler mevcut değildir): Sıfır çizgi geçişleri İki Hat haçları Tampon aktivasyonları Filtre ile sıfır çizgi kesişir Fiyat ile kesişir (MA'lar) Filtrenin içinde çaprazlar
FREE
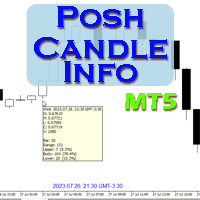
Show candle info with: Time in selected timezone Bar number Candle range points Upper wick points and percentage Body points and percentage Lower wick points and percentage Mark large/small candle body with customizable line. Settings group: Broker and local timezone. Lookback bars for candle marking. Large candle body Small candle body Date and time info with auto position or custom the x and y coordinate.
FREE

The underlying strategy of this indicator is based on identifying momentum in the market and attempting to capture the direction of the trend through transitions between bullish and bearish moments. Utilizing bands around the RWMA allows for identifying potential overbought and oversold situations in the market.
1. Calculation of the Range Momentum Index (RMI): The RMI is based on a combination of the Relative Strength Index (RSI) and the Money Flow Index (MFI), both of which are momentum indi

Weis Wave Volume Indicator for MetaTrader 5 (MT5) Check all of our products here: All Products Specifications Platform: MetaTrader 5 (MT5)
Type: Custom Technical Trading Indicator
Level: Intermediate
Timeframes: All Timeframes (Multi-Timeframe Support)
Trading Styles: Scalping, Day Trading, Swing Trading, Position Trading
Markets: Forex, Stocks, Commodities, Indices, and Cryptocurrencies What Does This Indicator Do? The Weis Wave Volume Indicator for MT5 is a powerful Price Action + V

Singgasana Galunggung MT5 is a special expert advisor for USDJPY. This EA is designed with breakout triangle method (my secret) for entry position. This EA is a single entry method use stop loss and take profit.
Performance : While past results don't guarantee future performance, the EA has been tested at various backtest levels. Please do your own research! Price $ 30 only for promotion. Price will increase over time.
Key Features : No History Reader : EA result doesn't manipulation data
Optimized Trend Tracker (OTT) Indicator The Optimized Trend Tracker (OTT) is a custom indicator designed to visualize trend direction and potential changes based on a configurable moving average and dynamic support/resistance levels. It provides multiple visualization and signal options, making it suitable for discretionary analysis or integration into automated systems. Key Features Configurable Moving Average Types
Supports SMA, EMA, WMA, TMA, VAR, WWMA, ZLEMA, and TSF for flexible calculatio

Position Limiter EA: Control Your Risk, Maximize Your Strategy Are you tired of manually managing your trades across multiple symbols? Do you want to ensure you never exceed your risk limits? Introducing the Position Limiter EA for MetaTrader 5! This powerful Expert Advisor automatically monitors all your open positions and pending orders for each symbol on your account. You set the maximum number of trades allowed per symbol, and the EA takes care of the rest. If the number of trades exceeds yo
FREE

"Wouldn't we all love to reliably know when a stock is starting to trend, and when it is in flat territory? An indicator that would somehow tell you to ignore the head fakes and shakeouts, and focus only on the move that counts?" The Choppiness Index is a non-directional indicator designed to determine if the market is choppy (trading sideways) or not choppy (trading within a trend in either direction). It is an oscillating indicator between -50 (very trendy) and +50 (very choppy). There are man

Rebate System performs a large number of trades with the minimum profit, which gives the opportunity to earn from receiving rebates (returning part of a spread). It is based on two grids (buy and sell), when one of them is in a drawdown, the other one can enter with an increased lot size, keeping the account away from the drawdown. Differences from the usual EA Rebate System in the mode of closing long-term losing trades in one of the grids due to the previously received profit. Input parameters

VelocityX is a manual trade execution panel for MetaTrader 5. It provides instant order placement with automatic position sizing, structure-based stop loss targets, and built-in risk management protocols. Core Execution Smart Structure Buttons: Three pre-set Stop Loss distances (COLOURED: Gold, Silver, Bronze) calibrated to market structure. Auto-Calculation: Automatically calculates lot size based on your defined risk percentage. Instant Entry: Immediate market entry with a single click. Asset
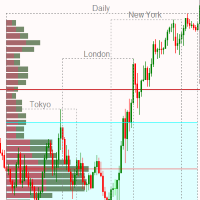
Market Session and Volume Profile Indicator A Professional Trading Tool for Advanced Market Analysis This sophisticated indicator combines Market Session Analysis with Volume Profile Technology to provide traders with critical market structure insights. Volume Profile is one of the most powerful analytical tools used by institutional traders and market makers to identify key price levels where significant trading activity occurs. Key Features: Volume Profile Analysis: POC (Point of Control) - I
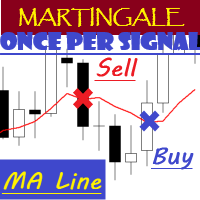
EA "MA Line" with martingale feature
EA will open position once per signal
To see how EA works, please watch the video below. In the video, I perform parameter optimization and do a backtest. The parameters that are optimized are: - MA Period - Stop Loss - Take Profit
For the future, I will try to optimize and test EA, especially the expert advisors in the mql5 community. hopefully it can be useful for colleagues in the mql5 community.
FREE
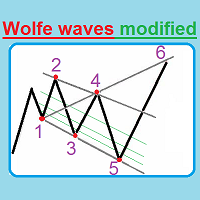
This unique indicator automatically builds Wolfe Waves and features a highly efficient trading strategy. Use If number 5 appears, wait till the first candle is closed behind Moving Average, then look at the three center lines showing what lot volume should be used if the fifth dot crossed the line 25%. The candle is closed behind Moving Average, and then we open a trade with the lot: = (Let's apply the lot of, say, (0.40), divide it into four parts and open a quarter of the lot (0.10)). If the

Bears Graph is a fully automatic, professional trading robot. Designed specifically for the foreign exchange market GBPUSD, time frame M30 . This EA does not need to configure parameters. Ready to work on GBPUSD M30 . You only need to decide on the choice of the lot. Default lot is 0.1 points. Trade smarter and safer with Bears graph! Our revolutionary trading EA has a smart algorithm which detect the trend, filter out market noise and make the most accurate decisions. Enjoy maximum capital
FREE

# SamuraiFX Combined Pro V14 **Master Market Turns with Real-Time Volume & Structure**
Stop guessing where the market will turn. The **SamuraiFX Combined Pro** is a comprehensive trading system that combines **Daily Structure**, **Volume Flow**, and **Price Action** into a single, non-repainting dashboard. It helps you identify high-probability Reversals and powerful Breakouts without the lag of traditional indicators.
### **Key Advantages**
* **No Lag, No Repaint:** Signals are generated in

ATR Progress Control
Trading is all about probability, and if you don't know how much range the price has left today, you're trading blind.
This indicator is your dashboard that answers the most important question before a trade: does it make mathematical sense to enter the market right now? It's a tool for professional volatility analysis that helps filter out false entries and avoid trades when the move is already exhausted.
What's the problem?
Imagine that the average daily movement (ATR

Guardian Equity PropFirm EA for MetaTrader 5 Guardian Equity PropFirm is an Expert Advisor designed to automatically enforce daily and monthly loss limits. It is especially useful for accounts subject to strict risk management rules, such as those required by proprietary trading firms. The EA continuously monitors the account and performs automated actions if predefined thresholds are exceeded. Key Features Daily loss control: Set a maximum daily loss percentage (e.g., 4%). Monthly loss c

EquityGuard AI - Advanced Account Protection System Description EquityGuard AI is a professional account monitoring tool designed to protect your trading capital through automated equity surveillance and instant response mechanisms. Message me after purchase to get an additional program that disables the Algo Trading button when Equity Breach Detected . This additional program requires "Allow DLL imports" .
Key Features Equity Protection Real-time equity monitoring with customizable check

Trend Regularity Adaptive Moving Average Indicator for MT5
TRAMA Indicator for MT5 Overview
The Trend Regularity Adaptive Moving Average (TRAMA) is an intelligent adaptive moving average that dynamically adjusts its sensitivity based on market structure and trend consistency. Unlike standard moving averages, TRAMA reacts to how frequently new highs or lows are formed within a defined period, providing an adaptive balance between trend-following precision and range stability. How It Works
TRAM

Description The Profit and Loss Indicator by Creative Tech Solutions is a robust and comprehensive tool designed to help traders monitor their trading performance in real-time. This indicator provides detailed metrics on profits and drawdowns, ensuring traders are always informed about their trading activities and performance. With customisable alerts and display settings, this indicator is an essential tool for any serious trader. Features Real-Time Metrics : Monitor profit and drawdown percent
FREE

This is the demo version of "All Harmonics 26" indicator . "All Harmonics 26" searches for 26 types of harmonic patterns and outputs them in a convenient way. You can check out the documentation here . This demo version has the following limitations: The indicator searches only for one type of harmonic patterns out of 26:- Gartley. The indicator outputs new patterns with a lag of 10 bars.
FREE

Trendlines with Breaks Overview The Trendlines with Breaks indicator automatically detects and plots pivot-based trendlines, dynamically adjusting their slope and steepness to highlight significant breakout events. Designed for traders who rely on price action and market structure , this tool provides an automated, real-time way to track evolving momentum and breakout confirmations . How It Works The indicator identifies swing highs and swing lows , connecting them to form adaptive trendlines ba

ZigZag Trader EA - Intelligent ZigZag Trading Assistant
Introduction ZigZag Trader EA is a fully automated trading assistant based on the ZigZag indicator. It intelligently identifies previous highs and lows of the ZigZag indicator, combined with an advanced risk management system, to provide you with precise trading signals and automated trade execution. Whether you are a novice or experienced trader, ZigZag Trader EA can help you simplify trading decisions and achieve stable trading performa
FREE

This is a tool created for scalping. it can generate pending orders with 4 input: 1. Volume : Lot for the Pending Orders 2. Distance : Distance within the Orders in Points 3. Total Order : Total Generated Orders 4. Take Profit : TP for the generated Orders in Points 5. Stop Loss : SL for the generated Orders in Points It also have another tools which can monitor the floating and close at defined profit using Closed at Profit Input What's new: - Stop Loss in Pip
FREE

Advanced Trend Builder is a trend indicator using the original calculation algorithm. ATB can be used on any data and timeframe. My recommendation use for calculation numbers 4 - 16 - 64 - 256 and so on ..., but this is only recommendation. The middle of the trend wave is a special place where market behavior is different, when developed ATB was main idea to find the middle of the wave trend. Input parameters: Bars will be used for calculation - number of bars used for a trend line calculation.
FREE
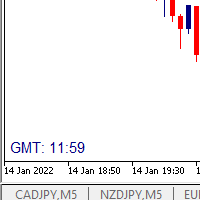
I wrote a small label to show GMT time. I t helps me to know the trading hours in Europe. I searched in the market but couldn't find it, hope it helps those who need it.
Functions: X_: Horizontal distance from border. Y_: Vertical distance from border. FontType: label color. FontSize : label font. Color3 : label color. WhatCorner : which chart corner will be drawn. If you have any request or errors please tell me to help it better.
Donate us , Thank u!
Telegram: 0388894014
FREE

Property of Vertical Capital Edition: Gugol_Quants About USA INDEXES QUANT_INDICATOR: This is a indicator created by math modulation to be used as a trading tool, which was developed in MQL. (MT5) This indicator is for use only with US500(S&P500), NAS100(Nasdaq Composite) and US30(Dow Jones). Signals are activated on "Open" Candle. It’s based on Intraday/Swing Trades whose main timeframe is H1, H2, H3 and H4. However you can use it with other assets by testing with the appropriate settings. *
FREE

This indicator displays fractal symbols and bars Use this indicator to show different symbols for bearish and bullish fractals: Choose from 144 symbols (refer to table below) Colors, size and offset of fractals can be modified Fractal price bar or candle color can be changed Hide fractals and show fractal price bar only Frequency in fractal calculation can be changed
How to use 1. Select which symbols to use for bearish and bullish fractals; 2. Select which colors to use for bearish and bullis
FREE

Structure Levels (Highs & Lows) Indicator for MetaTrader 5
Decode Market DNA — Trade with Institutional Precision Description:
The Structure Levels (Highs & Lows) Indicator is your secret weapon to map the market’s hidden roadmap. Designed for traders who think in terms of price action and market structure, this tool automatically identifies critical swing highs and swing lows, transforming chaotic charts into a clear blueprint of support/resistance zones, breakout opportunities, and trend rev

Apex Swing VWAP is an advanced indicator for MetaTrader 5 that combines VWAP (Volume Weighted Average Price) analysis with automatic detection of significant swing points. This combination provides accurate market sentiment insight and potential reversal points. Key Features Integrated Technical Analysis - Dynamic VWAP from relevant swing points - Historical VWAP for long-term trend analysis - Multiple configurable VWAP periods
Recommended Trading Types - Swing Trading for medium-term trends -

I’m sharing this EA here for free to support the trading community. I hope it’s helpful, and don’t hesitate to reach out if you have any questions or feedback!
Requirements
Trading pairs all trending Pairs especially USDJPY
Timeframe M1 to H6
Minimum deposit $ 100 Leverage 1:200 Brokers Hedging Pro or ECN Account
Key Features: 1. Good Risk Management: Mono MA ensures your capital is always protected with its sophisticated risk management system. It calculates risk as a percentage of your acco
FREE

Symbol: EURUSD Timeframe: M1,M5,M15 Recomended: M5 No dangerous strategies Fixed TP and SL No trade very often Recomended settings: deafult Recomended lot size: Deposit Lot size 1000€. 0.02 2000€. 0.04 5000€. 0.1 10000€. 0.2 Backtest 2020-2024 till now Please use good risk and money manegement Possible to set money and account protections If you need help or other recomendations please ask me More info: https://www.mql5.com/en/users/martin6223 Check my other products
FREE

What is The Waiter ?
It is an automated system to always be ready to catch the big movements of the market
How does it work?
Set the mode (stop or limit) Set the pending orders distance Set Take Profit / Stop Loss Wait for the big candle
settings:
entry : 0.OFF (the expert advisor won't operate. only for chart info purposes.) 1.New candle, new STOP orders (each new candle two stop orders are placed. If they are not activated by the end of the candle, they will be cancelled) 2.New candle, new
FREE

NeuraVault Pro v1.0 - Profesyonel RSI Dönüş Ticaret Sistemi Genel Bakış NeuraVault Pro, RSI (Göreceli Güç Endeksi) dönüşlerine dayanan profesyonel bir otomatik ticaret sistemidir. Aşırı alım ve aşırı satım bölgelerindeki dönüş fırsatlarını yakalamak için tasarlanmış, gelişmiş filtreler ve kapsamlı risk yönetimi özellikleri ile donatılmıştır. Ticaret Mantığı Temel Strateji: RSI Dönüşü EA, piyasa aşırı alım veya aşırı satım bölgelerine ulaştığında dönüş fırsatlarını yakalar: ALIŞ Sinyali: RSI değe
FREE

Fibonacci Trend Indicator for MT5 Unlock the power of Fibonacci analysis on your MetaTrader 5 charts!
Our Fibonacci Trend Indicator automatically plots dynamic support and resistance levels so you can spot trends, reversals, and breakout opportunities at a glance. Features & Advantages Automatic Fibonacci Levels
Instantly displays seven key Fibonacci retracement levels based on the highest and lowest prices from your chosen lookback period — no manual work required. Dynamic Trend Adaptatio
FREE

Smart Watermark Displays current symbol + timeframe Shows account name (or custom text) Customizable font/color/position One-Click Tools Timeframe Switcher: Quick-access buttons (M1 to D1) Drawing Tools: Create horizontal lines, trendlines, and Fibonacci retracements with consistent sizing Object Cleanup: "Delete" button removes all indicator-created drawings Pips Meter Real-time P/L tracking in pips Color-coded (green/red) for profit/loss Supports magic number filtering Chart Zoom Contro
FREE

Candle de Volume Coiote O Candle de Volume Coiote é um indicador que mede a variação do volume no tempo, seu corpo é pela variação do volume anterior pelo volume atual, sua direção pelo fechamento do preço.
1. identificado um topo no indicador Candle de Volume Coiote (marcado o fechamento do preço).
2. identificado um fundo no indicador Candle de Volume Coiote (marcado o fechamento do preço).
3. fundo 3 igual fundo 2 no indicador Candle de Volume Coiote, preço no 3 é diferente de fundo 2.
P
FREE

BinaWin NoTouch is an indicator that sends an alert signal when the trade is in the right position to wait for the breakdown of a side market.
It is specially designed to trade under the “No Touch” strategy of the Binary.Com platform with synthetic indexes N.10, N.25, N.50, N.75 and N.100
Similarly, trading can be done with the conventional CALL and PUT strategy of any Binary Options platform.
Requirements to use the indicator:
1. Have an account at Binary.Com
2. Configure the Binary.Com d
FREE

Gold Surge AI – Buy-Only EA for XAU/USD OPTIMIZATION MADE FOR THE VTMARKETS BROKER!!!
Precision auto-trading with trend logic, hybrid stop loss and intelligent risk management Launch Price: 149 USD (for a limited time) What is Gold Surge AI? Gold Surge AI is a fully automated Buy-Only Expert Advisor designed specifically for XAU/USD on MetaTrader 5.
It trades bullish momentum using a multi-timeframe strategy and conservative risk logic suitable for prop firm trading and long-term consistency.

The "Deviation Scaled Moving Average Crosses" indicator is a powerful technical analysis tool designed for the MetaTrader 5 trading platform. It facilitates informed trading decisions by visually presenting the interaction between two moving averages, both of which are smoothed and scaled to offer enhanced insights into market trends. This custom indicator is developed by mladen and is copyright-protected for the year 2023.
Using a unique approach, the indicator displays two types of deviation
FREE

MultiTrend Commander - Automated Trading System What is it? An automated trading software that:
Intelligently identifies market trends
Makes decisions based on multiple timeframes
Automatically manages risk
What does it do? Identify Trends Analyze the market in real time
Combine signals from different time frames (15 min, 1 hr, 4 hr)
Confirm the trend direction before entering
Protect Your Capital Automatically calculates stop losses
Adjusts trade size to your risk
Stops trading if
FREE

MetaTrader 5 (MT5) için Wormhole Zaman Çerçevesi Göstergesi , sadece başka bir ticaret aracı değil—finansal piyasalarda sizin rekabet avantajınızdır. Hem yeni başlayanlar hem de profesyonel yatırımcılar için tasarlanan Wormhole, veri analiz etme ve karar verme yöntemlerinizi dönüştürerek her zaman bir adım önde olmanızı sağlar. Wormhole Göstergesine Neden İhtiyacınız Var? Rekabeti Geride Bırakın: Aynı grafik üzerinde aynı anda iki zaman çerçevesini görebilme yeteneği, her zaman bir adım önde olm
FREE

️ PropProtector for MetaTrader 5 The Ultimate Protection for Your Prop Trading Account Why PropProtector? Prop trading firms have strict rules: Daily loss limits, maximum drawdowns, limited trade counts, trading restrictions before news events. A single mistake can cost you your account! PropProtector monitors your account 24/7 and automatically intervenes before you violate any rules. Main Features Daily Loss Limit Percentage or fixed amount Automatic closure of all trades Early warn
FREE
MetaTrader mağazası, geliştiricilerin alım-satım uygulamalarını satabilecekleri basit ve kullanışlı bir sitedir.
Ürününüzü yayınlamanıza yardımcı olacağız ve size Mağaza için ürününüzün açıklamasını nasıl hazırlayacağınızı anlatacağız. Mağazadaki tüm uygulamalar şifreleme korumalıdır ve yalnızca alıcının bilgisayarında çalıştırılabilir. İllegal kopyalama yapılamaz.
Alım-satım fırsatlarını kaçırıyorsunuz:
- Ücretsiz alım-satım uygulamaları
- İşlem kopyalama için 8.000'den fazla sinyal
- Finansal piyasaları keşfetmek için ekonomik haberler
Kayıt
Giriş yap
Gizlilik ve Veri Koruma Politikasını ve MQL5.com Kullanım Şartlarını kabul edersiniz
Hesabınız yoksa, lütfen kaydolun
MQL5.com web sitesine giriş yapmak için çerezlerin kullanımına izin vermelisiniz.
Lütfen tarayıcınızda gerekli ayarı etkinleştirin, aksi takdirde giriş yapamazsınız.