Robots comerciales e indicadores para MetaTrader 5 - 90

EAVN005 - Operando con el Indicador RSI "La imagen en Tap Screenshots muestra el resultado de una optimización para XAUUSD en el timeframe M15, configurado con parámetros de sólo COMPRA. Puede considerar ajustar los parámetros cuando opere con XAUUSD, ya que la tendencia reciente favorece la apertura de órdenes de COMPRA." ️ Guía de instalación Configuración General Nombre del EA : El nombre del Asesor Experto. Número Mágico : Asigna un Número Mágico único para cada gráfico para evitar conflict
FREE

MTF MA Dashboard Pro v1.04 - Español MTF MA Dashboard Pro v1.04 - Analizador Profesional de Medias Móviles Multi-Timeframe Indicador técnico avanzado para MT5 que proporciona análisis completo de medias móviles multi-timeframe con detección inteligente de Cruce Dorado/Cruce de la Muerte y panel visual totalmente personalizable. ¡Deja de cambiar entre timeframes! Analiza hasta 4 timeframes simultáneamente y detecta alineaciones de tendencia al instante. CARACTERÍSTICAS PRINCIPALES ANÁLI
FREE

//////////////////////////////////////////////// //////////////////////////////////
Una versión mejorada de los indicadores estándar Bulls Power y Bears Power.
Ahora son dos en uno.
La configuración es simple - sólo tiene que especificar el período. También es muy fácil entender las lecturas de este indicador, una señal por encima de cero es una compra, y por debajo es una venta.
//////////////////////////////////////////////// ///////////////////////////////////
Espero que este indicador
FREE

Este indicador trazará dos líneas para representar el valor del ajuste, que puede utilizarse tanto en el Dólar como en el Índice.
La principal ventaja de este indicador es que tiene dos líneas, una que representa el ajuste calculado a partir del día anterior y la otra que representa el ajuste calculado en el día actual. El cálculo del ajuste en el día actual es un gran diferencial, ya que será posible realizar operaciones para dormir comprado o vendido de acuerdo con el ajuste.
Não é necessár
FREE

Muestra la dirección de la tendencia basándose en datos parabólicos, desde un minuto hasta mensuales. Puede ver inmediatamente en qué dirección se mueve el precio, ya que se muestra desde 1 minuto hasta mensual .
Los gráficos no se actualizan cada tick, sino cada segundo por defecto, y por supuesto usted puede cambiar esto para que la visualización del gráfico nunca se ralentice.
Características:
Permite mostrar cualquier divisa.
Se puede especificar el color de los iconos.
Se puede cambi
FREE

RSI Divergence Lite (Gratis) - MT5 Indicador ------------------------------------------------- Esta es la versión Lite (gratuita) de RSI Divergence.
- Detecta divergencias básicas alcistas y bajistas entre el precio y el RSI. - Funciona sólo en M15 timeframe - Sin líneas de divergencia, sin alertas - Ajustes internos fijos (RSI 14, sensibilidad al pivote, umbrales) - Para fines educativos y de prueba
Para la versión completa PRO (multi-marco de tiempo, alertas, líneas de divergencia, interfaz
FREE

1. Mover SL a BE On/Off: permitir a EA mover SL a BE o no permitir. 2. 2. Modo BE: BE orden simple: mueve SL de orden simple cuando la condición coincide. BE orden múltiple: Mueve el SL de múltiples órdenes en base al BE de múltiples órdenes. 3. 3. Mover SL a BE cuando beneficio >= (pips): establece cuantos pips quieres que EA mueva SL a BE cuando beneficio. 4. Añadir valor desde BE: número de pips que quieres añadir desde BE (offset). 5. Alerta audible: activar/desactivar la alerta audible. 6.
FREE

Advanced Trade Mirror es una potente herramienta de Forex diseñada para operadores que necesitan replicar operaciones de forma instantánea y sin interrupciones en varios terminales de la misma máquina. Con una ejecución ultrarrápida, garantiza cero retrasos en la copia de operaciones, manteniendo la precisión y la eficiencia en entornos de negociación de alta velocidad.
Consiga el Trade Mirror Follower aquí: https: //www.mql5.com/en/market/product/133890 Especificaciones:
Master ID: Valor de ide
FREE
Este código MQL4 es un indicador personalizado que dibuja múltiples rectángulos de colores en un gráfico, espaciados por una distancia definida pip, y proyectado en el futuro. He aquí un breve desglose: Propósito: Dibuja varios rectángulos horizontales (zonas) a partir de un precio especificado. Los rectángulos están separados verticalmente por una distancia de pips. Los colores alternan entre PrimerColor y SegundoColor . Los rectángulos pueden ser dibujados detrás de las velas y opcionalmente r
FREE

ScalpReactor X Un indicador táctico para operadores de precisión El Ritz Scalping Habbit es un potente indicador de MT5 diseñado para ayudar a los operadores a ejecutar operaciones disciplinadas y de alta probabilidad mediante señales visuales claras y confirmaciones multiestrategia. Tanto si es un scalper intradía como un swing trader , esta herramienta integra análisis de mercado avanzados en una interfaz única y fácil de usar. Puntos fuertes: Flechas inteligentes de compra y venta - Basadas
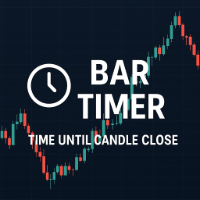
Descripción: Candle Time es una herramienta simple y eficaz que muestra el tiempo restante hasta el cierre de la vela actual - directamente en su gráfico. Ya sea que esté operando movimientos rápidos o esperando confirmaciones, saber exactamente cuándo termina la vela le ayuda a mantenerse alerta. Características principales: Cuenta atrás en tiempo real para la vela actual. El color se adapta a la dirección de la vela (alcista, bajista o neutral) Fuente, tamaño, fuente de color, posic
FREE

SMC Trend Momentum - Oscilador adaptativo de tendencia y momento SMC Trend Momentum es un oscilador de impulso que se traza en una ventana independiente.
El indicador combina un sesgo de posición Donchian con una normalización de tramo ZigZag y lo transforma en un histograma suavizado y codificado por colores para evaluar la dirección de la tendencia y los cambios de impulso. Opcionalmente, se puede aplicar un filtro de marco temporal superior. El indicador está diseñado para ser flexible para
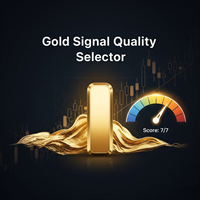
Selector de calidad de la señal Gold Deje de adivinar. Empiece a operar en oro con claridad institucional. ¿Está cansado de la naturaleza caótica del mercado del oro (XAUUSD)? ¿Frustrado con indicadores genéricos que generan interminables señales falsas y drenan su capital? La verdad es que el oro no se mueve como otros activos. Exige una herramienta especializada construida para su volatilidad y personalidad únicas. Es hora de dejar de utilizar herramientas de talla única y empezar a operar con
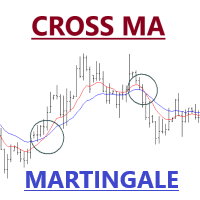
Expert Advisor de Cross dos medias móviles acompañado de stop loss, take profit, martingala y multi timeframes en cada media móvil. Puede cambiar todos los parámetros contenidos en las medias móviles
Por favor, utilice según corresponda, espero que pueda ser útil y le ayudará en la transacción No olvide dar una reseña si este producto le ayuda
Método MA 0 = simple 1 = exponencial 2 = suavizado 3 = LW
FREE

Versión Beta El indicador técnico Non Lag MA MTF (Non-Lagged Moving Average Multi-Time Frame) es una versión avanzada del Non Lag MA que permite visualizar la media móvil en varios marcos temporales simultáneamente. Pros: - Visión integral: Proporciona una visión más completa al mostrar la media móvil en diferentes marcos temporales en un solo gráfico. - Anticipación de tendencias: Ayuda a anticipar cambios de tendencia al observar la convergencia o divergencia de las medias móviles en distint
FREE
Ratio X Breakout EA — Ejecución Precisa de Rupturas
Importante: Guía completa de configuración disponible en la sección de Comentarios después de la compra.
Descripción General Ratio X Breakout EA es un sistema de trading autónomo diseñado para capturar movimientos direccionales desencadenados por rupturas de velas. Su lógica se centra en una vela de referencia definida por el usuario que establece el marco, y el EA entra al mercado cuando la acción del precio rompe decisivamente esa estructur
FREE

Supertendencia adaptativa de aprendizaje automático: ¡lleve sus operaciones al siguiente nivel!
Presentamos el Machine Learning Adaptive SuperTrend , un indicador de trading avanzado diseñado para adaptarse a la volatilidad del mercado de forma dinámica mediante técnicas de aprendizaje automático. Este indicador emplea la agrupación de k-means para categorizar la volatilidad del mercado en niveles alto, medio y bajo, mejorando la estrategia SuperTrend tradicional. Perfecto para los ope
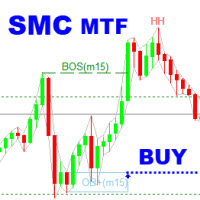
SMC Analyzer Multi-Timeframe es una potente herramienta diseñada para ayudar a los operadores a aplicar los Conceptos de Dinero Inteligente (SMC) en múltiples marcos temporales. Este indicador identifica puntos estructurales clave, como cambios en la estructura del mercado (ruptura de estructura y cambio de carácter), bloqueos de órdenes, brechas de valor razonable (FVG) y zonas de liquidez de plazos superiores, y los superpone en el gráfico actual. Al alinear estas señales críticas del SMR en m

Presentamos Gold Sniper para MT5 - ¡Tu mejor socio de trading para XAUUSD (Oro)! Gold Sniper es un Asesor Experto altamente optimizado diseñado con precisión impulsada por IA y conceptos de Inner Circle Trading (ICT) para apuntar al éxito a largo plazo en el comercio de ORO (XAUUSD).
Este EA está diseñado para operaciones seguras y consistentes , sin estrategias arriesgadas , y cada operación protegida por un stop loss con spread tomado en consideración . Resultados en vivo: [¡Vea a Gold S
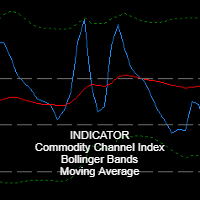
Descripción del indicador principal: RosMaFin Triple Insight CCI Navigator es un indicador técnico avanzado que combina el poder de tres indicadores populares - CCI (Commodity Channel Index), Bandas de Bollinger y Media Móvil - en una ventana integral. Esta versátil herramienta proporciona a los operadores una visión compleja de las condiciones del mercado y ayuda a identificar posibles oportunidades de negociación con mayor precisión. Características principales: Visualización de los tres indic
FREE

VWAP AI MT5 Expert Advisor - Precision Trading para US30, Oro y NASDAQ Visión general:
VWAP AI es un potente Asesor Experto para MetaTrader 5 diseñado específicamente para los índices NASDAQ (US100) y US30 (Dow Jones). Construido para la precisión y el rendimiento, este EA aprovecha el precio medio ponderado por volumen (VWAP), combinado con algoritmos adaptativos avanzados y un sistema de martingala inteligente para identificar las entradas y salidas de comercio de alta probabilidad en el marco

Se trata de un indicador de volumen con el añadido de un nivel de umbral que puede fijarse en un valor fijo elegido personalmente u obtenerse a partir de la media de los propios valores de volumen. El tipo de método de promediación puede seleccionarse en los parámetros de entrada.
Los parámetros de entrada son fáciles de interpretar, pero vamos a examinarlos:
1 - Tipo de volumen Aquí puede seleccionar el tipo de volumen que desea ver representado y hay 2 opciones, volumen TICK o volumen REAL.
FREE
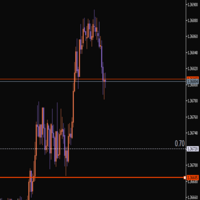
Este indicador le ayuda a fijar y ajustar sus niveles de stop-loss. Sólo tiene que mover la línea hasta el lugar donde suele colocar su stop, y automáticamente aparecerá una segunda línea a una distancia especificada entre el precio actual y el nivel elegido. Revise sus operaciones con datos históricos Mida la reducción máxima desde la entrada hasta la salida Obtenga datos que le permitan optimizar la colocación de su stop-loss Es una forma cómoda de entrenarse para utilizar stops más óptimos, b
FREE

AliPivot Points es un indicador de Meta Trader 5 que le muestra los últimos puntos de pivote. Puede elegir entre marcos de tiempo que van desde 1 minuto a 1 mes. Los métodos de cálculo para los puntos pivote incluyen: Puntos Pivote Clásicos Puntos Pivote Camarilla Puntos Pivote Fibonacci Puntos Pivote Woodie Puede personalizar los colores, el estilo y la anchura de las líneas según sus preferencias. El indicador muestra los valores en la parte derecha del gráfico. Los valores de los Puntos AliPi
FREE

Indicadores fáciles para MT5
Una herramienta muy sencilla para ayudar a visualizar indicadores más fácilmente. Especialmente útil si el indicador de referencia es muy sutil o difícil de leer.
En este blog puede leer sobre los diferentes tipos de indicadores compatibles (los indicadores con búfer de color no están disponibles): Cruces de línea cero Cruces de dos líneas Activaciones de búfer Cruces de línea cero con filtro Cruces con precio (MAs) Cruces dentro del filtro
FREE
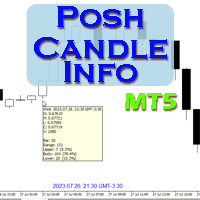
Mostrar información de la vela con: Hora en la zona horaria seleccionada Número de barra Puntos de rango de la vela Puntos y porcentaje de la mecha superior Puntos y porcentaje del cuerpo Puntos y porcentaje de la mecha inferior Marcar cuerpo de vela grande/pequeño con línea personalizable. Grupo de ajustes: Broker y zona horaria local. Barras de retroceso para marcar velas. Cuerpo de vela grande Cuerpo de vela pequeño Información de fecha y hora con posición automática o personalizada de las co
FREE

La estrategia subyacente de este indicador se basa en identificar el impulso en el mercado e intentar captar la dirección de la tendencia a través de las transiciones entre momentos alcistas y bajistas. La utilización de bandas alrededor de la RWMA permite identificar posibles situaciones de sobrecompra y sobreventa en el mercado.
1. Cálculo del Range Momentum Index (RMI): El RMI se basa en una combinación del Relative Strength Index (RSI) y el Money Flow Index (MFI), ambos indicadores de mome

Indicador Weis Wave Volume para MetaTrader 5 (MT5) Consulte todos nuestros productos aquí: Todos los productos Especificaciones Plataforma: MetaTrader 5 (MT5)
Tipo de indicador Indicador técnico personalizado
Nivel: Intermedio Intermedio
Plazos: Todos los plazos (Soporte Multi-Tiempo)
Estilos de negociación: Scalping, Day Trading, Swing Trading, Position Trading
Mercados: Divisas, Acciones, Materias Primas, Índices y Criptomonedas ¿Qué hace este indicador? El Indicador Weis Wave Volum

Singgasana Galunggung MT5 es un asesor experto especial para USDJPY. Este EA está diseñado con el método de triángulo de ruptura (mi secreto) para la posición de entrada. Este EA es un solo método de entrada uso stop loss y take profit.
Rendimiento : Aunque los resultados pasados no garantizan el rendimiento futuro, el EA ha sido probado en varios niveles de backtest. Por favor, ¡haga su propia investigación! Price $ 30 only for promotion. Price will increase over time.
Características princip
Indicador Optimized Trend Tracker (OTT) El Optimized Trend Tracker ( OTT) es un indicador personalizado diseñado para visualizar la dirección de la tendencia y los posibles cambios basados en una media móvil configurable y en niveles dinámicos de soporte/resistencia. Ofrece múltiples opciones de visualización y señalización, lo que lo hace adecuado para el análisis discrecional o la integración en sistemas automatizados. Características principales Tipos de medias móviles configurables
Admite S

Position Limiter EA: Controle su riesgo, maximice su estrategia ¿Está cansado de gestionar manualmente sus operaciones en múltiples símbolos? ¿Quiere asegurarse de que nunca excede sus límites de riesgo? ¡Presentamos el EA Limitador de Pos iciones para MetaTrader 5! Este potente Asesor Experto supervisa automáticamente todas sus posiciones abiertas y órdenes pendientes para cada símbolo en su cuenta. Usted establece el número máximo de operaciones permitidas por símbolo, y el EA se encarga del r
FREE

"¿No nos encantaría a todos saber de forma fiable cuándo un valor está comenzando una tendencia y cuándo está en territorio plano? ¿Un indicador que, de alguna manera, nos dijera que debemos ignorar las falsas cabezas y las sacudidas, y centrarnos sólo en el movimiento que cuenta?" El Choppiness Index es un indicador no direccional diseñado para determinar si el mercado está entrecortado (cotizando lateralmente) o no (cotizando dentro de una tendencia en cualquier dirección). Es un indicador osc

Rebate System realiza un gran número de operaciones con el mínimo beneficio, lo que da la oportunidad de ganar recibiendo rebates (devolviendo parte de un spread). Se basa en dos parrillas (compra y venta), cuando una de ellas está en drawdown, la otra puede entrar con un tamaño de lote aumentado, manteniendo la cuenta alejada del drawdown. Se diferencia del EA Rebate System habitual en el modo de cierre de operaciones perdedoras a largo plazo en una de las parrillas debido al beneficio recibido

VelocityX es un panel de ejecución manual de operaciones para MetaTrader 5. Proporciona colocación instantánea de órdenes con dimensionamiento automático de posiciones, objetivos de stop loss basados en estructuras y protocolos de gestión de riesgos incorporados. Ejecución básica Botones de Estructura Inteligente: Tres distancias de Stop Loss preestablecidas (COLOREADAS: Oro, Plata, Bronce) calibradas según la estructura del mercado. Auto-Cálculo: Calcula automáticamente el tamaño del lote en f
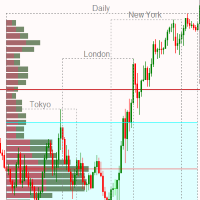
Indicador de Sesión de Mercado y Perfil de Volumen Una herramienta profesional para el análisis avanzado del mercado Este sofisticado indicador combina el análisis de la sesión de mercado con la tecnología de perfil de volumen para proporcionar a los operadores información fundamental sobre la estructura del mercado. El perfil de volumen es una de las herramientas analíticas más potentes que utilizan los operadores institucionales y los creadores de mercado para identificar los niveles de preci
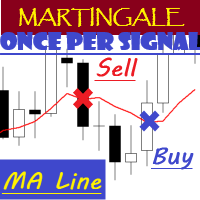
EA "MA Line" con función de martingala
EA abrirá la posición una vez por señal
Para ver cómo funciona el EA, por favor vea el vídeo a continuación. En el video, realizo la optimización de parámetros y hago un backtest. Los parámetros optimizados son - Periodo MA - Stop Loss - Take Profit
Para el futuro, voy a tratar de optimizar y probar EA, especialmente los asesores expertos en la comunidad mql5. Espero que pueda ser útil para los colegas de la comunidad mql5.
FREE
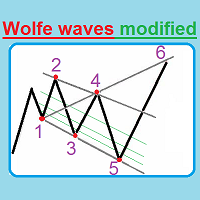
Este indicador único construye automáticamente Ondas de Wolfe y cuenta con una estrategia de negociación altamente eficiente. Utilice Si aparece el número 5, espere hasta que la primera vela se cierre detrás de Moving Average, luego mire las tres líneas centrales que muestran qué volumen de lote se debe utilizar si el quinto punto cruzó la línea 25%. La vela se cierra detrás de Moving Average, y luego abrimos una operación con el lote: = (Vamos a aplicar el lote de, digamos, (0,40), dividirlo en

Bears Graph es un robot de trading profesional totalmente automático. Diseñado específicamente para el mercado de divisas GBPUSD, marco de tiempo M30 . Este EA no necesita configurar parámetros. Listo para trabajar en GBPUSD M30 . Sólo tiene que decidir sobre la elección del lote. Lote por defecto es de 0,1 puntos. ¡Opere de forma más inteligente y segura con Bears graph! Nuestro revolucionario EA de trading tiene un algoritmo inteligente que detecta la tendencia, filtra el ruido del mercado y t
FREE

# SamuraiFX Combined Pro V14 **Maneja los Giros del Mercado con Volumen y Estructura en Tiempo Real**
Deje de adivinar dónde girará el mercado. El **SamuraiFX Combined Pro** es un completo sistema de trading que combina **Estructura Diaria**, **Flujo de Volumen**, y **Acción del Precio** en un único panel de control que no se repinta. Le ayuda a identificar Reversiones de alta probabilidad y Breakouts potentes sin el retraso de los indicadores tradicionales.
### Ventajas clave
* **No Lag, No

Control de Progreso ATR
Operar es cuestión de probabilidad, y si no sabes cuánto rango le queda al precio hoy, estás operando a ciegas.
Este indicador es su cuadro de mandos que responde a la pregunta más importante antes de una operación: ¿tiene sentido matemático entrar en el mercado ahora mismo? Es una herramienta de análisis profesional de la volatilidad que ayuda a filtrar las entradas falsas y a evitar las operaciones cuando el movimiento ya se ha agotado.
¿Cuál es el problema?
Imagin

Guardian Equity PropFirm EA para MetaTrader 5 Guardian Equity PropFirm EA es un Asesor Experto desarrollado para aplicar controles automáticos de pérdida diaria y mensual, especialmente útil en cuentas con reglas estrictas de gestión del riesgo, como las ofrecidas por empresas de fondeo. El EA supervisa de forma continua el estado de la cuenta y ejecuta acciones automáticas si se superan los límites definidos por el usuario. Características principales Control diario de pérdidas: Establece

EquityGuard AI - Sistema avanzado de protección de cuentas Descripción EquityGuard AI es una herramienta profesional de supervisión de cuentas diseñada para proteger su capital de negociación mediante mecanismos automatizados de vigilancia de la renta variable y respuesta instantánea. Envíeme un mensaje después de la compra para obtener un programa adicional que deshabilita el botón de Algo Trading cuando se detecta Equity Breach . Este programa adicional requiere "Permitir importaciones DLL" .

Indicador de Media Móvil Adaptativa de Regularidad de Tendencia para MT5
Indicador TRAMA para MT5 Visión general
La Media Móvil Adaptativa de Regularidad de Tendencia (TRAMA) es una media móvil adaptativa inteligente que ajusta dinámicamente su sensibilidad basándose en la estructura del mercado y la consistencia de la tendencia. A diferencia de las medias móviles estándar, TRAMA reacciona a la frecuencia con la que se forman nuevos máximos o mínimos dentro de un periodo definido, proporcionan

Descripción El Indicador de Pérdidas y Ganancias de Creative Tech Solutions es una herramienta robusta y completa diseñada para ayudar a los operadores a supervisar su rendimiento comercial en tiempo real. Este indicador proporciona métricas detalladas sobre los beneficios y las pérdidas, garantizando que los operadores estén siempre informados sobre sus actividades de negociación y su rendimiento. Con alertas personalizables y ajustes de visualización, este indicador es una herramienta esencial
FREE

Esta es la versión demo del indicador "All Harmonics 26 ". "All Harmonics 26" busca 26 tipos de patrones armónicos y los muestra de forma práctica. Puede consultar la documentación aquí . Esta versión demo tiene las siguientes limitaciones: El indicador sólo busca un tipo de patrón armónico de los 26: Gartley. El indicador emite nuevos patrones con un retardo de 10 barras.
FREE

Líneas de tendencia con rupturas Visión general El indicador Trendlines with Bre aks detecta y traza automáticamente líneas de tendencia basadas en pivotes, ajustando dinámicamente su pendiente e inclinación para resaltar los eventos de ruptura significativos. Diseñado para operadores que confían en la acción del precio y la estructura del mercado , esta herramienta proporciona una forma automatizada y en tiempo real de seguir la evolución del impulso y las confirmaciones de ruptura . Cómo funci

ZigZag Trader EA - Asistente Inteligente de Trading ZigZag
Introducción ZigZag Trader EA es un asistente de trading totalmente automatizado basado en el indicador ZigZag. Identifica de forma inteligente los máximos y mínimos anteriores del indicador ZigZag, combinado con un avanzado sistema de gestión de riesgos, para proporcionarle señales de trading precisas y una ejecución automatizada de las operaciones. Tanto si es un trader principiante como experimentado, ZigZag Trader EA puede ayudarle
FREE

Esta es una herramienta creada para scalping. Puede generar órdenes pendientes con 4 entradas: 1. Volumen : Lote para las órdenes pendientes 2. Distancia : Distancia dentro de las Órdenes en Puntos 3. Total Órdenes : Total de órdenes generadas 4. Take Profit : TP para las Órdenes generadas en Puntos 5. 5. Stop Loss: SL para las órdenes generadas en puntos. También tiene otras herramientas que pueden monitorear la flotación y cerrar con ganancias definidas usando la entrada Cerrado con Ganancias.
FREE

Advanced Trend Builder es un indicador de tendencia que utiliza el algoritmo de cálculo original. ATB se puede utilizar en cualquier dato y marco de tiempo. Mi recomendación es utilizar para el cálculo de los números 4 - 16 - 64 - 256 y así sucesivamente ..., pero esto es sólo una recomendación. El medio de la onda de tendencia es un lugar especial donde el comportamiento del mercado es diferente, cuando se desarrolló ATB fue la idea principal para encontrar el medio de la tendencia de onda. Par
FREE
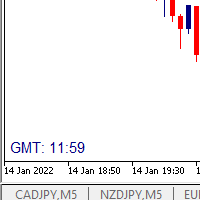
Escribí una pequeña etiqueta para mostrar la hora GMT. Me ayuda a saber el horario de negociación en Europa. Busqué en el mercado pero no lo encontré, espero que ayude a los que lo necesiten.
Funciones: X_: Distancia horizontal desde el borde. Y_: Distancia vertical desde el borde. FontType: color de la etiqueta . FontSize : tipo de letra de la etiqueta . Color3 : color de la etiqueta. WhatCorner : qué esquina del gráfico se dibujará. Si usted tiene alguna petición o error por favor dígame para
FREE

Propiedad del capital vertical Edición: Gugol_Quants Acerca de USA INDEXES QUANT_INDICATOR: Es un indicador creado por modulación matemática para ser utilizado como herramienta de trading, el cual fue desarrollado en MQL. (MT5) Este indicador es para uso exclusivo con US500(S&P500), NAS100(Nasdaq Composite) y US30(Dow Jones). Las señales se activan en la Vela de "Apertura". Se basa en Operaciones Intradía/Swing cuyo marco temporal principal es H1, H2, H3 y H4. Sin embargo, puede utilizarlo con o
FREE

Este indicador muestra símbolos y barras fractales Utilice este indicador para mostrar diferentes símbolos para fractales bajistas y alcistas: Elija entre 144 símbolos (consulte la tabla siguiente) Se pueden modificar los colores, el tamaño y el desplazamiento de los fractales Se puede cambiar el color de la barra de precio fractal o de la vela Se pueden ocultar los fractales y mostrar sólo la barra de precio fractal Se puede modificar la frecuencia en el cálculo del fractal
Instrucciones de u
FREE

Indicador Structure Levels (Highs & Lows) para MetaTrader 5
Decodifique el ADN del mercado - Opere con precisión institucional Descripción:
El indicador de niveles de estructura (máximos y mínimos ) es su arma secreta para trazar la hoja de ruta oculta del mercado. Diseñado para los operadores que piensan en términos de acción del precio y estructura del mercado, esta herramienta identifica automáticamente los máximos y mínimos de oscilación críticos, transformando gráficos caóticos en un plan

Apex Swing VWAP es un indicador avanzado para MetaTrader 5 que combina el análisis VWAP (precio medio ponderado por volumen) con la detección automática de puntos de oscilación significativos. Esta combinación proporciona una visión precisa del sentimiento del mercado y los posibles puntos de reversión. Características principales Análisis técnico integrado - VWAP dinámico a partir de puntos de oscilación relevantes - VWAP histórico para análisis de tendencias a largo plazo - Múltiples periodos

Estoy compartiendo este EA aquí de forma gratuita para apoyar a la comunidad comercial. ¡ Espero que sea útil, y no dude en ponerse en contacto si tiene alguna pregunta o comentario!
Requisitos
Pares de negociación todos los pares de tendencia, especialmente USDJPY
Marco de tiempo M1 a H6
Depósito mínimo $ 100 Apalancamiento 1:200 Corredores Cuenta Hedging Pro o ECN
Características principales: 1. Buena gestión del riesgo: Mono MA se asegura de que su capital esté siempre protegido con su sof
FREE

Símbolo: EURUSD Plazos: M1,M5,M15 Recomendado: M5 Sin estrategias peligrosas TP y SL fijos No se negocia muy a menudo Ajustes recomendados: deafult Tamaño de lote recomendado: Depósito Tamaño del lote 1000€. 0.02 2000€. 0.04 5000€. 0.1 10000€. 0.2 Backtest 2020-2024 hasta ahora Por favor, use buen riesgo y dinero manegement Posibilidad de establecer protecciones de dinero y cuenta Si necesita ayuda u otras recomendaciones por favor pregunteme Más información: https: //www.mql5.com/en/users/marti
FREE

¿Qué es El Camarero ?
Es un sistema automatizado para estar siempre listo para captar los grandes movimientos del mercado
¿Cómo funciona?
Establezca el modo (stop o límite) Establezca la distancia de las órdenes pendientes Establecer Take Profit / Stop Loss Espere a que la vela grande
ajustes:
entrada : 0.OFF (el asesor experto no operará. sólo para propósitos de información del gráfico.) 1.Nueva vela, nuevas órdenes STOP (cada nueva vela se colocan dos órdenes stop. Si no se activan al final
FREE

NeuraVault Pro v1.0 - Sistema de Trading Profesional de Reversión RSI Descripción General NeuraVault Pro es un sistema de trading automatizado profesional basado en reversiones del RSI (Índice de Fuerza Relativa). Está diseñado para capturar oportunidades de reversión en zonas de sobrecompra y sobreventa, equipado con filtros avanzados y funciones completas de gestión de riesgos. Lógica de Trading Estrategia Principal: Reversión RSI El EA captura oportunidades de reversión cuando el mercado alca
FREE

Indicador de Tendencia Fibonacci para MT5 Unlock the power of Fibonacci analysis on your MetaTrader 5 charts!
Nuestro indicador de tendencia Fibonacci traza automáticamente niveles dinámicos de soporte y resistencia para que pueda detectar tendencias, retrocesos y oportunidades de ruptura de un vistazo. Características y Ventajas Niveles de Fibonacci automáticos
Muestra al instante siete niveles clave de retroceso de Fibonacci basados en los precios más altos y más bajos del periodo de retroce
FREE

Marca de agua inteligente Muestra el símbolo actual + marco temporal Muestra el nombre de la cuenta (o texto personalizado) Fuente/color/posición personalizables Herramientas de un solo clic Conmutador de plazos: botones de acceso rápido (M1 a D1) Herramientas de dibujo: Cree líneas horizontales, líneas de tendencia y retrocesos de Fibonacci con un tamaño consistente. Limpieza de objetos: el botón " Borrar" elimina todos los dibujos creados por el indicador. Medidor de pips Seguimiento de P/L e
FREE

Vela Volumen Coyote La Vela de Volumen Coyote es un indicador que mide el cambio del volumen en el tiempo, su cuerpo es el cambio del volumen anterior por el volumen actual, su dirección por el cierre del precio.
1. identificó un tope en el indicador Coyote Volume Candlestick (marcó el cierre del precio).
2. identificó un fondo en el indicador Coyote Volume Candlestick (marcó el cierre del precio).
3. el fondo 3 es igual al fondo 2 en el indicador Coyote Volume Candlestick, el precio en el 3 e
FREE

BinaWin NoTouch es un indicador que manda una señal de alerta cuando el comercio está en la posición correcta para esperar el rompimiento de un mercado lateral. Es pensado especialmente para hacer trading bajo la estrategia “No Touch” de la plataforma Binary.Com con los índices sintéticos N.10, N.25, N.50, N.75 y N.100 De igual forma se puede hacer trading con la estrategia CALL y PUT convencional de cualquier plataforma de Opciones Binarias. Requisitos para usar el indicador: 1. Tener cuenta en
FREE

Gold Surge AI - EA de compra para XAU/USD OPTIMIZACIÓN HECHA PARA EL VTMARKETS ¡¡¡BROKER!!!
Auto-trading de precisión con lógica de tendencia, stop loss híbrido y gestión inteligente del riesgo Precio de lanzamiento: 149 USD (por tiempo limitado) ¿Qué es Gold Surge AI? Gold Surge AI es un Asesor Experto Buy-Only totalmente automatizado diseñado específicamente para XAU/USD en MetaTrader 5.
Opera con momentum alcista utilizando una estrategia multi-marco de tiempo y una lógica de riesgo conserv

El indicador "Deviation Scaled Moving Average Crosses" es una potente herramienta de análisis técnico diseñada para la plataforma de negociación MetaTrader 5. Facilita la toma de decisiones comerciales informadas mediante la presentación visual de la interacción entre dos medias móviles, ambas suavizadas y escaladas para ofrecer una visión mejorada de las tendencias del mercado. Este indicador personalizado ha sido desarrollado por mladen y está protegido por derechos de autor hasta el año 2023
FREE

MultiTrend Commander - Sistema de Trading Automatizado ¿Qué es? Un software de trading automatizado que:
Identifica de forma inteligente las tendencias del mercado
Toma decisiones basadas en múltiples marcos temporales
Gestiona automáticamente el riesgo
¿Qué hace? Identificar tendencias Analiza el mercado en tiempo real
Combina señales de diferentes marcos temporales (15 min, 1 h, 4 h)
Confirma la dirección de la tendencia antes de entrar
Proteger su capital Calcula automáticamente l
FREE

El indicador de marco temporal Wormhole para MetaTrader 5 (MT5) no es solo otra herramienta de trading; es tu ventaja competitiva en los mercados financieros. Diseñado tanto para traders principiantes como profesionales, Wormhole transforma la forma en que analizas datos y tomas decisiones, asegurando que siempre estés un paso adelante. Por qué necesitas el indicador Wormhole Supera a la competencia: La capacidad de ver dos marcos temporales en el mismo gráfico de forma simultánea significa que
FREE

️ PropProtector para MetaTrader 5 La protección definitiva para su cuenta de Prop Trading ¿Por qué PropProtector? Las empresas de Prop Trading tienen reglas estrictas: Límites de pérdidas diarias, drawdowns máximos, recuentos de operaciones limitados, restricciones de negociación antes de eventos noticiosos. ¡Un solo error puede costarle su cuenta! PropProtector supervisa su cuenta 24/7 e interviene automáticamente antes de que viole cualquier regla. Características principales Límite de p
FREE

El Mirror Chart MT5 es un indicador superpuesto diseñado específicamente para proyectar un segundo instrumento financiero directamente sobre la ventana del gráfico principal. Esta herramienta es muy valiosa para los operadores que se basan en el análisis de correlación, ya que visualiza los movimientos de precios de dos instrumentos diferentes en tiempo real. A diferencia de las superposiciones tradicionales, este indicador utiliza una lógica inteligente y dinámica de centrado y escalado. Analiz
FREE

La distancia entre medias móviles es una potente herramienta de análisis técnico diseñada para proporcionar una representación visual de la distancia entre el precio actual y una media móvil específica. Este indicador, desarrollado para MetaTrader, ofrece a los operadores una perspectiva clara de los cambios en la dinámica de los precios en relación con la tendencia a medio plazo.
Versión MT4: https: //www.mql5.com/pt/market/product/111705
FREE

"ChronoTrigger EA" es un asesor experto que combina estrategias comerciales detalladas y funciones automatizadas de gestión de riesgos. Este EA utiliza el indicador RSI para determinar el momento de los mercados de sobrecompra y sobreventa y calcula los puntos óptimos de entrada y salida, lo que permite a los inversores obtener ganancias estables sin verse afectados por las fluctuaciones del mercado. Brindamos un fuerte apoyo para obtenerlos.
Los usuarios pueden establecer libremente el tamaño
FREE
MetaTrader Market ofrece a todos los desarrollador de programas de trading una sencilla y cómoda plataforma para ponerlos a la venta.
Le ayudaremos con la presentación y explicaremos cómo preparar la descripción de su producto para el Market. Todos los programas que se venden a través del Market están protegidos por una codificación adicional y pueden ser iniciados sólo en el ordenador del comprador. La copia ilegal es imposible.
Está perdiendo oportunidades comerciales:
- Aplicaciones de trading gratuitas
- 8 000+ señales para copiar
- Noticias económicas para analizar los mercados financieros
Registro
Entrada
Si no tiene cuenta de usuario, regístrese
Para iniciar sesión y usar el sitio web MQL5.com es necesario permitir el uso de Сookies.
Por favor, active este ajuste en su navegador, de lo contrario, no podrá iniciar sesión.