Fan sayfamıza katılın
Öyleyse bir link gönderin -
başkalarının da faydalanmasını sağlayın
- Görüntülemeler:
- 4287
- Derecelendirme:
- Yayınlandı:
-
Bu koda dayalı bir robota veya göstergeye mi ihtiyacınız var? Freelance üzerinden sipariş edin Freelance'e git
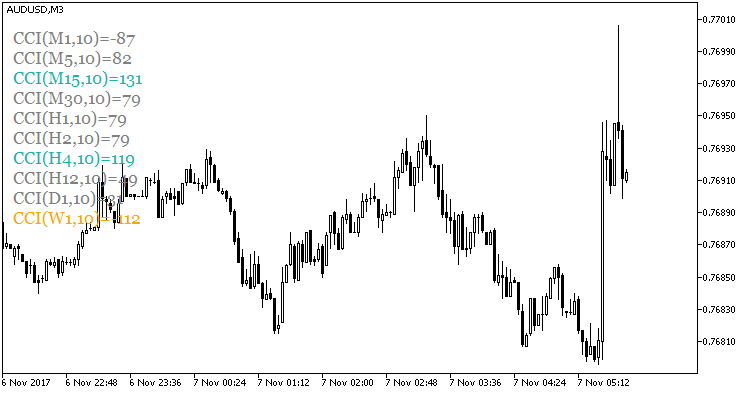
The indicator shows a text block with the values of the user defined CCI oscillator period for each timeframe. The size of the text block is customizable. You can also change the text font and disable the display of unused timeframes. The maximum number of simultaneously displayed indicators is ten. The color of the text block depends on the position of the CCI indicator relative to overbought and oversold zones, which are set in the indicator input parameters
input int HighLevel=+100;                               // overbought level
input int LowLevel=-100;                                // oversold level
input color HighColor=clrLightSeaGreen;                 // overbought color
input color MiddleColor=clrGray;                        // no-trend color
input color LowColor=clrOrange;                         // oversold color

Fig.1. The CCIValues indicator
MetaQuotes Ltd tarafından Rusçadan çevrilmiştir.
Orijinal kod: https://www.mql5.com/ru/code/19362
 XMA_Divergence
A trend indicator displaying divergence areas on the price chart.
 ShadeOpenX_Timer
The ShadeOpenX indicator with the possibility to display the percentage value of time that has elapsed since the beginning of the trading session displayed in input parameters. The possibility is implemented using the classes of libraries that were described in detail in the article "Custom indicators and infographics in CCanvas".
 XMA_Divergence_HTF
The XMA_Divergence indicator with the possibility to change the indicator timeframe from input parameters.
 Jims Close Positions
Closing positions: all, only profitable or only losing positions.