Fan sayfamıza katılın
Öyleyse bir link gönderin -
başkalarının da faydalanmasını sağlayın
- Görüntülemeler:
- 6320
- Derecelendirme:
- Yayınlandı:
-
Bu koda dayalı bir robota veya göstergeye mi ihtiyacınız var? Freelance üzerinden sipariş edin Freelance'e git
Counting the number of series of bullish and bearish bars. Displaying the result as a chart. Saving the screenshot of the resulting chart. The script uses the CGraphic class.
Input Parameters
- Count of bars - the number of bars (from the rightmost bar on the chart), for which the calculation will be preformed;
- Verification - the flag for printing the copied timeseries of this symbol and the resulting array of bar series. NOTE: should only be enabled if the Count of bars parameter does not exceed 15-30. Otherwise the amount of printed data will be very large;
- Save screenShot - enable/disable saving of screenshots of the resulting chart;
- Sleep (milliseconds) - a delay in displaying the resulting chart.
Series of bars are coded according to the following principle:
   enum ENUM_SERIES_TYPE
     {
      Bull=1,  // ↑
      Bear=-1, // ↓
     };
A "bullish" candlestick has the code of "1", a "bearish" candlestick has the code of "-1".
Another parameter for the name of the series is calculated as follows:
current series (ENUM_SERIES_TYPE) * the umber of bars in a row in this series
int name_series=current_series_type*count_series;
Note: the very last series is not included in calculations, because you cannot know how long the series will last.
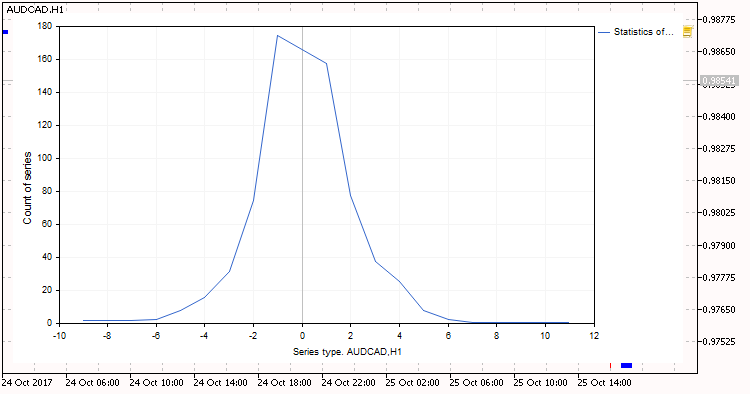
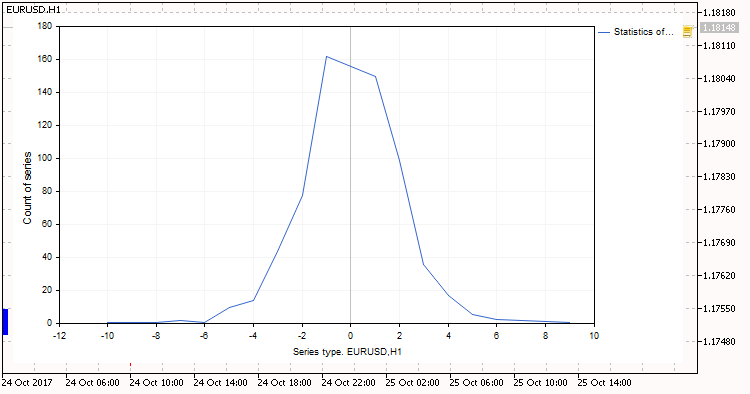
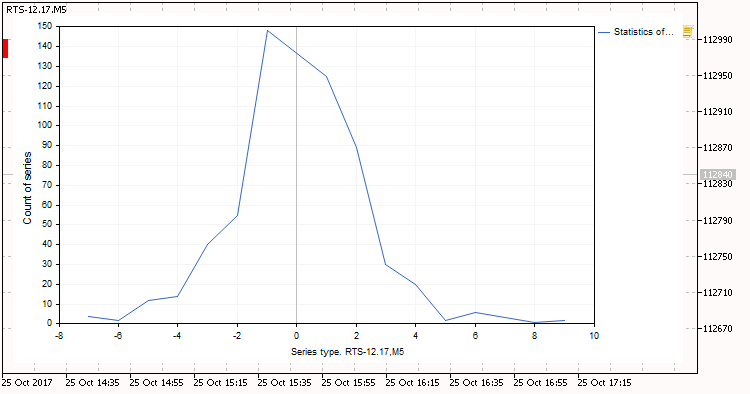
Screenshots are saved (if Save screenShot is enabled) to [data folder]\MQL5\Files\Statistics of candles\. An example of a saved screenshots of the resulting charts. Series are drawn along the X axis, i.e. the "-5" series means five bearish bars in a row, and "2" means two bullish bars in a row:

Fig. 1. AUDCAD,H1. 1200 bars

Fig. 2. EURUSD,H1. 1200 bars

Fig. 3. RTS-12.17,M5. 1200 bars
MetaQuotes Ltd tarafından Rusçadan çevrilmiştir.
Orijinal kod: https://www.mql5.com/ru/code/19304
 MACD Crossing the zero level (color candles)
Color candlesticks display areas, in which the MACD indicator crosses the zero line.
 MACD Crossing the zero level
Displays areas, in which the MACD indicator crosses the zero line.
 WPRValues
The indicator shows a text block with the values of the user defined WRP oscillator period for each timeframe.
 DeMarkerValues
The indicator shows a text block with the values of the user defined DeMarker oscillator period for each timeframe.
