Fan sayfamıza katılın
Öyleyse bir link gönderin -
başkalarının da faydalanmasını sağlayın
- Görüntülemeler:
- 10014
- Derecelendirme:
- Yayınlandı:
- Güncellendi:
-
Bu koda dayalı bir robota veya göstergeye mi ihtiyacınız var? Freelance üzerinden sipariş edin Freelance'e git
The real author:
Vadim Shumiloff
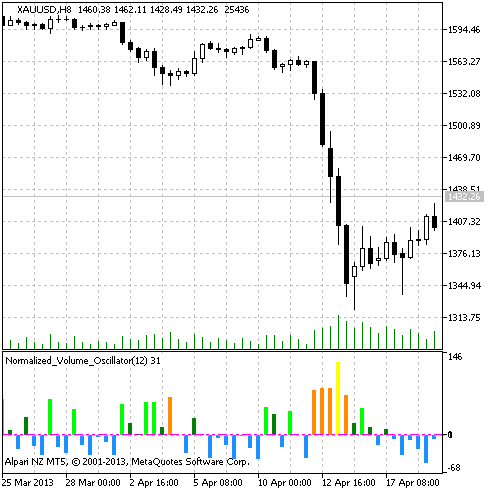
The indicator is the development of the idea of the normalized volumes (Normalized Volume).
At first, volume normalized values are expressed now as a percentage of the average value for the period. Accordingly, the data in the chart can now take negative values which indicates of the silence in the market.
Another useful innovation is the histogram bar coloring depending on the normalized volume value.
- The blue color indicates that the current volume is less than the average one for the period;
- The dark green color indicates a little increase of volume compared to the average one for the period;
- The light green color indicates that increase of volume overcame Fibo level of 38.2% compared to the average one for the period;
- The orange color indicates that increase of volume overcame Fibo level of 61,8% compared to the average one for the period;
- The yellow color indicates that increase of volume overcame Fibo level of 100% compared to the average one for the period;
This indicator was first implemented in MQL4 and published in Code Base at mql4.com on 19.06.2008.

Fig.1 The Normalized_Volume_Oscillator indicator
MetaQuotes Ltd tarafından Rusçadan çevrilmiştir.
Orijinal kod: https://www.mql5.com/ru/code/1705
 VoltyChannel_Stop
The NRTR trend indicator that sends alerts and Push messages
 PsyIndicator
The trend indicator drawn in the form of the cloud
 MACDonRSI
The MACD histogram drawn on the basis of the RSI smoothed oscillator
 TF Adaptive Moving Average
One of the variants of a simple moving average of close prices, which automatically adapts to the chart period and shows the average value of the price for each of the 21 ranges provided in MT5. Comparing the current price with the average price value for a particular trader selected period.