Alım-satım robotlarını ücretsiz olarak nasıl indirebileceğinizi izleyin
Bizi Telegram üzerinde bulun!
Fan sayfamıza katılın
Fan sayfamıza katılın
Komut dosyasını ilginç mi buldunuz?
Öyleyse bir link gönderin -
başkalarının da faydalanmasını sağlayın
Öyleyse bir link gönderin -
başkalarının da faydalanmasını sağlayın
Komut dosyasını beğendiniz mi? MetaTrader 5 terminalinde deneyin
- Görüntülemeler:
- 5461
- Derecelendirme:
- Yayınlandı:
- Güncellendi:
-
Bu koda dayalı bir robota veya göstergeye mi ihtiyacınız var? Freelance üzerinden sipariş edin Freelance'e git
Real author:
RickD
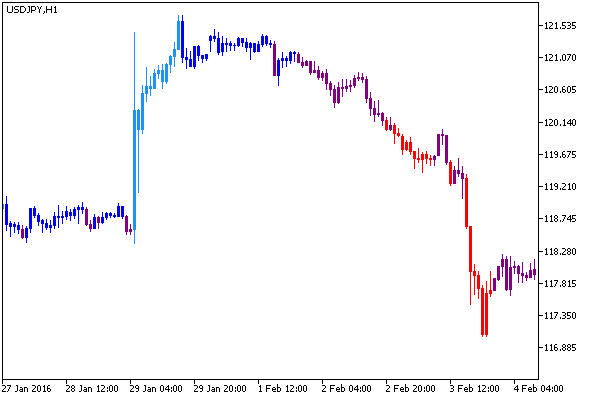
The RSIdivCandle indicator. Colors the candles based on the RSI oscillator:
- Blue — RSI is in the overbought area;
- Dodger blue — RSI is above the 50 level and outside the overbought and oversold areas;
- Purple — RSI is below the 50 level and outside the overbought and oversold areas;
- Red — RSI is in the oversold area.

Fig.1. The RSIdivCandle indicator
MetaQuotes Ltd tarafından Rusçadan çevrilmiştir.
Orijinal kod: https://www.mql5.com/ru/code/16036
 StodivCandle
The StochCandles indicator. Colors the candles based on the Stochastic.
 Normalized_Volume_Oscillator
The indicator is the development of the idea of using the Normalized Volumes.
 Exp_PFE
The Exp_PFE trading system based on the signals of the PFE oscillator.
 WPRdivCandle
The WPRdivCandle indicator. Colors the candles based on the WPR oscillator.