Fan sayfamıza katılın
Öyleyse bir link gönderin -
başkalarının da faydalanmasını sağlayın
- Görüntülemeler:
- 4838
- Derecelendirme:
- Yayınlandı:
- Güncellendi:
-
Bu koda dayalı bir robota veya göstergeye mi ihtiyacınız var? Freelance üzerinden sipariş edin Freelance'e git
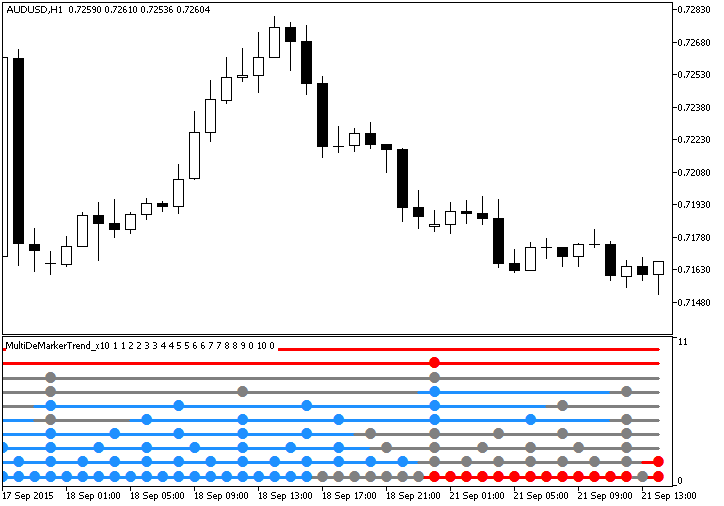
The MultiDeMarkerTrend_x10 indicator shows information on the current trends using the DeMarker oscillator position from then different timeframes.
Each of the ten indicator lines corresponds to a separate indicator. If the oscillator is positioned lower than the oversold level, the lines are painted in red, if it's higher than the overbought level, the lines are painted in medium blue. Otherwise, the lines are gray. Colored dots on lines appear when the bar of the corresponding timeframe changes.

Fig.1. The MultiDeMarkerTrend_x10 indicator
MetaQuotes Ltd tarafından Rusçadan çevrilmiştir.
Orijinal kod: https://www.mql5.com/ru/code/14051
 DeMarkerTrend_x10Full
A variant of the DeMarkerTrend_x10 indicator with the option to individually customize the input parameters for each DeMarker oscillator which are used to display the current trends
 DeMarkerTrend_x10
The DeMarkerTrend_x10 indicator shows the DeMarker oscillator position from ten different timeframes
 ColorZerolagDeMarker
This variant of DeMarker oscillator is calculated based on five DeMarker indicators
 ColorZerolagDeMarker_HTF
The ColorZerolagDeMarker indicator with the timeframe selection option available in input parameters.