Alım-satım robotlarını ücretsiz olarak nasıl indirebileceğinizi izleyin
Bizi Facebook üzerinde bulun!
Fan sayfamıza katılın
Fan sayfamıza katılın
Komut dosyasını ilginç mi buldunuz?
Öyleyse bir link gönderin -
başkalarının da faydalanmasını sağlayın
Öyleyse bir link gönderin -
başkalarının da faydalanmasını sağlayın
Komut dosyasını beğendiniz mi? MetaTrader 5 terminalinde deneyin
- Görüntülemeler:
- 8513
- Derecelendirme:
- Yayınlandı:
- Güncellendi:
-
Bu koda dayalı bir robota veya göstergeye mi ihtiyacınız var? Freelance üzerinden sipariş edin Freelance'e git
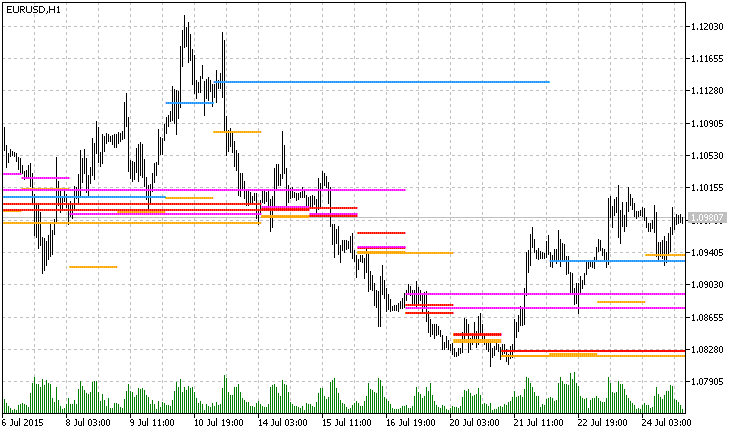
This indicator shows the support/resistance lines using price histogram. The indicator is not so heavy, the calculation was simplified.
Display:
- Gold Line — peaks of a 1-day histogram.
- Red Line — peaks of a short term histogram.
- Magenta Line — peaks of a medium term histogram.
- Blue Line — peaks of a long term histogram.

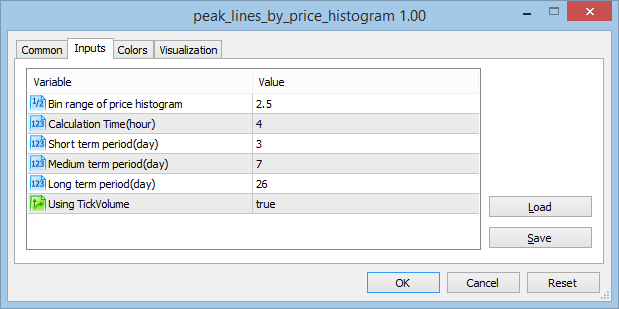
Settings:

 MomentumCloud
Cloud indicator, the envelopes of which represent the Momentum oscillator values calculated for High and Low prices.
 ColorZerolagTriXOSMATrend_x10
The ColorZerolagTriXOSMATrend_x10 indicator shows the ColorZerolagTriXOSMA oscillator direction from ten different timeframes.
 ColorZerolagRSIOSMA_HTF
The ColorZerolagRSIOSMA indicator with the timeframe selection option available in the input parameters.
 ColorZerolagRSIOSMACandle
The ColorZerolagRSIOSMA indicator implemented as a sequence of candlesticks.