Fan sayfamıza katılın
Öyleyse bir link gönderin -
başkalarının da faydalanmasını sağlayın
- Görüntülemeler:
- 4312
- Derecelendirme:
- Yayınlandı:
- Güncellendi:
-
Bu koda dayalı bir robota veya göstergeye mi ihtiyacınız var? Freelance üzerinden sipariş edin Freelance'e git
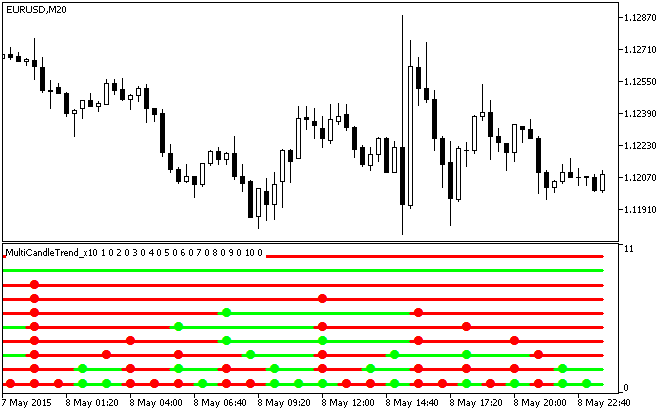
The MultiCandleTrend_x10 indicator displays information on current trends using candlestick direction from ten different timeframes.
Each of the ten indicator lines corresponds to a separate indicator. If the candlestick is growing on the corresponding timeframe, the line is light green, if it's falling, the line is red. Colored dots on lines appear when the bar of the corresponding timeframe changes.

Fig.1. The MultiCandleTrend_x10 indicator
MetaQuotes Ltd tarafından Rusçadan çevrilmiştir.
Orijinal kod: https://www.mql5.com/ru/code/12983
 StocksBG
StocksBG indicator displays the activity of major stock exchanges on a chart with M15 or less timeframe.
 Currency Correlation II
The indicator shows correlation between currencies.
 MFITrend_x10
The MFITrend_x10 indicator shows the MFI oscillator position from ten different timeframes.
 MultiMFITrend_x10
The MultiMFITrend_x10 indicator shows information on current trends using the MFI oscillator position from ten different timeframes.