Manzano Volume Profile VWAP Levels

Manzano Volume Profile VWAP Levels

Professional futures traders read the market through volume: where the session VWAP sits, where value was built, which levels price has not revisited yet and who is really pushing, buyers or sellers. On platforms like Sierra Chart all of this sits on one chart. On MetaTrader 5 it usually means five or six separate indicators, each with its own style, that do not talk to each other.

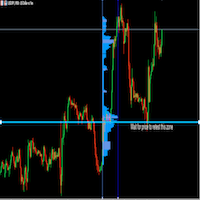
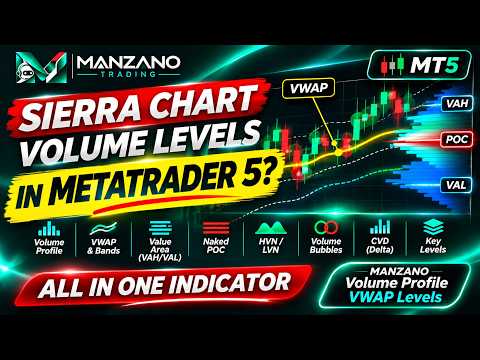
Manzano Volume Profile VWAP Levels brings that complete volume map to MT5 in a single indicator. It includes session, weekly and monthly VWAP with deviation bands; session and composite volume profiles; value areas of the day, week and month; naked POC bands; HVN and LVN zones; opening range and initial balance; tick-by-tick volume bubbles; and a session cumulative delta pane. All of it lives in one professional interface where every layer can be switched on or off with a click.

This is not a basic profile with a VWAP added on top. It is a complete workstation for reading value, acceptance and pressure, designed for intraday traders of indices, gold, FX and futures CFDs.

What you see at a glance

When you open a chart, the indicator answers the questions that matter before every trade:

  • Is price above or below the fair value of the day (VWAP), and how stretched is it in standard deviations?
  • Is price trading inside, above or below yesterday's value area?
  • Where are the high volume nodes that tend to attract and hold price, and the low volume areas price tends to cross quickly?
  • Which POCs from previous sessions are still untouched?
  • Where are the overnight range, the opening range and the initial balance?
  • Are aggressive buyers or aggressive sellers in control of the session right now?

The top bar shows this context permanently with three chips: price position in VWAP deviations, position against the previous value area, and today's volume compared with the average of the last sessions.

Session VWAP with deviation bands

The session VWAP is the volume weighted average price of the day: the reference institutions use to judge whether they are buying expensive or cheap. It is drawn with up to three standard deviation bands (1, 2 and 3 sigma), all of them volume weighted. When price reaches the second band it is statistically stretched, and these areas are often where moves slow down or rotate.

  • Anchor at the session start or at the cash open (for example 16:30 broker time for US indices)
  • Bands of 1, 2 and 3 deviations, each switchable
  • Line tags at the end of each curve (VWAP, SD1+, SD2-...) so the chart stays readable
  • Hover the VWAP to see its value, the sigma and where price sits in deviations

Weekly and monthly VWAP

The weekly VWAP starts with the first session of the week and shows the average price of the week, with an optional 1 deviation band. The monthly VWAP does the same for the month. Together they tell you whether the intraday move goes with or against the value of larger participants.

Volume profiles: session, composite and history

A volume profile shows how much was traded at each price. It is the clearest picture of where the market accepted value and where it rejected it.

  • Session profile: drawn next to the last bar and updated live, with today's POC, VAH and VAL
  • Composite profile: drawn on the right edge, covering the current week, the current month, the previous session or the last N sessions (2 to 20)
  • Value area (70% of the volume) highlighted and POC row marked in red
  • Heat colours: rows coloured by intensity, from blue (little volume) to red (heavy volume), so the nodes stand out immediately
  • Optional profile behind every past session, to see how value migrated day by day
  • Optional volume heatmap: each session's volume by price painted as heat stripes behind the candles
  • Automatic row size (based on the average daily range) with fine, normal, coarse and very coarse settings, or a fixed size in price
  • Adjustable composite width, with the profile placed next to the label column so it never covers the level tags

Value areas of day, week and month

The indicator draws the VAH, VAL and POC of five periods, each clearly labelled on the right edge:

  • Today (developing): VAH, VAL, POC
  • Previous session: PD VAH, PD VAL, PD POC
  • Current week: WK VAH, WK VAL, WK POC
  • Previous week: PW VAH, PW VAL, PW POC
  • Current month: M VAH, M VAL, M POC

Labels are stacked automatically so they never overlap. Opening inside, above or below yesterday's value, and accepting or rejecting the edges of value, are central ideas of auction market theory. Here they are visible without drawing a single line by hand.

Naked POC bands: the levels price has not revisited

The coloured horizontal bands are one of the most recognisable features of professional volume charts. They mark the POC of previous sessions that price has not traded back to (naked POCs). Many traders watch them as magnets and targets. Each band starts at its session, carries its date and disappears automatically as soon as price trades through it, so your chart only shows levels that are still open.

  • Naked POC bands, plus optional naked VAH and VAL bands
  • Number of recent sessions with bands, adjustable from 1 to 15
  • Hover a band to see its exact price and the session it comes from

HVN and LVN zones

From the composite profile the indicator extracts high volume nodes (HVN), areas of strong acceptance where price tends to slow down and rotate, and low volume nodes (LVN), thin areas price tends to travel through quickly. They are drawn as wide zones across the chart, with an adjustable number of zones of each type.

Lines or heat bands: your choice

Every level can be drawn as a classic line, as a heat band that glows in the centre and fades out, or as both at once. Heat bands give the chart the soft, layered look of professional order flow platforms and make the important levels stand out without visual noise.

Key intraday levels

  • Previous session high, low and close (PDH, PDL, PDC)
  • Overnight high and low before the cash open (ONH, ONL)
  • Opening range high and low (ORH, ORL), with configurable minutes
  • Initial balance high and low (IBH, IBL), with configurable minutes
  • Previous week high and low (PWH, PWL)
  • Session open and cash open

Levels that are still forming (opening range, initial balance) carry an asterisk until they are complete. Session start, cash open and cash close are set in broker time, so the indicator adapts to any broker and any market.

Tick-by-tick volume bubbles

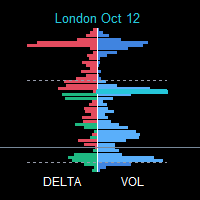
The bubbles are calculated from real ticks with an aggressor engine, the same approach used in order flow footprints. For each bar the indicator finds the exact prices where volume concentrated and draws a bubble there, sized by volume and coloured by the aggressor imbalance at that price: green for aggressive buyers, red for aggressive sellers, neutral grey when both sides were balanced. Hovering a bubble shows its volume, the imbalance percentage, how many times larger it is than the average row, and the time.

  • Minimum size adjustable as a multiple of the average row volume
  • Volume printed inside the bubble, optional
  • On charts above H1, bubbles switch to bars with abnormal volume

Session cumulative delta (CVD) pane

At the bottom of the chart, a dedicated pane shows the cumulative delta of each session as candles: aggressive buying minus aggressive selling, reset at every session start. With one click it switches to the delta of each bar as a histogram, to compare the pressure of individual bars. The vertical scale of the price chart adjusts automatically so the pane never covers the candles.

  • Calculated tick by tick where ticks are available (bright colours)
  • Estimated from M1 bars outside the tick history (dimmed colours), so the source is always clear
  • Adjustable pane height, cumulative or per-bar mode, automatic candle scale on or off
  • Hover any bar to see its delta, the session total and the data source

Options levels

If you follow options positioning, you can add your call wall, put wall, gamma flip and three custom levels with your own names. Click PLACE and then click the chart, or type the prices in the inputs. They are drawn as purple tags and saved per symbol. MT5 does not provide options data, so these levels are entered by you from your own source.

Side dock with four tabs

  • Levels: the nearest levels above and below price, with their name, price and distance in ATR. You always know what is next in both directions.
  • Profile: a summary of the session. It shows today's POC, VAH and VAL, range and volume compared with their averages, session delta, profile shape (P, b or D), opening type (inside value, above or below value, out of range), initial balance compared with its average, the weekly and monthly value areas, and a plain-words reading of the context.
  • Log: the key events of the last sessions. These are initial balance and opening range breaks, closes beyond the previous VAH or VAL, returns inside the previous value, VWAP 2 sigma band touches and naked POCs being filled. Click an event and the chart jumps to that bar and highlights it.
  • Info: data used, number of sessions, row size, volume type, session times and calculation time, plus language, theme and reset buttons.

Interface designed for speed

  • Layers bar: nine layers (VWAP, weekly and monthly VWAP, profiles, value areas, bands, key levels, bubbles, options, CVD) switchable with one click
  • Presets: Sierra (everything), VWAP, Profile and Clean (levels only)
  • Left rail with an options panel for every layer, so nearly every setting can be changed without opening the inputs
  • Symbol selector with search (Market Watch or all symbols) and timeframe menu in the top bar
  • Price, daily change and context chips always visible
  • Hover cards with the details of every level, zone, profile and bubble
  • Built-in legend explaining every colour and mark
  • Status bar with bar countdown, broker time, number of levels, row size and volume type
  • Dark and light themes, nine bullish and bearish colour sets, three dock widths
  • English and Spanish interface
  • Settings saved automatically and restored the next time
  • Everything drawn on one canvas, without chart objects, so the object list stays clean and the chart stays responsive

Data and calculation

All calculations use your broker's own data. Profiles and VWAPs are built from M1 history (10 to 60 sessions, plus the current month and the previous week), using real volume when the broker provides it and tick volume otherwise. The tick engine for bubbles and CVD loads 1 to 5 sessions of ticks and works on charts up to H1. The indicator works on any symbol and timeframe. It is designed especially for intraday trading on M1 to M30 charts of indices, gold, FX and futures CFDs.

Input parameters

The inputs are grouped into clear blocks:

  • Language and appearance: language, theme, colour set, start-up preset, fonts, dock
  • Sessions: session start, cash open and close, opening range and initial balance minutes, sessions of history
  • Volume data: volume source, row size, tick engine and tick sessions
  • Layers: start-up state of the nine layers
  • VWAP, profiles, value areas and bands, key levels, bubbles and CVD: start-up options of each block
  • Options levels: prices and names of the manual levels
  • Colours: every element can be recoloured

Strategy Tester

The indicator runs in the visual Strategy Tester with the full interface. Use "Every tick based on real ticks" to see the tick-by-tick bubbles and CVD. Zoom and scrolling are done with the tester chart's own controls.

Who it is for

  • Intraday traders of indices, gold, FX and futures CFDs who work with VWAP, volume profile and auction market concepts
  • Traders coming from Sierra Chart, NinjaTrader or ATAS who want the same volume levels on MetaTrader 5
  • Discretionary traders who want context before every decision: value, acceptance, untouched levels and pressure

Important

Manzano Volume Profile VWAP Levels is a visual analysis tool. It does not generate trading signals, alerts or orders, and it does not promise any result: trading decisions remain yours. For questions or suggestions, contact me through MQL5 private messages.

Рекомендуем также
Footprint Zones MT5 – Supply and Demand with Order Flow Analysis Footprint Zones is a MetaTrader 5 technical indicator designed to help traders study supply and demand areas, buying and selling activity, volume imbalance, price rejection and potential trading opportunities. The indicator combines price structure analysis with footprint calculations to provide additional information about market activity around important price levels. It identifies potential demand and supply zones, evaluates pri

The 4 headed dragon is an indicator that has two functions. 1) Set the background trend. 2) Mark the predominant trend. By combining these two indicator signals, we will be able to trade for or against the trend, adapting the signals to your reading of the market. You can download the demo and test it yourself. 1) Set the background trend.    Define four possibilities of trend that are the four heads of the dragon, marked by colors on the indicator, marking a) Powerful buying trend. b) Weak
With Fixed Range Volume Profile,The traces left by the big players will not go unnoticed by you. Professional   Volume Profile   Indicator reveals Institutional order flow. This advanced market indicator will teach you to spot the buying and selling. Dont want to say more because its well known by most professionals  trader. This Indicator : -  Quickly Identify the Strongest Institutional S/R Zones. - W orks with all Trading Instruments (Forex, Futures, Indexes, Commodities, Stocks, Cryptocurr
Smart Adaptive Trend Flow MT5 Professional adaptive trend, market structure, price levels and flow analysis indicator for MetaTrader 5. Would you like to test it before purchasing? You can request a fully functional trial version by sending us a private message through the MQL5 messaging system . This allows you to evaluate the indicator and all its features before making a purchase decision. A Complete Market View in a Single Chart Smart Adaptive Trend Flow MT5 has been developed to provide a
Fixed Volume Profile
Carlos Pascual Perez Maturano
This indicator, titled "Fixed Volume Profile.mq5", is a custom tool for MetaTrader 5 (MQL5) designed to calculate and display a Volume Profile over a user-defined fixed time range. The Volume Profile shows the distribution of trading volume at different price levels during a specific period, helping to identify areas of high activity (such as Points of Control or POCs) and volume-based support/resistance areas. Main Functionality: Interactive Range: The indicator creates two vertical lines on
FREE
Индикатор Crypto_Forex "HTF Bollinger Bands" для MT5. - Улучшите свои методы торговли с помощью профессионального индикатора "HTF Bollinger Bands" для MT5. HTF означает "более высокий таймфрейм". - Bollinger Bands — один из лучших индикаторов на рынке и идеальный инструмент для торговли. - Примерно 90% ценового движения происходит между двумя полосами. - Индикатор HTF Bollinger Bands отлично подходит для многотаймфреймовых торговых систем с входами по ценовому действию или в сочетании с другими
Индикатор рассчитывает ZigZag по классическому алгоритму с тремя параметрами: Depth, Deviation и Backstep. Главная функция — обнаружение и визуализация перерисовок, то есть моментов, когда последняя точка ZigZag смещается на новый бар. При загрузке индикатор выполняет симуляцию на заданной глубине истории. Алгоритм последовательно пересчитывает ZigZag для каждого бара, сравнивая текущее положение последней точки с предыдущим. Если обнаружено смещение — на графике появляется линия перерисовки, с
FREE
Gold Signal Swing Pro XAUUSD with Auto TP SL — Система из 7 фильтров + Гарантия RR для свинг-трейдинга XAUUSD Без перерисовки. Без перерисовки. Без задержек. Все сигналы фиксируются после подтверждения. Бонус для покупателей: Получите AI Zone Radar (стоимость $59) + PDF-руководство бесплатно при покупке. Напишите мне сообщение на MQL5 после покупки. AI Zone Radar: https://www.mql5.com/en/market/product/175834 Версия MT4 также доступна: https://www.mql5.com/ja/market/product/177778?source=Site +M
Session Volume Profile Pro draws a horizontal volume histogram for each trading session and highlights the price levels where the market spent the most activity. It gives you the three key reference levels professional volume traders rely on: the Point of Control (POC), the Value Area High (VAH) and the Value Area Low (VAL). KEY FEATURES Point of Control (POC): the highest-activity price of the session, acting as a fair-value magnet. Value Area (default 70%, configurable): the price range contai
The Killshot Spike Indicator is a premium, institutional-grade tool developed by Coetsee Digital, specifically engineered to catch violent algorithmic spikes. Crafted for traders focusing on Weltrade, Deriv, and SpaceMarkets synthetic indices, this indicator is optimized to operate on the 3-minute (M3) and 5-minute (M5) timeframes. Equipped with an intelligent Auto-Market Detection system, the indicator seamlessly adapts its algorithm based on the chart you apply it to. It supports Bullish-spiki
Представляем RSIScalperPro - революционный индикатор на основе RSI для MetaTrader 5, специально разработанный для скальпинга на графике одной минуты. С RSIScalperPro у вас будет мощный инструментарий для точных сигналов входа и выхода, чтобы повысить вашу торговую эффективность. RSIScalperPro использует два различных индикатора RSI, которые предоставляют четкие сигналы для уровней перекупленности и перепроданности. Вы можете настроить временные периоды и ограничительные значения двух RSI в соот
Here   our more valuable tools SMC Trend Trading   ,  Easy SMC Trading  ,  Institutional SMC Architect Volume Analysis Tools  ,  Volume flow Profile  ,  Market volume profile  , FVG with Volume  , Liquidity Heatmap Profile  ,  Volume Spread Analysis The Trading Guide MT5 Indicator is a powerful psychological trading assistant designed to keep traders disciplined, focused, and emotionally balanced. This innovative indicator displays real-time motivational messages, trading rules, and analysis
FREE
CRV Z-Score Engine is a professional market structure indicator that transforms raw price into normalized,  multi-horizon statistical structure model   It reveals: When price is statistically stretched When the market is transitioning between regimes When a move is structurally aligned across multiple horizons This is not a lagging oscillator . It is a multi-horizon statistical structure model built for serious traders. WHAT IS Z-SCORE? Z-Score measures how far price deviates from its n
CRT + Volume Profile  Candle Range Theory levels on several timeframes, filtered by the previous session's volume profile, with lower-timeframe entries (CISD / MSS) and strips of higher-timeframe candles drawn right of price. One indicator for the whole CRT workflow: where the range is, whether the sweep happened at a level that matters, and where the entry shift is. HOW THE CRT MODEL IS DETECTED - C1 is the range candle. Its high and low become CRT H and CRT L, with the 0.5 level between the
NeuroTrend Dashboard – Advanced Multi-Asset Market Intelligence NeuroTrend Dashboard is a professional-grade technical analysis suite designed to provide a high-level, "bird’s-eye view" of market momentum across multiple symbols and timeframes simultaneously. By synthesizing complex proprietary momentum, real-time currency strength, and volume flow data, NeuroTrend distills the pulse of the market into a clean, actionable interface. Stop wasting time switching between individual chart windows. N
Ziva LSE System
Hassan Abdullah Hassan Al Balushi
ZIVA LSE System A Professional Liquidity & Structure Execution Framework Executive Overview ZIVA LSE System is a professionally engineered analytical framework designed to interpret market behavior through structural logic and liquidity dynamics. It is not positioned as a conventional indicator. Rather, it functions as a structured execution environment that organizes price action into a clear, disciplined decision-making model. The system is built to deliver consistency, clarity, and controlled
Название: Smart VP: Бар Buy/Sell + POC Описание: Улучшите свой трейдинг с помощью Right Anchored Volume Profile. Визуализируйте объем покупок и продаж по ценовым уровням с числами рядом с баром и мгновенно определяйте Point of Control (POC). Идеально для трейдеров, которые хотят видеть структуру рынка сразу. Особенности: Right Anchored Volume Profile Бар объема покупок/продаж Числа рядом с баром Линия POC (Point of Control) Настраиваемые цвета и параметры отображения
ModGod Scalp Pullback - Precision Trend & Reversion Engine LAUNCH PROMOTION: Only $49 for the first 10 copies! The official price will be $490. Buy before the price goes up! The   ModGod Scalp Pullback   is an advanced, all-in-one indicator designed for professional scalpers and day traders. It combines the extreme smoothness of Triangular Moving Averages (TMA) with Heikin-Ashi trend filtering to provide highly accurate pullback entries and extreme exhaustion reversals. By mapping the natu
Volume Profile FREE — Multi-Session Heatmap (POC · VAH · VAL) See where trading activity actually occurs—not just where price moves. This indicator builds a clear, color-coded Volume Profile Heatmap directly on your chart and highlights the market's most important price levels: the Point of Control (POC) and the Value Area (VAH/VAL) , where price is most likely to react.
FREE
Emotions are a weakness. QHO mathematics is the future of your trading! You know what really truly frustrating?  Information garbage and noise. All those legacy, lagging indicators on the charts look like an attempt to steer a rocket ship with a steam engine. They are useless. They look at the past while the market is already flying forward on next-gen tech. We created QHO. This is not just another indicator. This is pure mathematics crushing market chaos right on your chart. Imagine completely
Narval
Adier Antonio Pereira
Narval определяет, где цена оказывается «зажатой» между макро- и микроструктурой. Он делает то, чего не делает ни один обычный индикатор: создает поле давления, которое начинается широким в прошлом и заканчивается откалиброванным под текущую свечу. Когда цена входит в это поле, она теряет силу. Именно здесь Narval ищет институциональное поведение, предшествующее резкому движению: отрицание и структурные ловушки W/M. Что вы видите на графике: Институциональная проверка: 3 линии, представляющие це
FREE
This Indicator adding power to traditional zigzag indicator. With High-Low numbers in vision it will be easier to estimate change of trend by knowing the depth of each wave. Information including points, pips, percentage%, and #bars can be displayed based on configuration. All information is real-time update. This indicator is especially useful in sideway market to buy low sell high.
Индикатор подкрашивает свечи относительно дельты их объёмов. Вычисление дельты свечей производится на основе тиковой истории либо ленты сделок (см. далее описание входной переменной "Volumes"). Подкраска производится по двум параметрам : по знаку дельты, как цвет свечи, по значению дельты, как контрастность цвета свечи на фоне цвета окна графика. Помимо подкраски свечей индикатор также отображает профиль дельты на промежутке, который задаётся пользователем между двумя вертикальными линиями. По
Astral Volume Оценивайте взвешенный по объёму импульс в контексте. Стартовое предложение — $78 · Скидка 35% · $120 после запуска. Сильное локальное движение может выглядеть иначе на старшем таймфрейме. Для трейдеров, рассматривающих объём вместе с ценой, Astral Volume объединяет локальное показание и более широкую картину перед оценкой смены направления. Оцените движение в контексте. Наблюдайте за импульсом, взвешенным по тиковому объёму, и сравнивайте его интенсивность с недавней историей. Заме
Трендовая система для золота, биткоина, серебра и Nasdaq: вход на пробое по основному тренду, стоп, следующий за ценой, калькулятор лота и реальная статистика каждого символа на вашей истории. СТАРТОВАЯ ЦЕНА 39 USD – следующая цена 49 USD. После покупки: PDF-руководство и личная помощь с настройкой. RGT Trend Rider – забирайте большие движения золота и биткоина Чёткий план прямо на графике: где входить, где стоп, каким лотом торговать и как правила работали на текущем символе. КАК ЭТО РАБОТАЕТ
Индикатор горизонтальных объемов ( Horizontal Volumes ) - отражает с помощью гистограммы, объем заключенных сделок по определенной цене без привязки за временем. При этом гистограмма появляется непосредственно в окне терминала, а каждый столбик объема легко сопоставить со значением котировки валютной пары. Индикатор практически не требует изменения настроек, а при желании с ними может разобраться любой трейдер. Объемы заключенных сделок имеют большое значение в биржевой торговле, обычно увелич
NQX Deviation Return Calm — сигнальный индикатор для MetaTrader 5: сигналы возврата после отклонения (сигналы подаются только в спокойных условиях, когда волатильность ниже своего недавнего среднего). Собственная логика NQX, которая обнаруживает возврат цены после экстремального отклонения. Сигналы подаются только в спокойных условиях, когда волатильность ниже своего недавнего среднего. Индикатор отображает предлагаемую точку входа, короткий стоп и дальние цели (3:1, 5:1, 10:1, до 20:1 на свинге
See every hour against its own past Session Pulse measures how each hour of the week usually behaves. It reads the symbol's H1 history on your broker and builds a weekday by hour fingerprint, Monday to Friday, hour by hour. For each hour of each weekday it stores the usual range, the usual spread and how often that hour produced a spike. Then it puts the live market next to that fingerprint. Main features 1. Weekday by hour fingerprint. Monday 09:00 and Friday 09:00 are different hours, and S
SessionFlowMap — мультисессионный профиль объёма и дельты с уровнями POC SessionFlowMap строит профиль объёма и профиль дельты (перевес покупок или продаж) по торговым сессиям форекс-дня: Азия, Лондон, Нью-Йорк, а также, по желанию, Сидней и собственная сессия. Для каждой сессии индикатор находит POC (Point of Control — цену с максимальным торгуемым объёмом) и зону стоимости Value Area (границы VAH и VAL, внутри которых прошла основная часть объёма) и продлевает эти уровни горизонтальными линиям
Market structures, Market balance, Range breakouts This tools helps to identify areas of market ranges, structures and plots colored boxes on breakout of those areas. User is given the option to receive alerts and notifications on the formation of the blocks. The tool has the ability to become an essential part of a technical trading system or even pure price action trading. Usage:- An essential tool for price action or technical traders.  More information in the blog
С этим продуктом покупают
Trend Sniper X
Sarvarbek Abduvoxobov
4.87 (46)
Trend Sniper X — это трендовый индикатор для MetaTrader 5, работающий на нескольких таймфреймах, который помогает трейдерам точно и ясно определять направление тренда и потенциальные точки разворота. для MT4: https://www.mql5.com/en/market/product/193245 Информация о цене: Текущая цена является промо-ценой и может измениться по мере выхода предстоящих обновлений и новых функций. Бонусное предложение: Чтобы получить БЕСПЛАТНЫЙ авто-трейд советник Assistant EA для этого индикатора, пожалуйста, на
Entry Points Pro — индикатор для MT5, который не перерисовывается и до того, как вы поставите ордер, показывает цену входа, стоп-лосс, лот и расчётный риск в деньгах. Укажите депозит и риск на сделку. Лот панель посчитает за вас. На скриншоте 4357.65 — уровень входа на пробой, 4324.53 — стоп, а при лоте 0.04 расчётный риск составляет $132. Попробуйте бесплатно в тестере стратегий MT5. Выберите Entry Points Pro, укажите XAUUSD H1 и запустите в визуальном режиме. После покупки помогу с настройкой
Gann Made Easy   - это профессиональная, но при этом очень простая в применении Форекс система, основанная на лучших принципах торговли по методам господина У.Д. Ганна. Индикатор дает точные BUY/SELL сигналы, включающие в себя уровни Stop Loss и Take Profit. ПОЖАЛУЙСТА, СВЯЖИТЕСЬ СО МНОЙ ПОСЛЕ ПОКУПКИ, ЧТОБЫ ПОЛУЧИТЬ ТОРГОВЫЕ ИНСТРУКЦИИ И ОТЛИЧНЫЕ ДОПОЛНИТЕЛЬНЫЕ ИНДИКАТОРЫ БЕСПЛАТНО! Вероятно вы уже не раз слышали о торговли по методам Ганна. Как правило теория Ганна отпугивает от себя не только
ULTRA - это технический индикатор, который который работает по принципу “Все включено” - самостоятельно анализирует рынок, дает торговые сигналы, показывает уровни для установки стоп лосс, а также подсказывает когда нужно закрывать сделки, чтобы получить профит или минимизировать убыток. То есть, не важно, что ты не умеешь анализировать рынок, определять уровни - где поставить SL или плохо совладаешь с мани-менеджментом. ULTRA все это сделает вместо тебя! БОНУС ДЛЯ ПОКУПАТЕЛЯ : После покупки ULT
Currency Strength Wizard   — очень мощный индикатор, предоставляющий вам комплексное решение для успешной торговли. Индикатор рассчитывает силу той или иной форекс-пары, используя данные всех валют на нескольких тайм фреймах. Эти данные представлены в виде простых в использовании индексов валют и линий силы валют, которые вы можете использовать, чтобы увидеть силу той или иной валюты. Все, что вам нужно, это прикрепить индикатор к графику, на котором вы хотите торговать, и индикатор покажет вам
Хватит действовать наугад. Знайте, когда входить, где выходить и в какую сторону склоняется рынок, всё на одном графике. RelicusRoad Pro собирает почти двадцать инструментов в один индикатор, а вы включаете те, которые подходят вашему стилю торговли. Чёткие входы. Чёткие выходы. План на каждом графике. Знакомо? Вы покупаете, а через минуту цена разворачивается против вас. Вы закрываете сделку слишком рано, а потом смотрите, как движение продолжается без вас. Пять индикаторов на графике, пять раз
Мультивалютный индикатор силы и импульса MT5 Dynamic Forex28 Navigator — развитие наших давно популярных индикаторов, объединяющее силу пяти в одном: Advanced Currency Strength28 Indicator (700 отзывов) Advanced Currency IMPULSE with ALERT (530 отзывов) Currency Strength EXOTICS GOLD Impulse with Alert CS28 Combo Signals (текущий бонус) Не нужно покупать четыре индикатора и ставить их на графики. Всё объединено в одном мощном индикаторе: сила 28 пар Forex, импульс рынка, который их ведёт, и опов
Azimuth Pro
Ottaviano De Cicco
5 (7)
Azimuth Pro V2: Синтетический фрактальный структурный анализ и подтверждённые входы для MT5 Обзор Azimuth Pro — многоуровневый индикатор свинговой структуры от Merkava Labs . Четыре вложенных уровня свингов, привязанный к свингам VWAP, определение ABC-паттернов, трёхтаймфреймная структурная фильтрация и подтверждённые входы на закрытой свече — один график, один рабочий процесс от микро-свингов до макро-циклов. Это не слепой сигнальный продукт. Это рабочий процесс, основанный на структуре, для т
Boba Analysis Suite
Trade Ready Solutions LLC
5 (2)
Boba Analysis Suite Boba Analysis Suite — аналитический индикатор для MetaTrader 5. Он объединяет структуру рынка, значимые ценовые зоны и общий рыночный контекст в одном представлении на графике. Индикатор разработан на основе практического опыта трейдера и наставника по трейдингу. Он помогает выстроить последовательный процесс анализа: оценивать направление рынка, определять важные уровни и рассматривать несколько таймфреймов в совокупности. Анализ с учётом контекста Значение отдельных сигнало
Fx Levels Premium Indicator Support and Resistance are important concepts in trading. Fx Levels Premium was created to easily draw important levels of support and resistance for the active trader. The indicator will give you all important levels (support/resistance) to watch for a wide range of assets. Trading without these levels on your chart is like driving a car for a long journey without a roadmap. You would be confused and blind. Support and resistance levels should be used as guideline
Meridian Pro
Ottaviano De Cicco
4 (3)
Meridian Pro 2.00: профессиональная multi-timeframe матрица тренда для MT5 Meridian Pro 2.00 - профессиональная адаптивная матрица тренда для MetaTrader 5. Она объединяет оригинальный трендовый движок Meridian, чистый chart ribbon, сигнальные стрелки по закрытому бару, dashboard на 8 таймфреймов, Fuel momentum, weighted consensus, synthetic HTF processing и chart-native линии контекста старших таймфреймов. Цель простая: читать текущий тренд, multi-timeframe структуру, силу, momentum и EA-ready с
Neuro Poseidon - новый индикатор от Дарьи Резуевой. Он сочетает точные торговые сигналы с адаптивными уровнями TP/SL , в результате создавая максимально выгодные сделки! TO SWITCH TO   ENG   PLEASE CHOOSE IT IN THE UPPER-RIGHT CORNER OF THE WEBSITE Напишите мне и получите  Neuro Poseidon Assistant  в подарок для автоматизации вашей торговли! Что отличает его от других индикаторов? 1. Доказанная прибыльность на всех активах и таймфреймах 2. На графике присутствуют только подтвержденные сигналы н
Bill Williams Advanced предназначен для автоматического анализа графика по системе " Profitunity " Билла Уильямса. Индикатор анализирует сразу четыре таймфрейма. Инструкция/Мануал ( Обязательно читайте перед приобретением ) Преимущества 1. Анализирует график по системе "Profitunity" Билла Уильямса. Сигналы помещает в таблицу в углу экрана и на график цены. 2. Находит все известные сигналы АО и АС, а также сигналы зон. Оснащён трендовым фильтром по Аллигатору. 3. Находит "Дивергентный бар", а та
TPA True Price Action indicator reveals the true price action of the market makers through 100% non-repainting signals strictly at the close of a candle! TPA shows entries and re-entries, every time the bulls are definitely stronger than the bears and vice versa. Not to confuse with red/green candles. The shift of power gets confirmed at the earliest stage and is ONE exit strategy of several. There are available now two free parts of the TPA User Guide for our customers. The first "The Basics"
ARICoin is a powerful trading companion designed to generate high-probability entry signals with dynamic TP/SL/DP levels based on volatility. Built-in performance tracking shows win/loss stats, PP1/PP2 hits, and success rates all updated live. Key Features: Buy/Sell signals with adaptive volatility bands Real-time TP/SL/DP levels based on ATR Built-in MA Filter with optional ATR/StdDev volatility Performance stats panel (Success, Profit/Loss, PP1/PP2) Alerts via popup, sound, push, or email Cust
Superhero
Ihor Otkydach
5 (3)
SUPERHERO индикатор - это мультивалютная торговая система, которая создана по принципу "Все включено". Индикатор самостоятельно анализирует рынок и дает сигналы когда открывать и когда закрывать сделки. Используются ордера Стоп Лосс и Тейк профит. Соотношение R:R = 1:1 Эта система может присылать на смартфон PUSH-уведомления, так что вы сможете делать сделки "на ходу" без привязки к ПК. Отлично подходит для Проп Фирм трейдинга. БОНУС ДЛЯ КАЖДОГО ПОКУПАТЕЛЯ: Каждый покупатель этого индикатора пол
Apex Patterns PRO Купите индикатор — получите Expert Advisor на его основе БЕСПЛАТНО. Самооптимизирующаяся система анализа графических паттернов и пробоев Традиционные сканеры паттернов полагаются на фиксированные входные параметры, что часто приводит к снижению их эффективности при изменении рыночной волатильности и структуры. Apex Patterns PRO разработан для адаптации к меняющимся рыночным условиям, объединяя распознавание структурных графических паттернов, фильтрацию по моментуму и статистич
Precision Spike Detector
Francisco Mandomo Simbine
5 (2)
Precision Spike Detector V3 – Institutional-Grade AI Trading System Attention: The price increases by US$50 for every 10 purchases.  Final price: US$599 Precision Spike Detector V3   is a   state-of-the-art, institutional-grade market analysis system   for   MetaTrader 5 , designed to detect   high-probability market movements   in synthetic indices such as   Boom, Crash, GainX, and PainX . After purchase, send me a private message to receive the optimized configuration files,  the installation
Каждый покупатель этого индикатора получает дополнительно Бесплатно: Авторскую утилиту "Bomber Utility", которая автоматически сопровождает каждю торговую операцию, устанавливает уровни Стоп Лосс и Тейк профит и закрывает сделки согласно правилам этой стратегии, Сет-файлы для настройки этого индикатора на различных активах, Сет-файлы для настройки Bomber Utility в режимы: "Минимум Риска", "Взвешенный Риск" и "Стратегия Выжидания", Пошаговый видео-мануал, который поможет вам быстро установить, н
The Oracle Pro
Ottaviano De Cicco
5 (1)
The Oracle Pro: синтетический мульти-таймфрейм движок направленного смещения для MT5 The Oracle Pro — это премиальный мульти-таймфрейм движок направленного смещения (bias) для MetaTrader 5, созданный для требовательных и профессиональных трейдеров. Он дисциплинированно отвечает на один вопрос: каково направленное смещение на каждом таймфрейме прямо сейчас, насколько оно сильное и насколько таймфреймы согласованы? Всё рассчитывается только на закрытых барах — без перерисовки. The Oracle Pro — это
ScalpPoint is a powerful trading companion designed to generate high-probability entry signals with dynamic TP/SL/DP levels based on volatility. Built-in performance tracking shows win/loss stats, PP1/PP2 hits, and success rates — all updated live. Key Features: Buy/Sell signals with adaptive volatility bands Real-time TP/SL/DP levels based on ATR Built-in MA Filter with optional ATR/StdDev volatility Performance stats panel (Success, Profit/Loss, PP1/PP2) Alerts via popup, sound, push, or emai
AriFocus - Non-Repainting Buy/Sell Signals AriFocus - one clear signal. AriFocus marks buy and sell signals directly on the chart and suggests a stop-loss level for each one. Every signal is confirmed on bar close and never repaints. - Buy/sell arrows, confirmed on bar close - Suggested stop-loss level for every signal - Trend band and candle coloring to show direction at a glance - 10 ready-made presets, or your own settings (14 calculation methods) - Pop-up, push and email alerts with entr
ARIPoint
Temirlan Kdyrkhan
1 (4)
ARIBot is a powerful trading companion designed to generate high-probability entry signals with dynamic TP/SL/DP levels based on volatility. Built-in performance tracking shows win/loss stats, PP1/PP2 hits, and success rates — all updated live. Key Features: Buy/Sell signals with adaptive volatility bands Real-time TP/SL/DP levels based on ATR Built-in MA Filter with optional ATR/StdDev volatility Performance stats panel (Success, Profit/Loss, PP1/PP2) Alerts via popup, sound, push, or email Cus
Zain Gold Scalping
Ahmed Gamal Abdel Nasser Mohamed
Комплексный инструмент анализа Price Action, основанный на двух независимых алгоритмах входа (каждый из которых подтверждается границей волатильности) и дополненный набором из девяти настраиваемых фильтров, позволяющих гибко регулировать степень консервативности или агрессивности торговых сигналов. Базовая стратегия Два независимых сценария входа, каждый из которых срабатывает только при выходе цены за пределы динамической границы волатильности. Это обеспечивает два различных способа выявления
Sqn Max Indicator Sqn Max is an exclusive indicator to trade the market with high effectiveness. The indicator is based on price action, volatility and trend. This indicator is as simple as possible but not too simple. The indicator can generate alerts to ease the trading process. You don't have to stay all day in front of your screen. The indicator can be used with any class of assets and with any time frame. It is possible to achieve better results trading our list of selected assets. We achi
Volatility Master for MetaTrader is a real-time dashboard tool that scans up to  50 symbols  to identify high-volatility , trending markets instantly. With bullish/bearish signals, customizable alerts, and a user-friendly interface, it helps you avoid range-bound conditions and focus on high-probability trades. Clarity leads to confidence. Trade confidently and protect your capital effectively with this powerful dashboard. We don't offer free or bonus indicators in exchange of reviews from you.
Naked Forex Tweezer Pro Indicator Tweezer Pro Indicator is a pattern recognition indicator for Forex, Stocks, Indices, Futures, Commodities and Cryptos. The standard Tweezer is a two bar pattern. Our enhanced version is a multi-bar pattern. We filter the patterns for you so that you only get the     best and most effective patterns   and ignore the noise. The Tweezer pattern is a simple and effective pattern to trade. The strategy that comes with the Tweezer is based on price action. The Twe
Advance AI Scanner is a multi-symbol analysis indicator for MetaTrader 5. It scans Forex pairs, metals, energy, stock indices and cryptocurrencies at the same time and rates each instrument with its own self-training model. It explains in plain English what moved each market and why, and it estimates how far upcoming economic news usually moves each symbol, measured on your broker's own price history. $199 instead of $499. 10 copies left at this price. One time purchase  Installation and User
Fibonacci Expansion and Retracement PRO Fibonacci retracing and extended line tools for the MT5 platform, ideal for traders who use the  Golden Section trading Demo: https://www.mql5.com/zh/market/product/35884 The main function: 1. You can draw multiple sets of Fibonacci retracements directly, and the relationship between important return points is clear at a glance. 2. Can draw Fibonacci extensions 3. The Fibonacci foldback and extension of the line can be moved left and right for easy ob
CGE Trading Suite
Carl Gustav Johan Ekstrom
5 (3)
Institutional-Grade Analytics for MT5 The full analytical edge of a professional trading desk, built into your MT5 chart. A full guided tour walks you through every feature step by step. Standard retail platforms lack the depth required for professional market analysis. The CGE Trading Suite bridges this gap, transforming MetaTrader 5 into a comprehensive workspace. By integrating 18 proprietary modules into a single, unified chart interface, the suite eliminates fragmented analysis. It provide
Другие продукты этого автора
MANZANO FOOTPRINT ORDER FLOW Footprint, Order Flow and Volume Analysis for MetaTrader 5 Manzano Footprint Order Flow is an analytical indicator for MetaTrader 5 that brings together Footprint charts, Bid x Ask, Delta, Cumulative Delta (CVD), Imbalances, Volume Profile, VWAP, Market Depth and Time & Sales in an interactive environment. It allows traders to examine activity within individual candles, identify volume concentrations, compare buying and selling pressure, and analyse how market partic
Manzano Risk Box
Patricia Manzano Gomez
Manzano Risk Reward Box You can download the Pro version, featuring a comprehensive control panel, order management, trailing stop, break-even functionality, and funded account protection features, here: https://www.mql5.com/es/market/product/202156 Manzano Risk Reward Box is a visual trade planning and risk management tool for MetaTrader 5, designed to help traders prepare their positions directly on the chart before execution. It allows users to create visual BUY and SELL scenarios, define the
FREE
Harmonic Pattern Suite Pro Introduction Harmonic Pattern Suite Pro is an indicator designed to identify and display harmonic structures on the chart based on X-A-B-C-D sequences. Its purpose is to present pattern formations that meet geometric and proportional criteria, providing a clear visual representation directly on the chart. The indicator automates the detection process, removing the need for manual measurement of ratios and allowing the user to review the structural configuration withou
FREE
Manzano SMC Institutional Pro Smart Money Concepts, ICT, historical statistics, market structure and liquidity analysis for MetaTrader 5. Any SMC indicator can draw zones. Manzano SMC Institutional Pro measures how those zones have behaved in your market and compares their results with randomly chosen levels. See the structure. Check the historical evidence. Understand the market context. Manzano SMC Institutional Pro brings Smart Money Concepts (SMC), ICT methodology, Market Structure, Order B
Smart Adaptive Trend Flow MT4 Professional adaptive trend, market structure, price levels and flow analysis indicator for MetaTrader 4. Would you like to test it before purchasing? Request a fully functional trial version by sending us a private message through MQL5.com and evaluate the indicator directly on your own charts. A Complete Market View Smart Adaptive Trend Flow MT4 combines several analytical components in a single indicator: Adaptive trend analysis. BULLISH and BEARISH market regim
Smart Adaptive Trend Flow MT5 Professional adaptive trend, market structure, price levels and flow analysis indicator for MetaTrader 5. Would you like to test it before purchasing? You can request a fully functional trial version by sending us a private message through the MQL5 messaging system . This allows you to evaluate the indicator and all its features before making a purchase decision. A Complete Market View in a Single Chart Smart Adaptive Trend Flow MT5 has been developed to provide a
Plan, execute and protect every trade in MetaTrader 5: exact risk-based lot size, automatic management, baskets and Prop Firm rules in a single panel. Manzano Trade Manager Pro is a professional trade manager for MetaTrader 5, designed especially for traders who trade funded accounts (Prop Firms) and need advanced control over risk, execution and position management. It brings together in one tool visual trade planning, automatic lot size calculation, individual, collective and basket managemen
Manzano Index Intelligence Analysis of the underlying constituents of the Nasdaq 100, S&P 500 and Dow Jones 30 for MetaTrader 5 It is not just about knowing where an index is moving, but understanding what is driving that move. BEFORE BUYING OR TRYING: CHECK YOUR BROKER The indicator requires your broker to provide both the index CFD and CFDs for its constituent stocks within the same MT5 account. Having a Nasdaq 100, S&P 500 or Dow Jones 30 CFD does not necessarily mean the broker also offers i
Фильтр:
Нет отзывов
Ответ на отзыв