Manzano Volume Profile VWAP Levels

Manzano Volume Profile VWAP Levels

Professional futures traders read the market through volume: where the session VWAP sits, where value was built, which levels price has not revisited yet and who is really pushing, buyers or sellers. On platforms like Sierra Chart all of this sits on one chart. On MetaTrader 5 it usually means five or six separate indicators, each with its own style, that do not talk to each other.

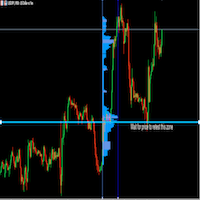
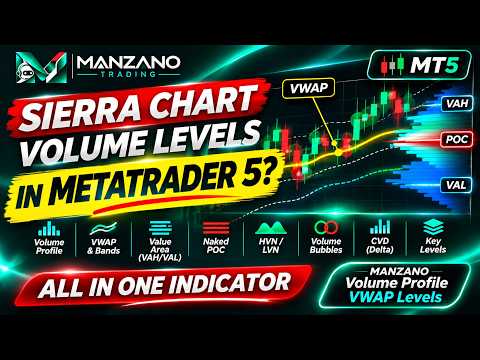
Manzano Volume Profile VWAP Levels brings that complete volume map to MT5 in a single indicator. It includes session, weekly and monthly VWAP with deviation bands; session and composite volume profiles; value areas of the day, week and month; naked POC bands; HVN and LVN zones; opening range and initial balance; tick-by-tick volume bubbles; and a session cumulative delta pane. All of it lives in one professional interface where every layer can be switched on or off with a click.

This is not a basic profile with a VWAP added on top. It is a complete workstation for reading value, acceptance and pressure, designed for intraday traders of indices, gold, FX and futures CFDs.

What you see at a glance

When you open a chart, the indicator answers the questions that matter before every trade:

  • Is price above or below the fair value of the day (VWAP), and how stretched is it in standard deviations?
  • Is price trading inside, above or below yesterday's value area?
  • Where are the high volume nodes that tend to attract and hold price, and the low volume areas price tends to cross quickly?
  • Which POCs from previous sessions are still untouched?
  • Where are the overnight range, the opening range and the initial balance?
  • Are aggressive buyers or aggressive sellers in control of the session right now?

The top bar shows this context permanently with three chips: price position in VWAP deviations, position against the previous value area, and today's volume compared with the average of the last sessions.

Session VWAP with deviation bands

The session VWAP is the volume weighted average price of the day: the reference institutions use to judge whether they are buying expensive or cheap. It is drawn with up to three standard deviation bands (1, 2 and 3 sigma), all of them volume weighted. When price reaches the second band it is statistically stretched, and these areas are often where moves slow down or rotate.

  • Anchor at the session start or at the cash open (for example 16:30 broker time for US indices)
  • Bands of 1, 2 and 3 deviations, each switchable
  • Line tags at the end of each curve (VWAP, SD1+, SD2-...) so the chart stays readable
  • Hover the VWAP to see its value, the sigma and where price sits in deviations

Weekly and monthly VWAP

The weekly VWAP starts with the first session of the week and shows the average price of the week, with an optional 1 deviation band. The monthly VWAP does the same for the month. Together they tell you whether the intraday move goes with or against the value of larger participants.

Volume profiles: session, composite and history

A volume profile shows how much was traded at each price. It is the clearest picture of where the market accepted value and where it rejected it.

  • Session profile: drawn next to the last bar and updated live, with today's POC, VAH and VAL
  • Composite profile: drawn on the right edge, covering the current week, the current month, the previous session or the last N sessions (2 to 20)
  • Value area (70% of the volume) highlighted and POC row marked in red
  • Heat colours: rows coloured by intensity, from blue (little volume) to red (heavy volume), so the nodes stand out immediately
  • Optional profile behind every past session, to see how value migrated day by day
  • Optional volume heatmap: each session's volume by price painted as heat stripes behind the candles
  • Automatic row size (based on the average daily range) with fine, normal, coarse and very coarse settings, or a fixed size in price
  • Adjustable composite width, with the profile placed next to the label column so it never covers the level tags

Value areas of day, week and month

The indicator draws the VAH, VAL and POC of five periods, each clearly labelled on the right edge:

  • Today (developing): VAH, VAL, POC
  • Previous session: PD VAH, PD VAL, PD POC
  • Current week: WK VAH, WK VAL, WK POC
  • Previous week: PW VAH, PW VAL, PW POC
  • Current month: M VAH, M VAL, M POC

Labels are stacked automatically so they never overlap. Opening inside, above or below yesterday's value, and accepting or rejecting the edges of value, are central ideas of auction market theory. Here they are visible without drawing a single line by hand.

Naked POC bands: the levels price has not revisited

The coloured horizontal bands are one of the most recognisable features of professional volume charts. They mark the POC of previous sessions that price has not traded back to (naked POCs). Many traders watch them as magnets and targets. Each band starts at its session, carries its date and disappears automatically as soon as price trades through it, so your chart only shows levels that are still open.

  • Naked POC bands, plus optional naked VAH and VAL bands
  • Number of recent sessions with bands, adjustable from 1 to 15
  • Hover a band to see its exact price and the session it comes from

HVN and LVN zones

From the composite profile the indicator extracts high volume nodes (HVN), areas of strong acceptance where price tends to slow down and rotate, and low volume nodes (LVN), thin areas price tends to travel through quickly. They are drawn as wide zones across the chart, with an adjustable number of zones of each type.

Lines or heat bands: your choice

Every level can be drawn as a classic line, as a heat band that glows in the centre and fades out, or as both at once. Heat bands give the chart the soft, layered look of professional order flow platforms and make the important levels stand out without visual noise.

Key intraday levels

  • Previous session high, low and close (PDH, PDL, PDC)
  • Overnight high and low before the cash open (ONH, ONL)
  • Opening range high and low (ORH, ORL), with configurable minutes
  • Initial balance high and low (IBH, IBL), with configurable minutes
  • Previous week high and low (PWH, PWL)
  • Session open and cash open

Levels that are still forming (opening range, initial balance) carry an asterisk until they are complete. Session start, cash open and cash close are set in broker time, so the indicator adapts to any broker and any market.

Tick-by-tick volume bubbles

The bubbles are calculated from real ticks with an aggressor engine, the same approach used in order flow footprints. For each bar the indicator finds the exact prices where volume concentrated and draws a bubble there, sized by volume and coloured by the aggressor imbalance at that price: green for aggressive buyers, red for aggressive sellers, neutral grey when both sides were balanced. Hovering a bubble shows its volume, the imbalance percentage, how many times larger it is than the average row, and the time.

  • Minimum size adjustable as a multiple of the average row volume
  • Volume printed inside the bubble, optional
  • On charts above H1, bubbles switch to bars with abnormal volume

Session cumulative delta (CVD) pane

At the bottom of the chart, a dedicated pane shows the cumulative delta of each session as candles: aggressive buying minus aggressive selling, reset at every session start. With one click it switches to the delta of each bar as a histogram, to compare the pressure of individual bars. The vertical scale of the price chart adjusts automatically so the pane never covers the candles.

  • Calculated tick by tick where ticks are available (bright colours)
  • Estimated from M1 bars outside the tick history (dimmed colours), so the source is always clear
  • Adjustable pane height, cumulative or per-bar mode, automatic candle scale on or off
  • Hover any bar to see its delta, the session total and the data source

Options levels

If you follow options positioning, you can add your call wall, put wall, gamma flip and three custom levels with your own names. Click PLACE and then click the chart, or type the prices in the inputs. They are drawn as purple tags and saved per symbol. MT5 does not provide options data, so these levels are entered by you from your own source.

Side dock with four tabs

  • Levels: the nearest levels above and below price, with their name, price and distance in ATR. You always know what is next in both directions.
  • Profile: a summary of the session. It shows today's POC, VAH and VAL, range and volume compared with their averages, session delta, profile shape (P, b or D), opening type (inside value, above or below value, out of range), initial balance compared with its average, the weekly and monthly value areas, and a plain-words reading of the context.
  • Log: the key events of the last sessions. These are initial balance and opening range breaks, closes beyond the previous VAH or VAL, returns inside the previous value, VWAP 2 sigma band touches and naked POCs being filled. Click an event and the chart jumps to that bar and highlights it.
  • Info: data used, number of sessions, row size, volume type, session times and calculation time, plus language, theme and reset buttons.

Interface designed for speed

  • Layers bar: nine layers (VWAP, weekly and monthly VWAP, profiles, value areas, bands, key levels, bubbles, options, CVD) switchable with one click
  • Presets: Sierra (everything), VWAP, Profile and Clean (levels only)
  • Left rail with an options panel for every layer, so nearly every setting can be changed without opening the inputs
  • Symbol selector with search (Market Watch or all symbols) and timeframe menu in the top bar
  • Price, daily change and context chips always visible
  • Hover cards with the details of every level, zone, profile and bubble
  • Built-in legend explaining every colour and mark
  • Status bar with bar countdown, broker time, number of levels, row size and volume type
  • Dark and light themes, nine bullish and bearish colour sets, three dock widths
  • English and Spanish interface
  • Settings saved automatically and restored the next time
  • Everything drawn on one canvas, without chart objects, so the object list stays clean and the chart stays responsive

Data and calculation

All calculations use your broker's own data. Profiles and VWAPs are built from M1 history (10 to 60 sessions, plus the current month and the previous week), using real volume when the broker provides it and tick volume otherwise. The tick engine for bubbles and CVD loads 1 to 5 sessions of ticks and works on charts up to H1. The indicator works on any symbol and timeframe. It is designed especially for intraday trading on M1 to M30 charts of indices, gold, FX and futures CFDs.

Input parameters

The inputs are grouped into clear blocks:

  • Language and appearance: language, theme, colour set, start-up preset, fonts, dock
  • Sessions: session start, cash open and close, opening range and initial balance minutes, sessions of history
  • Volume data: volume source, row size, tick engine and tick sessions
  • Layers: start-up state of the nine layers
  • VWAP, profiles, value areas and bands, key levels, bubbles and CVD: start-up options of each block
  • Options levels: prices and names of the manual levels
  • Colours: every element can be recoloured

Strategy Tester

The indicator runs in the visual Strategy Tester with the full interface. Use "Every tick based on real ticks" to see the tick-by-tick bubbles and CVD. Zoom and scrolling are done with the tester chart's own controls.

Who it is for

  • Intraday traders of indices, gold, FX and futures CFDs who work with VWAP, volume profile and auction market concepts
  • Traders coming from Sierra Chart, NinjaTrader or ATAS who want the same volume levels on MetaTrader 5
  • Discretionary traders who want context before every decision: value, acceptance, untouched levels and pressure

Important

Manzano Volume Profile VWAP Levels is a visual analysis tool. It does not generate trading signals, alerts or orders, and it does not promise any result: trading decisions remain yours. For questions or suggestions, contact me through MQL5 private messages.

おすすめのプロダクト
Footprint Zones MT5 – Supply and Demand with Order Flow Analysis Footprint Zones is a MetaTrader 5 technical indicator designed to help traders study supply and demand areas, buying and selling activity, volume imbalance, price rejection and potential trading opportunities. The indicator combines price structure analysis with footprint calculations to provide additional information about market activity around important price levels. It identifies potential demand and supply zones, evaluates pri

The 4 headed dragon is an indicator that has two functions. 1) Set the background trend. 2) Mark the predominant trend. By combining these two indicator signals, we will be able to trade for or against the trend, adapting the signals to your reading of the market. You can download the demo and test it yourself. 1) Set the background trend.    Define four possibilities of trend that are the four heads of the dragon, marked by colors on the indicator, marking a) Powerful buying trend. b) Weak
With Fixed Range Volume Profile,The traces left by the big players will not go unnoticed by you. Professional   Volume Profile   Indicator reveals Institutional order flow. This advanced market indicator will teach you to spot the buying and selling. Dont want to say more because its well known by most professionals  trader. This Indicator : -  Quickly Identify the Strongest Institutional S/R Zones. - W orks with all Trading Instruments (Forex, Futures, Indexes, Commodities, Stocks, Cryptocurr
Smart Adaptive Trend Flow MT5 Professional adaptive trend, market structure, price levels and flow analysis indicator for MetaTrader 5. Would you like to test it before purchasing? You can request a fully functional trial version by sending us a private message through the MQL5 messaging system . This allows you to evaluate the indicator and all its features before making a purchase decision. A Complete Market View in a Single Chart Smart Adaptive Trend Flow MT5 has been developed to provide a
Fixed Volume Profile
Carlos Pascual Perez Maturano
This indicator, titled "Fixed Volume Profile.mq5", is a custom tool for MetaTrader 5 (MQL5) designed to calculate and display a Volume Profile over a user-defined fixed time range. The Volume Profile shows the distribution of trading volume at different price levels during a specific period, helping to identify areas of high activity (such as Points of Control or POCs) and volume-based support/resistance areas. Main Functionality: Interactive Range: The indicator creates two vertical lines on
FREE
Crypto_Forex MT5用インジケーター「HTFボリンジャーバンド」 - MT5用プロフェッショナルインジケーター「HTFボリンジャーバンド」でトレード手法をアップグレードしましょう。HTFとはHigher Time Frame(高時間枠)の略です。 - ボリンジャーバンドは市場で最も優れたインジケーターの一つであり、トレードに最適なツールです。 - 価格変動の約90%は2つのバンド間で発生します。 - HTFボリンジャーバンドインジケーターは、プライスアクションエントリーや他のインジケーターと組み合わせたマルチタイムフレームトレードシステムに最適です。 - このインジケーターを使用すると、高時間枠のボリンジャーバンドを現在のチャートに表示できます。 Click here to see high quality Trading Robots and Indicators! これはMQL5ウェブサイトでのみ提供されるオリジナル製品です。
The indicator calculates ZigZag using the classic algorithm with three parameters: Depth, Deviation, and Backstep. Its main function is detecting and visualizing repaints — moments when the last ZigZag point shifts to a new bar. Upon loading, the indicator performs a simulation over the specified history depth. The algorithm sequentially recalculates ZigZag for each bar, comparing the current position of the last point with the previous one. If a shift is detected, a repaint line appears on the
FREE
Gold Signal Swing Pro XAUUSD with Auto TP SL — 7層フィルター + RR保証システム搭載 XAUUSDスイング完全トレードシステム リペイントなし。リドローなし。ラグなし。すべてのサインは確定後に変わりません。 購入者限定特典:買い切りライセンスをご購入いただいた方に、AI Zone Radar($59相当)+PDFマニュアルを無料プレゼント。購入後にMQL5でメッセージをお送りください。 AI Zone Radar: https://www.mql5.com/en/market/product/175834 MT4版もあります: https://www.mql5.com/ja/market/product/177778?source=Site +Market+Product+Page ゴールドトレーダーのコミュニティで実際に使用され、精度と使いやすさで高評価。 こんな方におすすめ 仕事や家事で忙しく、M5/M15に張り付けない方 厳選されたサインだけで運用したい方 寝てる間や外出中もポジションを持っておきたい方 1サインで大きく取りたい方
Session Volume Profile Pro draws a horizontal volume histogram for each trading session and highlights the price levels where the market spent the most activity. It gives you the three key reference levels professional volume traders rely on: the Point of Control (POC), the Value Area High (VAH) and the Value Area Low (VAL). KEY FEATURES Point of Control (POC): the highest-activity price of the session, acting as a fair-value magnet. Value Area (default 70%, configurable): the price range contai
The Killshot Spike Indicator is a premium, institutional-grade tool developed by Coetsee Digital, specifically engineered to catch violent algorithmic spikes. Crafted for traders focusing on Weltrade, Deriv, and SpaceMarkets synthetic indices, this indicator is optimized to operate on the 3-minute (M3) and 5-minute (M5) timeframes. Equipped with an intelligent Auto-Market Detection system, the indicator seamlessly adapts its algorithm based on the chart you apply it to. It supports Bullish-spiki
RSIScalperProをご紹介します - MetaTrader 5用のRSIベースの画期的なインジケーターで、1分足チャートでのスキャルピングに最適です!RSIScalperProを使うことで、正確なエントリーとエグジットのシグナルを得られる強力なツールを手に入れることができます。 RSIScalperProは、オーバーボートとオーバーソールドのレベルに対する明確なシグナルを提供する2つの異なるRSI指標を使用しています。好みに合わせて2つのRSIの時間枠や制限値を調整することができ、トレーディング戦略に最適な結果を得ることができます。チャート上の個々の矢印は、トレードのエントリーとエグジットのタイミングを簡単に特定するのに役立ちます。 また、RSIScalperProの特徴の1つは、カスタマイズ可能な3つの移動平均線です。これにより、トレンドの方向を判断し、強力なトレードシグナルを確認するのに役立ちます。これにより、早い段階でトレンドを検出し、収益性の高い取引に参加することができます。 さらに、RSIScalperProを新しい取引シグナルが出た際に音で知らせるように設定するこ
Here   our more valuable tools SMC Trend Trading   ,  Easy SMC Trading  ,  Institutional SMC Architect Volume Analysis Tools  ,  Volume flow Profile  ,  Market volume profile  , FVG with Volume  , Liquidity Heatmap Profile  ,  Volume Spread Analysis The Trading Guide MT5 Indicator is a powerful psychological trading assistant designed to keep traders disciplined, focused, and emotionally balanced. This innovative indicator displays real-time motivational messages, trading rules, and analysis
FREE
CRV Z-Score Engine is a professional market structure indicator that transforms raw price into normalized,  multi-horizon statistical structure model   It reveals: When price is statistically stretched When the market is transitioning between regimes When a move is structurally aligned across multiple horizons This is not a lagging oscillator . It is a multi-horizon statistical structure model built for serious traders. WHAT IS Z-SCORE? Z-Score measures how far price deviates from its n
CRT + Volume Profile  Candle Range Theory levels on several timeframes, filtered by the previous session's volume profile, with lower-timeframe entries (CISD / MSS) and strips of higher-timeframe candles drawn right of price. One indicator for the whole CRT workflow: where the range is, whether the sweep happened at a level that matters, and where the entry shift is. HOW THE CRT MODEL IS DETECTED - C1 is the range candle. Its high and low become CRT H and CRT L, with the 0.5 level between the
NeuroTrend Dashboard – Advanced Multi-Asset Market Intelligence NeuroTrend Dashboard is a professional-grade technical analysis suite designed to provide a high-level, "bird’s-eye view" of market momentum across multiple symbols and timeframes simultaneously. By synthesizing complex proprietary momentum, real-time currency strength, and volume flow data, NeuroTrend distills the pulse of the market into a clean, actionable interface. Stop wasting time switching between individual chart windows. N
Ziva LSE System
Hassan Abdullah Hassan Al Balushi
ZIVA LSE System A Professional Liquidity & Structure Execution Framework Executive Overview ZIVA LSE System is a professionally engineered analytical framework designed to interpret market behavior through structural logic and liquidity dynamics. It is not positioned as a conventional indicator. Rather, it functions as a structured execution environment that organizes price action into a clear, disciplined decision-making model. The system is built to deliver consistency, clarity, and controlled
Title: Smart VP: Buy/Sell Bars + POC Description: Enhance your trading with the Right Anchored Volume Profile. Visualize buy and sell volumes per price level with near-bar numbers and identify the Point of Control (POC) instantly. Perfect for traders who want clear market structure at a glance. Features: Right Anchored Volume Profile Buy/Sell volume bars Near-bar volume numbers POC (Point of Control) line Customizable colors and display settings
ModGod Scalp Pullback - Precision Trend & Reversion Engine LAUNCH PROMOTION: Only $49 for the first 10 copies! The official price will be $490. Buy before the price goes up! The   ModGod Scalp Pullback   is an advanced, all-in-one indicator designed for professional scalpers and day traders. It combines the extreme smoothness of Triangular Moving Averages (TMA) with Heikin-Ashi trend filtering to provide highly accurate pullback entries and extreme exhaustion reversals. By mapping the natu
Volume Profile FREE — Multi-Session Heatmap (POC · VAH · VAL) See where trading activity actually occurs—not just where price moves. This indicator builds a clear, color-coded Volume Profile Heatmap directly on your chart and highlights the market's most important price levels: the Point of Control (POC) and the Value Area (VAH/VAL) , where price is most likely to react.
FREE
Emotions are a weakness. QHO mathematics is the future of your trading! You know what really truly frustrating?  Information garbage and noise. All those legacy, lagging indicators on the charts look like an attempt to steer a rocket ship with a steam engine. They are useless. They look at the past while the market is already flying forward on next-gen tech. We created QHO. This is not just another indicator. This is pure mathematics crushing market chaos right on your chart. Imagine completely
Narval
Adier Antonio Pereira
Narvalは、マクロとミクロの間で価格が「圧縮されている」場所を特定します。一般的なインジケーターにはできないことを実現します。過去では広い範囲から始まり、現在のローソク足に向かって調整される「プレッシャーフィールド」を形成します。 価格がこのフィールドに入ると、勢いが弱まります。そこでNarvalは、急激な動きに先行する機関投資家の行動、つまり否定とW/M型の構造的な罠を探します。 チャート上で確認できるもの: Institutional Check(機関チェック): 価格の合意を表す3本のライン。ゴールドのラインはその合意の中心であり、市場が現在の方向を継続するのか、それとも否定するのかを判断するポイントです。 Intention Points(意図ポイント): 価格がチェック領域の内部にあり、上位時間足の階層によって検証された否定または構造的な罠を示した場合にのみ、Narvalは矢印を表示します。チャートを不要に混雑させません。確定したローソク足のシグナルはリペイントされません。 Narvalは、買うべきか売るべきかを指示するものではありません。市場が脆弱になっている場所を示し
FREE
This Indicator adding power to traditional zigzag indicator. With High-Low numbers in vision it will be easier to estimate change of trend by knowing the depth of each wave. Information including points, pips, percentage%, and #bars can be displayed based on configuration. All information is real-time update. This indicator is especially useful in sideway market to buy low sell high.
The indicator colors the candles relative to their volume delta. The calculation of the candles delta is based on the tick history or on the deals tape history (see below for a description of the input variable "Volumes"). Coloring is performed by two parameters : by delta sign, as candle color, by delta value, as candle color contrast against chart window background color. In addition to coloring the candles, the indicator also displays the delta profile on the interval specified by the user
Astral Volume 出来高加重モメンタムを広い視点で読む。 発売記念価格 — $78 · 35%オフ · 発売記念価格の終了後は$120。 現在の時間足で強い動きが見えても、上位時間足では異なる場合があります。価格と出来高を併せて分析するトレーダーのために、Astral Volume は方向転換を評価する前に、現在の値と広い時間軸の状況を一つにまとめます。 動きを背景とともに評価。 ティック出来高で加重したモメンタムと、その強度が直近の履歴に対してどの位置にあるかを確認できます。 一致と不一致を把握。 現在の値と2つの上位時間足を並べて確認でき、別々のチャートを頭の中で組み合わせる必要がありません。 確認条件を統一。 方向転換シグナルを採用するために、どの時間足の一致を必要とするか選べます。 モメンタム、相対的な強度、時間足の一致をまとめて確認したい手法に Volume を活用できます。使用するのはブローカーのティック出来高であり、集中市場の約定出来高や約定注文フローではありません。 背景とともに市場を読む Volume: 現在のチャート時間足。ヒストグラムがオシレーターを示し
ゴールド、ビットコイン、シルバー、ナスダック向けトレンドシステム:主要トレンド方向へのブレイクアウトエントリー、価格を追うストップ、ロット計算機、ご自身の履歴での各銘柄の実際の統計。 発売記念価格 39 USD – 次の価格は 49 USD。ご購入後:PDF ガイドと設定の個別サポート。 RGT Trend Rider – ゴールドとビットコインの大きな動きに乗る チャート上に明確なプラン:どこでエントリーし、ストップはどこで、ロットはいくつか、そして表示中の銘柄でルールがどう機能したか。 仕組み • 価格が主要トレンドの方向に直近レンジをブレイクすると BUY / SELL の矢印を表示。 • ボラティリティに基づくストップ(点線)が価格を追って動きを守ります。 • ストップに触れるとエグジットマークを表示。 • リペイントなし:シグナルは足の確定時に確定します。 パネル • トレンド、保有ポジション、トレーリングストップ、含み損益。 • リスク%と口座サイズからのロット計算。 • ご自身の履歴でのルール統計:取引数、勝率、プロフィットファクター、結果、ドローダウン(スプレッド込
Horizontal Volumes Indicator - using a histogram, displays the volume of transactions at a certain price without reference to time. At the same time, the histogram appears directly in the terminal window, and each column of the volume is easily correlated with the quote value of the currency pair. The indicator practically does not require changing the settings, and if desired, any trader can figure them out. The volume of transactions is of great importance in exchange trading, usually an inc
NQX Deviation Return CalmはMetaTrader 5用のシグナルインジケーターです:乖離からの回帰のシグナル(ボラティリティが直近の平均を下回る落ち着いた相場環境でのみシグナルを出します)。 極端な乖離から戻る価格を検出するNQX独自のロジックです。ボラティリティが直近の平均を下回る落ち着いた相場環境でのみシグナルを出します。推奨エントリー、短いストップ、遠めのターゲット(3:1、5:1、10:1、スイングでは最大20:1)を表示します。判断するのはあなたです。 チャート上に表示されるもの - 確定したシグナル足に矢印を表示します(確定したシグナルがリペイントされることはありません)。 - 推奨エントリー、短いストップ、遠めの推奨ターゲット(デフォルトはリスクの5倍)、さらに3 x 1、5 x 1、10 x 1の参考ライン。 - レベルに到達すると、チャート上にラベル(ターゲットまたはストップ)が表示されます。 - 最新のシグナルと、表示中の履歴に出現したシグナル数を示すパネル。 - 新しいシグナルのポップアップ通知とプッシュ通知(オプション)。 NQX独占ロジ
See every hour against its own past Session Pulse measures how each hour of the week usually behaves. It reads the symbol's H1 history on your broker and builds a weekday by hour fingerprint, Monday to Friday, hour by hour. For each hour of each weekday it stores the usual range, the usual spread and how often that hour produced a spike. Then it puts the live market next to that fingerprint. Main features 1. Weekday by hour fingerprint. Monday 09:00 and Friday 09:00 are different hours, and S
SessionFlowMap — POCレベル付きマルチセッション出来高・デルタプロファイル SessionFlowMap は、FXの取引日を構成する各セッション(アジア、ロンドン、ニューヨーク。必要に応じてシドニーと任意のカスタムセッション)について、出来高プロファイルとデルタプロファイル(買いと売りの偏り)を作成し、チャート上に表示します。各セッションで POC(Point of Control:最も多く取引された価格)と Value Area(VAH と VAL:出来高の大部分が集中した範囲)を算出し、それらのレベルを水平線として右へ延長します。各セッションで市場がどこに時間と資金を費やしたか、そしてどのレベルが再び意識されそうかが一目で分かります。 MT4-version:  https://www.mql5.com/en/market/product/200941 動作の仕組み 各セッションは、それぞれの時間帯に従って M1 履歴から切り出されます。アジア、ロンドン、ニューヨーク、シドニーの時間は GMT で設定し、ブローカーのサーバー時間へ自動変換されます。カスタムセッシ
Market structures, Market balance, Range breakouts This tools helps to identify areas of market ranges, structures and plots colored boxes on breakout of those areas. User is given the option to receive alerts and notifications on the formation of the blocks. The tool has the ability to become an essential part of a technical trading system or even pure price action trading. Usage:- An essential tool for price action or technical traders.  More information in the blog
このプロダクトを購入した人は以下も購入しています
Trend Sniper X
Sarvarbek Abduvoxobov
4.87 (46)
Trend Sniper X は、トレードの方向性と潜在的な反転ポイントを明確かつ正確に特定するのに役立つ、MetaTrader 5 用のマルチタイムフレーム・トレンドフォロー指標です。 MT4用: https://www.mql5.com/en/market/product/193245 価格情報: 現在の価格はプロモーション価格であり、今後のアップデートや新機能のリリースに伴い変更される場合があります。 ボーナス特典: このインジケーター用の無料自動売買アシスタントEAを入手するには、購入後に an 著者(開発者)へメッセージをお送りください。 Code2Profit チャンネル マルチタイムフレーム分析で相場をマスターしよう! Trend Sniper X で勝率を最大化する方法:重要なルールとセッションのコツ 技術仕様 プラットフォーム MetaTrader 5 インジケータータイプ マルチタイムフレーム・トレンドインジケーター 操作タイムフレーム あらゆるチャートタイムフレームに対応。個別に選択可能な上位タイムフレーム (M1–MN1) を搭載 主要銘柄 FX、ゴールド (X
Entry Points Proは リペイントしない MT5インジケーターで、注文を出す前に、エントリー価格、ストップロス、ロットサイズ、そして金額での想定リスクを表示します。資金と1回のトレードあたりのリスクを設定してください。ロットサイズはパネルが計算します。 スクリーンショットでは、4357.65がブレイクアウトのエントリー水準、4324.53がストップで、0.04ロットなら想定リスクは$132です。 MT5のストラテジーテスターで無料でお試しください。Entry Points Proを選択し、XAUUSD H1を選んで、ビジュアルモードで開始してください。ご購入後は、私が個人的に設定をお手伝いします。 199 USDで買い切り。 20回のアクティベーションと製品アップデートが含まれます。 無期限ライセンスの価格は、次の3本のご購入後に249 USDへ上がります。 1か月のレンタルは99 USDで、MT5のリアルタイムチャートでインジケーターをお使いいただけます。 マーケットは、該当する付加価値税(VAT)を含めた最終価格をお支払い時に表示します。 Entry Points Pr
Gann Made Easy   は、ミスター・ギャンの理論を使用した取引の最良の原則に基づいた、プロフェッショナルで使いやすい外国為替取引システムです。 W・D・ガン。このインジケーターは、ストップロスとテイクプロフィットレベルを含む正確な買いと売りのシグナルを提供します。 PUSH通知を利用して外出先でも取引可能です。 ご購入後、取引方法の説明と優れた追加インジケーターを無料で入手するには、私にご連絡ください! おそらく、ギャンの取引手法についてはすでに何度も聞いたことがあるでしょう。通常、ギャンの理論は初心者のトレーダーだけでなく、すでにある程度の取引経験がある人にとっても非常に複雑なものです。なぜなら、ギャンの取引手法は理論的にはそれほど簡単に適用できるものではないからです。私はその知識を磨き、最良の原則を私の外国為替インジケーターに組み込むために数年を費やしました。 このインジケーターは非常に簡単に適用できます。必要なのは、それをチャートに添付し、簡単な取引推奨事項に従うだけです。このインジケーターは常に市場分析の仕事を行い、取引の機会を探します。適切なエントリーポイントを検
ULTRAは、「オールインワン」方式で機能するテクニカル指標です。市場を独自に分析し、売買シグナルを生成し、ストップロス注文を設定するための水準を表示し、利益を確定したり損失を最小限に抑えたりするためにポジションを決済すべきタイミングを提案します。 つまり、市場の分析方法や、水準(ストップロスをどこに設定すべきか)の見極め方がわからなくても、あるいは資金管理に苦労していても問題ありません。ULTRAがすべて代行してくれます! 購入者限定特典 :「ULTRA」インジケーターをご購入後、私にプライベートメッセージをお送りいただければ、「ULTRA BOT」を無料プレゼントとしてお受け取りいただけます。これは、このインジケーターからのシグナルに基づいて、オープンしたトレードを管理するのに役立つ特別なツールです(各トレードにストップロスを設定し、最適な結果が得られるよう、戦略のルールに従って自動的にトレードを決済します)。  また、インジケーターを最大限に活用できるよう、さまざまな資産向けの既成の設定も購入者の皆様に提供しています。これらの「超お得な特典」を無料で入手するには、私へダイレクトメ
通貨強さウィザードは、取引を成功させるためのオールインワン ソリューションを提供する非常に強力な指標です。このインジケーターは、複数の時間枠のすべての通貨のデータを使用して、このまたはその外国為替ペアのパワーを計算します。このデータは、使いやすい通貨インデックスと通貨パワーラインの形式で表され、特定の通貨のパワーを確認するために使用できます。 必要なのは、取引したいチャートにインジケーターを接続することだけです。インジケーターは、取引する通貨の実際の強さを示します。このインジケーターは、トレンドに合わせて取引するときに有利に利用できる売買高の圧力の極値も示します。このインジケーターには、フィボナッチに基づく可能なターゲットも表示されます。 このインジケーターは、PUSH 通知を含むあらゆるタイプのアラートを提供します。 購入後ご連絡下さい。私の取引のヒントをあなたと共有し、素晴らしいボーナスインジケーターを無料で提供します! 幸せで有益な取引をお祈りします。
もう勘でトレードしなくていい。 エントリーのタイミング、決済の場所、相場がどちらに傾いているか、そのすべてが1つのチャートで分かります。 RelicusRoad Proは、20種類近くのツールを1つのインジケーターにまとめました。自分のトレードスタイルに合うツールだけをオンにできます。 エントリーは明確に。決済も明確に。すべてのチャートに計画を。 心当たりはありませんか? 買った途端、1分もしないうちに価格が逆行する。 早めに決済してしまい、その後も値動きが続くのを眺めている。 チャートにインジケーターを5つ並べても、答えは5通りある。 ストップロスの位置は、なんとなく決めている。 開発した理由 私たちは18年間、FXを取引してきました。RelicusRoadの中核となるアルゴリズムは、最初は非公開で、私たちプロのトレーダー仲間のために作られました。 きっかけは個人的なものでした。毎回同じラインを手で引き、自分たちで決めたルールを破り、チャート上の重要な一点を見落とすことに、私たちは疲れていたのです。 私たちにとって効いたのは一貫性です。毎日同じ方法で相場を読み続け、それが体に染みつく
マルチ通貨強度・モメンタム・インジケーター MT5 Dynamic Forex28 Navigator は、長年ご愛用いただいている人気インジケーターの進化形であり、5つの力を1つにまとめたものです。 Advanced Currency Strength28 Indicator (700件のレビュー) Advanced Currency IMPULSE with ALERT (530件のレビュー) Currency Strength EXOTICS GOLD Impulse with Alert CS28 Combo Signals (最近のボーナス) 4つのインジケーターを購入してチャートに重ねる必要はありません。すべてが1つの強力なインジケーターに統合されています。28通貨ペアの強度、それらを導く市場のモメンタム、そして両方のアラートを、1つのウィンドウ、1つのチャートで。 上記のプログラムは MQL5 Market で1,200件以上のレビューを獲得し、2016年から MT4 コミュニティで定番となっています。Dynamic Forex28 Navigator MT5 は、実証済
Azimuth Pro
Ottaviano De Cicco
5 (7)
Azimuth Pro V2:MT5向けシンセティック・フラクタル構造分析と確認済みエントリー 概要 Azimuth Pro は Merkava Labs によるマルチレベルスイング構造インジケーターです。4つのネストされたスイングレイヤー、スイングアンカーVWAP、ABCパターン検出、3タイムフレーム構造フィルタリング、そして確定バーでの確認済みエントリー — 1つのチャートで、ミクロスイングからマクロサイクルまでを網羅するワークフロー。 これはブラインドシグナル製品ではありません。ロケーション、コンテキスト、タイミングを重視するトレーダーのための構造ファーストワークフローです。 1. V2での変更点 シンセティック・マルチタイムフレームエンジン 上位タイムフレーム分析をMeridian Proと同じ独自のシンセティックアーキテクチャで一から再構築。よりクリーンなHTFコンテキスト、安定したライブ動作、従来のMTF同期問題なし。シンセティックエンジンは 固定比率タイムフレームカスケード (x2、x3、x4、x6)も可能にします — ブローカーのタイムフレーム間の任意なジャンプの代
Boba Analysis Suite
Trade Ready Solutions LLC
5 (2)
Boba Analysis Suite Boba Analysis Suite は、MetaTrader 5 向けの分析インジケーターです。市場構造、重要な価格帯、相場全体の状況を、一つのチャート画面にまとめて表示します。 トレーダーおよびトレーディング指導者としての実務経験をもとに開発され、市場の方向性の評価、重要な価格水準の特定、複数の時間足を組み合わせた分析など、体系的な分析プロセスを支援します。 相場の背景を踏まえた分析 個々のシグナルの意味は、相場の状況によって変わります。Boba Analysis Suite は、現在のチャート状況をより大きな市場構造と関連付け、あらかじめ定めたルールに沿って取引アイデアを検討するための分析を支援します。 主な分析機能: トレンドと市場構造: 市場の方向性と、その背景にある構造を評価します。 重要な価格帯と価格水準: さらに分析すべき重要な領域を視覚的に表示します。 複数の時間足: 異なる時間足の情報を組み合わせ、相場全体の状況を評価します。 視覚的な分析プロセス: 分析情報をチャート上で直接確認できます。 自主的な取引判断を支援 Boba
Fx Levels Premium Indicator Support and Resistance are important concepts in trading. Fx Levels Premium was created to easily draw important levels of support and resistance for the active trader. The indicator will give you all important levels (support/resistance) to watch for a wide range of assets. Trading without these levels on your chart is like driving a car for a long journey without a roadmap. You would be confused and blind. Support and resistance levels should be used as guideline
Meridian Pro
Ottaviano De Cicco
4 (3)
Meridian Pro 2.00:MT5向けプロ仕様マルチタイムフレーム・トレンドマトリクス Meridian Pro 2.00 は、MetaTrader 5 向けのプロ仕様の適応型トレンドマトリクスです。オリジナルの Meridian トレンドエンジン、クリーンなチャート ribbon、確定足ベースのシグナル矢印、8時間足 dashboard、Fuel momentum、weighted consensus、synthetic HTF processing、そしてチャート上に直接表示される上位足コンテキストラインを統合します。 目的はシンプルです。現在のトレンド、マルチタイムフレーム構造、強度、momentum、EA-ready 状態を、複数チャートに無関係なインジケータを重ねるのではなく、1つの整理された workflow で読むことです。 Meridian Pro の違い 1つの適応型エンジン - 同じ volatility-aware Meridian ロジックを M1 から W1 まで適用します。 Synthetic HTF architecture - 上位足行は下位足デ
Neuro Poseidon is a new indicator by Daria Rezueva. It combines precise trading signals with adaptive TP/SL levels - creating best possible trades as a result! Message me and get  Neuro Poseidon Assistant  as a gift to automize your trading process! What makes it stand out? 1. Proven profitability on all assets and timeframes 2. Only confirmed BUY and SELL signals present on the chart 3. Adaptive TP & SL levels generated by the software for each trade 4. Easy to understand - suitable for al
Bill Williams Advanced is designed for automatic chart analysis using Bill Williams' "Profitunity" system. The indicator analyzes four timeframes at once. Manual (Be sure to read before purchasing) Advantages 1. Analyzes the chart using Bill Williams' "Profitunity" system. Signals are displayed in a table in the corner of the screen and on the price chart. 2. Finds all known AO and AC signals, as well as zone signals. Equipped with a trend filter based on the Alligator. 3. Finds "Divergence Bar
TPA True Price Action indicator reveals the true price action of the market makers through 100% non-repainting signals strictly at the close of a candle! TPA shows entries and re-entries, every time the bulls are definitely stronger than the bears and vice versa. Not to confuse with red/green candles. The shift of power gets confirmed at the earliest stage and is ONE exit strategy of several. There are available now two free parts of the TPA User Guide for our customers. The first "The Basics"
ARICoin is a powerful trading companion designed to generate high-probability entry signals with dynamic TP/SL/DP levels based on volatility. Built-in performance tracking shows win/loss stats, PP1/PP2 hits, and success rates all updated live. Key Features: Buy/Sell signals with adaptive volatility bands Real-time TP/SL/DP levels based on ATR Built-in MA Filter with optional ATR/StdDev volatility Performance stats panel (Success, Profit/Loss, PP1/PP2) Alerts via popup, sound, push, or email Cust
SUPERHEROインジケーターは、「オールインワン」方式に基づいて設計された多通貨対応の取引システムです。このインジケーターは市場を独自に分析し、取引の開始および終了のタイミングに関するシグナルを提供します。ストップロス注文とテイクプロフィット注文を使用します。R:R比率は1:1です。 このシステムはスマートフォンにプッシュ通知を送信できるため、PCに縛られることなく「外出先」からでも取引を行うことができます。自己勘定取引を行う企業に最適です。 すべてのお客様への特典: このインジケーターをご購入いただいたすべてのお客様に、私から特別なユーティリティをプレゼントいたします。その内容は以下の通りです: 自動的にストップロス注文とテイクプロフィット注文を発注します 価格が目標水準に達すると、自動的に取引を決済します 指値注文による取引に対応しています 平均化取引モードに対応しています この優れた、しかも非常に便利なユーティリティをプレゼントとして受け取りたい場合は、SUPERHEROインジケーターをご購入後、直ちにMQL5プラットフォームのプライベートメッセージを通じて私までご連絡くださ
Apex Patterns PRO インジケーターをご購入いただくと、それに基づいたExpert Advisorを無料でご提供します。 自己最適化するチャートパターンおよびブレイクアウト分析システム 従来のパターンスキャナーは固定のパラメータに依存しているため、市場のボラティリティや構造が変化するとパフォーマンスが低下することがよくあります。 Apex Patterns PROは、構造的なチャートパターン認識、モメンタムフィルタリング、および統計的な自己最適化を単一の分析フレームワークに統合することで、変化する市場環境に適応するように設計されています。 適応型スキャンエンジン 自己最適化パターンモード 最近の履歴データから適切なパターンパラメータを自動的に検索し、静的な設定を使用するのではなく、現在の市場の動きに合わせてインジケーターの構造検出を適応させます。 スマートブレイクアウトフィルタリング 古典的なパターン認識と、モメンタム、ボリューム、プライスアクションの指標を組み合わせます。すべてのブレイクアウトを同じように扱うのではなく、システムが根底にある市場構造を評価し、現在の統計
Precision Spike Detector
Francisco Mandomo Simbine
5 (2)
Precision Spike Detector V3 – Institutional-Grade AI Trading System Attention: The price increases by US$50 for every 10 purchases.  Final price: US$599 Precision Spike Detector V3   is a   state-of-the-art, institutional-grade market analysis system   for   MetaTrader 5 , designed to detect   high-probability market movements   in synthetic indices such as   Boom, Crash, GainX, and PainX . After purchase, send me a private message to receive the optimized configuration files,  the installation
このインジケーターを購入された方には、以下の特典を 無料 で提供しています: 各トレードを自動で管理し、ストップロスとテイクプロフィットを設定し、戦略ルールに基づいてポジションを決済する補助ツール 「Bomber Utility」 様々な銘柄に合わせたインジケーターの設定ファイル(セットファイル) 「最小リスク」、「バランスリスク」、「待機戦略」 の3つのモードで使用できる Bomber Utility 用の設定ファイル このトレーディング戦略をすぐに導入・設定・開始できる ステップバイステップのビデオマニュアル ご注意: 上記の特典を受け取るには、MQL5のプライベートメッセージシステムを通じて販売者にご連絡ください。 オリジナルのカスタムインジケーター 「Divergence Bomber(ダイバージェンス・ボンバー)」 をご紹介します。これは、MACDのダイバージェンス(乖離)戦略に基づいた 「オールインワン」型のトレーディングシステム です。 このテクニカルインジケーターの主な目的は、価格とMACDインジケーターの間に発生するダイバージェンスを検出 し、将来の価格の動きを示
The Oracle Pro
Ottaviano De Cicco
5 (1)
The Oracle Pro:MT5向け合成マルチタイムフレーム・バイアスエンジン The Oracle Pro は、要求の高いプロのトレーダーのために作られた MetaTrader 5 向けのプレミアム・マルチタイムフレーム バイアスエンジン です。ひとつの問いに規律をもって答えます。すなわち、各タイムフレームの現在の方向バイアスは何か、その強さはどれほどか、そしてタイムフレーム同士はどれだけ一致しているか。すべては確定足のみで計算され、リペイントはありません。 The Oracle Pro はマルチファクター・コンセンサス・システムです。独自のインジケーターと最適化されたアルゴリズムを単一の高度なコンセンサス・ベクトルに統合し、それを単一のインジケーター・インスタンス内で現在足と上位足のスタックにわたって読み取ります。複数のチャートにばらばらのツールを積み重ねる代わりに、です。 これは Oracle コンセンサス手法のプロフェッショナルな進化形です。深さ、マルチタイムフレームの文脈、ダイバージェンスの知見をひとつの規律ある作業フローに収めたいトレーダーのための、プレミアム操作コンソ
ScalpPoint is a powerful trading companion designed to generate high-probability entry signals with dynamic TP/SL/DP levels based on volatility. Built-in performance tracking shows win/loss stats, PP1/PP2 hits, and success rates — all updated live. Key Features: Buy/Sell signals with adaptive volatility bands Real-time TP/SL/DP levels based on ATR Built-in MA Filter with optional ATR/StdDev volatility Performance stats panel (Success, Profit/Loss, PP1/PP2) Alerts via popup, sound, push, or emai
AriFocus - Non-Repainting Buy/Sell Signals AriFocus - one clear signal. AriFocus marks buy and sell signals directly on the chart and suggests a stop-loss level for each one. Every signal is confirmed on bar close and never repaints. - Buy/sell arrows, confirmed on bar close - Suggested stop-loss level for every signal - Trend band and candle coloring to show direction at a glance - 10 ready-made presets, or your own settings (14 calculation methods) - Pop-up, push and email alerts with entr
ARIPoint
Temirlan Kdyrkhan
1 (4)
ARIPoint is a powerful trading companion designed to generate high-probability entry signals with dynamic TP/SL/DP levels based on volatility. Built-in performance tracking shows win/loss stats, PP1/PP2 hits, and success rates all updated live. Key Features: Buy/Sell signals with adaptive volatility bands Real-time TP/SL/DP levels based on ATR Built-in MA Filter with optional ATR/StdDev volatility Performance stats panel (Success, Profit/Loss, PP1/PP2) Alerts via popup, sound, push, or email Cu
Zain Gold Scalping
Ahmed Gamal Abdel Nasser Mohamed
A complete price-action analysis tool built around dual independent entry logic, each confirmed against a volatility band, combined with a configurable set of nine optional confirmation filters that let you shape exactly how conservative or aggressive the tool's signals behave. Core Strategy Two independent entry setups, each triggering only when price moves outside a dynamic volatility band — giving two distinct ways to spot potential reversal points, which can be used together or separately.
Sqn Max Indicator Sqn Max is an exclusive indicator to trade the market with high effectiveness. The indicator is based on price action, volatility and trend. This indicator is as simple as possible but not too simple. The indicator can generate alerts to ease the trading process. You don't have to stay all day in front of your screen. The indicator can be used with any class of assets and with any time frame. It is possible to achieve better results trading our list of selected assets. We achi
Volatility Master for MetaTrader is a real-time dashboard tool that scans up to  50 symbols  to identify high-volatility , trending markets instantly. With bullish/bearish signals, customizable alerts, and a user-friendly interface, it helps you avoid range-bound conditions and focus on high-probability trades. Clarity leads to confidence. Trade confidently and protect your capital effectively with this powerful dashboard. We don't offer free or bonus indicators in exchange of reviews from you.
Naked Forex Tweezer Pro Indicator Tweezer Pro Indicator is a pattern recognition indicator for Forex, Stocks, Indices, Futures, Commodities and Cryptos. The standard Tweezer is a two bar pattern. Our enhanced version is a multi-bar pattern. We filter the patterns for you so that you only get the     best and most effective patterns   and ignore the noise. The Tweezer pattern is a simple and effective pattern to trade. The strategy that comes with the Tweezer is based on price action. The Twe
Advance AI Scanner is a multi-symbol analysis indicator for MetaTrader 5. It scans Forex pairs, metals, energy, stock indices and cryptocurrencies at the same time and rates each instrument with its own self-training model. It explains in plain English what moved each market and why, and it estimates how far upcoming economic news usually moves each symbol, measured on your broker's own price history. $199 instead of $499. 10 copies left at this price. One time purchase  Installation and User
Fibonacci Expansion and Retracement PRO Fibonacci retracing and extended line tools for the MT5 platform, ideal for traders who use the  Golden Section trading Demo: https://www.mql5.com/zh/market/product/35884 The main function: 1. You can draw multiple sets of Fibonacci retracements directly, and the relationship between important return points is clear at a glance. 2. Can draw Fibonacci extensions 3. The Fibonacci foldback and extension of the line can be moved left and right for easy ob
CGE Trading Suite
Carl Gustav Johan Ekstrom
5 (3)
Institutional-Grade Analytics for MT5 The full analytical edge of a professional trading desk, built into your MT5 chart. A full guided tour walks you through every feature step by step. Standard retail platforms lack the depth required for professional market analysis. The CGE Trading Suite bridges this gap, transforming MetaTrader 5 into a comprehensive workspace. By integrating 18 proprietary modules into a single, unified chart interface, the suite eliminates fragmented analysis. It provide
作者のその他のプロダクト
MANZANO FOOTPRINT ORDER FLOW Footprint, Order Flow and Volume Analysis for MetaTrader 5 Manzano Footprint Order Flow is an analytical indicator for MetaTrader 5 that brings together Footprint charts, Bid x Ask, Delta, Cumulative Delta (CVD), Imbalances, Volume Profile, VWAP, Market Depth and Time & Sales in an interactive environment. It allows traders to examine activity within individual candles, identify volume concentrations, compare buying and selling pressure, and analyse how market partic
Manzano Risk Reward Box You can download the Pro version, featuring a comprehensive control panel, order management, trailing stop, break-even functionality, and funded account protection features, here: https://www.mql5.com/es/market/product/202156 Manzano Risk Reward Box is a visual trade planning and risk management tool for MetaTrader 5, designed to help traders prepare their positions directly on the chart before execution. It allows users to create visual BUY and SELL scenarios, define the
FREE
Harmonic Pattern Suite Pro Introduction Harmonic Pattern Suite Pro is an indicator designed to identify and display harmonic structures on the chart based on X-A-B-C-D sequences. Its purpose is to present pattern formations that meet geometric and proportional criteria, providing a clear visual representation directly on the chart. The indicator automates the detection process, removing the need for manual measurement of ratios and allowing the user to review the structural configuration withou
FREE
Manzano SMC Institutional Pro Smart Money Concepts, ICT, historical statistics, market structure and liquidity analysis for MetaTrader 5. Any SMC indicator can draw zones. Manzano SMC Institutional Pro measures how those zones have behaved in your market and compares their results with randomly chosen levels. See the structure. Check the historical evidence. Understand the market context. Manzano SMC Institutional Pro brings Smart Money Concepts (SMC), ICT methodology, Market Structure, Order B
Smart Adaptive Trend Flow MT4 Professional adaptive trend, market structure, price levels and flow analysis indicator for MetaTrader 4. Would you like to test it before purchasing? Request a fully functional trial version by sending us a private message through MQL5.com and evaluate the indicator directly on your own charts. A Complete Market View Smart Adaptive Trend Flow MT4 combines several analytical components in a single indicator: Adaptive trend analysis. BULLISH and BEARISH market regim
Smart Adaptive Trend Flow MT5 Professional adaptive trend, market structure, price levels and flow analysis indicator for MetaTrader 5. Would you like to test it before purchasing? You can request a fully functional trial version by sending us a private message through the MQL5 messaging system . This allows you to evaluate the indicator and all its features before making a purchase decision. A Complete Market View in a Single Chart Smart Adaptive Trend Flow MT5 has been developed to provide a
Plan, execute and protect every trade in MetaTrader 5: exact risk-based lot size, automatic management, baskets and Prop Firm rules in a single panel. Manzano Trade Manager Pro is a professional trade manager for MetaTrader 5, designed especially for traders who trade funded accounts (Prop Firms) and need advanced control over risk, execution and position management. It brings together in one tool visual trade planning, automatic lot size calculation, individual, collective and basket managemen
Manzano Index Intelligence Analysis of the underlying constituents of the Nasdaq 100, S&P 500 and Dow Jones 30 for MetaTrader 5 It is not just about knowing where an index is moving, but understanding what is driving that move. BEFORE BUYING OR TRYING: CHECK YOUR BROKER The indicator requires your broker to provide both the index CFD and CFDs for its constituent stocks within the same MT5 account. Having a Nasdaq 100, S&P 500 or Dow Jones 30 CFD does not necessarily mean the broker also offers i
フィルタ:
レビューなし
レビューに返信